ELECTROCHEMICAL INCINERATION OF REFRACTORY ORGANIC POLLUTION BY
ELECTROCHEMICALLY GENERATED FENTON’S REAGENT
AZRI YAMINA MOUNIA
1*and ZEROUALI DJILALI
21Department of chemistry, Faculty of Sciences, Laboratory of Electrochemical, University of Sciences and Technology of Oran U.S.T.O. BP -1505 el M’naouer Oran 31000 –Algeria
2Department of chemistry, Faculty of Sciences, Laboratory of Electrochemical, University of Sciences and Technology of Oran U.S.T.O. BP -1505 el M’naouer Oran 31000 –Algeria
(Received: June 28, 2012 - Accepted: July 20, 2012) ABSTRAT
The electro-Fenton process is an electrochemical method for waste water treatment based on the production of hydroxyl radicals via H2O2 generation in
the presence of ferrous ions. The aim of this work is of applied Electro-Fenton technique to incinerate lubricate additive biocide N,N-methylenebismorpholine (C9H18N2O2).the effect of some operational parameters such as applied cathodic potential, the electrolysis time and aeration,concentration of supporting electrolyte
on the generation of H2O2 was investigated. The optimal cathodic potential on the generation of H2O2 production was -500mV/SCE corresponding to a density
current of 1.4 mA/cm², the production of hydrogen peroxide with the aeration and electrolysis time, then became stationary after 2h of electrolysis, the low pH favorite production of H2O2 electro generated. Whereas the
Concentrations of supporting electrolyte of the solution have a slight affect. The degradation and incineration of N,N-methylenebismorpholine in the optimized parameters was also investigated (potential, current density, COD/Fe2+ ratio ) the result indicates that 97% of COD was incinerated at 50mA and the optimal
concentration of catalyst is between 28 and 58mg/l.
Keywords: indirect oxidation, Electro-Fenton, biocide, hydrogen peroxide, oxygen reduction
INTRODUCTION
Recently advanced oxidation process (AOP) have attracted more and more attention because they can be used to degrade pollutants in water by generating plenty of hydroxyl radical (OH•) 1,2 .hydroxyl radicals (OH•) are non selective,
very powerful oxidants E.OH/OH-= + 2.8V/SHE 3 (standard hydrogen electrode)
in acidic medium. They are able to react with organic pollutants to mineralize these pollutants into CO2, water and inorganic ions.
The production of radical hydroxide is generated by redox reaction of hydrogen peroxide and ferrous ions.
H2O2 + Fe2+ “ OH• + Fe3+ + OH- (1)
Reaction (1) is called “Fenton Reaction” and the process is called “Fenton process”.
In traditional Fenton process, the reactants H2O2 and Fe2+ are simultaneously
added to the polluted solution and it is employed to efficiently treat a variety of industrial pollution. 4 Waste water containing a range of organic compounds
like phenol, pesticides, plastic additives and rubber chemicals with low cost and relatively easy operation and maintenance 5,6 however despite its high
efficiency the wide of application of traditional Fenton process is limited by its acidic pH requirement (pH 2-4) and the formation of ion sludge in the coagulation step as well as high cost of hydrogen peroxide.
In order to avoid the use of expensive hydrogen peroxide electro-Fenton process was established in this process hydroxyl radicals are produced via Fenton’s reaction in homogeneous medium via electro-generated H2O2 and
dissolved iron ions
According to Pourbaix diagrams, the oxidation/reduction of water and oxygen gives a possible electrochemical way to produce hydrogen peroxide using cathodic reduction of dissolved oxygen in aqueous medium 7 Pourbaix .
H2O2 + 2 H+ + 2 e- → 2H2O (2)
The electro-reduction of dissolved oxygen is a multi-electron reaction associated with the formation of a large number of intermediates. Oxygen can be reduced directly to H2O in a 4-electron transfer:
O2 + 4 H+ + 4 e- → 2 H2O (3)
Or, first reduced to H2O2 in a 2-electron transfer:
O2 + 2 H+ + 2 e- → H2O2 (4)
This 2-electron transfer is then followed by reduction of H2O2 to H2O
H2O2 + 2 H+ + 2 e- → 2H2O (5)
The reaction (4) can take place at different cathode such as mercury pool
8, gold9 reticulate vitrous carbon 10,11, activated carbon fiber 12 ,carbon felt 13,14,15and O
2 -diffusion cathodes16,17,18.
The oxidative power of electrogenerated hydrogen peroxide is enhanced in the presence of Fe2+ ions 8,17 to produce OH• through a Fenton process (reaction
1).
The regeneration of Fe2+ can occur either direct cathodic reaction (reaction
6) by the oxidation of an organic (reaction 7) or by the reaction with H2O2
(reaction 8) 19.
Fe3+ + e- → Fe2+ (6)
Fe3+ + R•→ Fe2+ +R+ (7)
Fe3+ +H
2O2→ [Fe-O2H]2+ +H+→HO2• (8)
In general, all reductions in aqueous medium are perturbed by hydrogen evolution, which depends on hydrogen overpotential of the cathodic materials.
Mercury, lead and graphite exhibit large overpotentials for hydrogen evolution, however, mercury and lead are not compatible with the environment and their use in industrial application is not recommended. Actual research on adapted materials focused on Boron Doped Diamond (BDD) which provides a high O2 –overvoltage anode. In this case, hydroxyl radicals are formed in
the medium from Fenton’s reaction (reaction 1) 20,21. However, industrial
applications need electrodes with specific large surfaces, high availability and a minimum cost.
In this paper, we studied the performance of the graphite cathode for H2O2 electrogeneration, and investigated the degradation of N,N
Methylenebismorpholine in the Electro-Fenton process using the graphite cathode . The influence of the different operational parameters on the H2O2
electrogeneration (cathodic potential, time of aeration and electrolysis, concentration of supporting electrolyte) and the incineration and mineralization of N,N-methylenebismorpholine (ratio COD/Fe2+, current) which affect the
efficiency of electro-Fenton process in biocide oxidation in acidic solutions. EXPERIMENTAL
Reagent and material:
The graphite electrode was supplied by Algerian Electrical and Gas Company. The surface of electrode was polished using 600 and 1600SiC papers. After polishing the electrode were rinsed, sonicated for 15min, and rinsed with deionized water.
petroleum refinery of Arzew the N,N Methylenebismorpholine is used as biocide to preserve lubricating oil from a biological oxidation. Thus, it is likely a non biodegradable and cannot be treated by conventional techniques. It is not compatible with biological process for the treatment of waste water issued from petrochemical industries. Therefore, it is necessary to incinerate this petrochemical pollutant before the biological treatment. The N,N Methylenebismorpholine was used without further purification and its structure is shown in fig 1. All other chemicals including sulfuric acid H2SO4, sodium
hydroxide NaOH, anhydrous sodium sulfate Na2SO4, hydrogen tetrachlorate
HAuClO4 99%; heptahydrate ferrous sulfate FeSO4 7H2O, anhydrous ferric
sulfate Fe2(SO4)3, sulfate titanium (IV) Ti(SO4)2 ,potassium dichromate
K2Cr2O7 and ammonium iron(II) sulfate hexahydrate (Mohr salt) Fe(NH4)
(SO4)2.6H2O, silver sulfate Ag2SO4, sulfate mercury HgSO4 were of analytical
grade, deionized water was used.
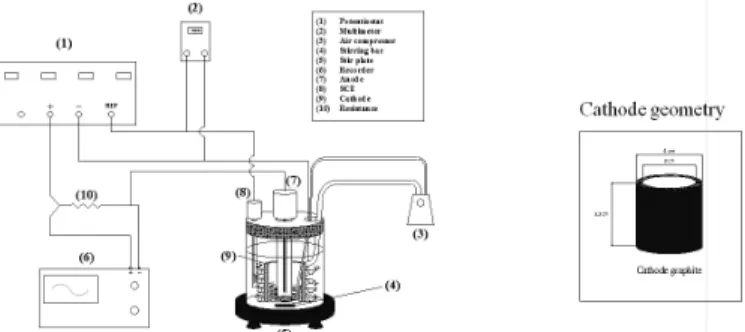
Figure 2. Experimental device for potentiodynamic test
RESULTS AND DISCUSSION
In this part of study, the factors significantly affecting the limiting current of H2O2 generation, including cathodic potential, time of electrolysis and
aeration, pH and concentration of supporting electrolyte were investigated using potential mode, under this mode, the electrical current was monitored on line by digital multimeter.
Optimal cathodic potential:
A solution of 0.5M Na2SO4, pH 3 and saturated air (oxygen level = 7 mg/l)
were used for cathodic polarizations, air was bubbled during all experiment with a rate of 1 liter /mn. A range of potentials of -100mV/SCE to -900mV/ SCE were investigated with a scan rate of 2mV/s.
Polarization curve reflect current response with the cathodic potential applied I-E, the figure (3) shows that, two cathodic limiting current for oxygen and hydrogen peroxide reductions respectively according to reaction (2) and (3).
Figure1. Structure of N,N-Methylenebismorpholine. Electrochemical device (figure 2):
Electrolyses were carried out in double compartment cells, POTENTIOSTAT TACUSSEL 40-1X was used in both potentiodynamic and potentiostatic experiments. The working electrode was industrial graphite with tubular form and an area of 36 cm2 (Figure 1).A saturated calomel
electrode (SCE) was used as a reference electrode. The counter electrode was platinum grid of 2cm². Potentiodynamic curves were plotted using an X-T POTENTIOMETRIC LEYBOLD-HERAREUS ENREGISTRER.
The anodic compartment consists of a glass tube with a glass-frit bottom which allows its separation of the cathodic compartment. Anodic compartment was filled with a solution of Na2SO4 0.5M as an electrolyte and the cathodic
compartment was filled with an acidified solution of H2SO4 (pH 3). Oxygen
was bubbled through the cathodic compartment during the experiment with a flow rate of 1 liter/ min. The resulting oxygen concentration was measured by oxymeter (Model 97-08-99, Orion Research INC).
Experimental solutions were magnetically stirred.
Analytical procedures: Hydrogen peroxide analysis:
Concentration of hydrogen peroxideproduced in the cell was analyzed by titanic sulfate, Ti(SO4)2 method Eisenberg 22. Spectrophotometer SAFAS 320G
was used to measure the light absorbance of the Ti4+- H
2O2 orange complex at
410 nm.
Chemical oxygen demand (COD) analysis:
Chemical oxygen demand (COD) was measured according to French AFNOR norm. Samples withdrawn during electro Fenton processing were filtered through a Millex-GV Millipore hydrophilic membrane with 0.22µm pore diameter.
The organic matter was oxidized by potassium dichromate K2Cr2O7 in the
presence of silver sulfate (catalyst) and mercury sulfate for 2h at 170ºC. COD was calculated from the following equation:
COD (mg O2 l-1) = 8000 (VMS blank – VMS sample) × NMS / V0
Where VMS blank and VMS sample are the volumes of standard Mohr salt solution
using the blank and sample respectively, NMS is the normality of the Mohr salt,
and V0 is the volume of the sample.
Figure 3.Potentiodynamic polarization of industrial graphite.
Experimental conditions: Scan rate = 2mV/s; pH=3; CO2= 7mg/l,
Electrolyte = 0.5M Na2SO4
The reduction of oxygen to give peroxide occurs in the potential range of E= -300mV/SCE to -500mV/SCE, and the hydrogen peroxide reduction in the range of -500mV/SCE to -650mV/SCE. For more negative values of potential, cathodic current increases strongly exhibiting hydrogen evolution (eq 9).
2H+ + 2e- →H
2 (9)
These results are in accordance with Qiang (2002) and Oturan and Pinson (1992). 23,24 Potentials of -600mV/SCE was obtained by Chu (1995) and
-550mV/SCE by Hsioa and Nobe (1993)25,26. The use of industrial graphite
gives a good concordance in the range of reduction potential of reduction of oxygen to hydrogen peroxide.
At the anode, the oxidation of H2O releases oxygen gas and protons
2H2O→4H+ + O2+4e- (10)
The protons so generated will be driven to the catholyte electro-statically and partially supplement the protons consumption during the synthesis of H2O2.
Potentiostatic electro generation of hydrogen peroxide
Potensiostatic electro generation of hydrogen peroxide was performed in a two compartments cell. Effect of applied potentials, time of electrolysis and time of pre-aeration before the start of electrolysis were experimented for Na2SO4 (0.05M) and (pH 3) solution was magnetically stirred. Hydrogen
peroxide was analyzed every hour.
Effect of applied potential:
Figure 4 shows the effect of applied potential on hydrogen peroxide electro generation in the range of -100mV to -900mV/SCE. The curve represents a maxima in the potential range from E= -500 to E= - 550mV/SCE, corresponding to the limiting current as in Figure 3.
Effect of pH
Electro-Fenton reaction is generally performed in acidic conditions pH values between 2 and 4. The optimum pH value was 2.8 for hydroxyl radical production 28, Ferric species begin to precipitate as ferric hydroxides
at higher pH values. On the other hand, ferric species form stable complexes with H2O2 at lower pH values. Here, we only investigated the effect of pH on
the electrogeneration of H2O2 using graphite cathode in a solution of Na2SO4
0.5M in acidic region between the pH values of 1 to 4 by addition of H2SO4 or
NaOH in the absence of ferric or ferrous ions, it can be seen from figure 6. That there is a maximum value, of the H2O2 concentration is pH3 after 120min of
electrolysis. However below pH2 the maximum value of H2O2 concentration
was of 16mg/l. this could be explained by the formation of oxonium ion (H3O2+)29,30, which enhanced the stability of H2O2 (eq 10). At same time, a low
pH also promotes hydrogen evolution according to (eq 9), and then reduces the number of active sites for generating hydrogen peroxide 31.
H2O2 + H+ → H3O2+ (11)
Above pH2, the values of H2O2 concentration decreases due to insufficient
protons.
This result indicates that pH2 is the optimal condition which is an agreement with 23. A fig.6b show that i stabilize quickly after the electrolysis
is initiated. A steady-state condition is rapidly reached because a constant dissolved oxygen concentration is maintained in solution.
Figure 4. Effect of cathodic potential on Hydrogen Peroxide production
Electrolyte: Na2SO4 (0.5M), p H 3, time of electrolysis: 2h
A maximum rate of hydrogen peroxide(26 mg/l) was electrogenerated at a potential of -500mV/SCE after 2 hours of electrolysis. The best potential for oxygen to Hydrogen peroxide reduction (-500 mV/SCE) is in accordance with the theorist results of 23,24,27(Qiang et al 2002; Oturan et al 1992; Tzedakis et al
1989) and with the potentiodynamic results.
Effect of time of electrolysis and time of aeration:
Effect of aeration before and during the electrolysis on hydrogen peroxide production was experimented for a potential of -500mV/SCE. A solution of Na2SO4 (0.5M) pH 3, magnetically stirred was used in the experiment.
The results of figure 5 showed two parts: a rapid increase of hydrogen peroxide production for times less than approximately 2h, then the production of hydrogen peroxide stabilizes.
The stabilized production of hydrogen peroxide is probably due to equilibrium between the production and decomposition of hydrogen peroxide .Pourbaix’s7 diagram of hydrogen peroxide Pourbaix shows instability domains
of hydrogen peroxide which can be oxidized to form oxygen or reduced to form H2O. The plateau of Figure 5 indicates that the production and decomposition
occur simultaneously after two hours of electrolysis. The decomposition becomes higher and the production increases slightly.
Figure 5. effect of time of aeration
Figure6. Generation of H2O2 at various applied pH: (a) accumulated
concentration; (b) current. Experimental conditions: time of aeration 1 H time of electrolysis 120min and E=-500mV/SCE
(a)
Effect of the concentration of support electrolyte
Electro-generation of H2O2 was examined in different concentration of
supporting electrolyte (0.05 to 0.9mole/l of Na2SO4) of pH 3 and cathodic
potential of -500mV/SCE. From fig 7, it could be conclude that the electro-generation of H2O2 is weakly affected by change in the concentration of
supporting electrolyte whose role is to decrease the ohmic resistance of the solution and eliminate the migration current Im, the overall current is I=Im+Id. We believe that this current is eliminated by the highly acidic solution and transport phenomena in electrical mobility are much higher than that of sodium ions. However the addition of supporting electrolyte helps to improve the characteristics of conductive solution.
We chose a concentration 0.05 mole/l for the rest of this part of study. This value has been used by several researchers 32,33.
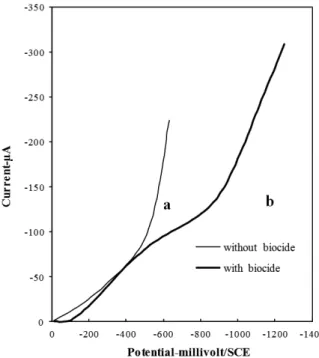
Figure 8. Influence of biocide on the cathodic polarization
Na2SO4 0.05M, H2SO4 pH=3, Sr= 2mV/s, Nr = 4000 rds/min
a: without biocide, b: with biocide pure 1ml.
Figure 7. Effect of the concentration of Na2SO4 in electro-generation of
H2O2
Experimental conditions: time of aeration 1 H time of electrolysis 120min and E=-500mV/SCE.
Electrochemical characterization of N, N Methylenebismorpholine:
The electrochemical behavior of the biocide N, N Methylenebismorpholine was analyzed using cathodic and anodic potentiodynamic polarizations. A solution of Na2SO4 (0.05M) (p H 3) added with 1 ml of N,
N-Methylenebismorpholine was experimented on graphite electrode. The pH was systematically controlled during all experiment.
Cathodic polarization:
The graphite electrode was cathodically polarized in the potential range of 0 to -1300mV/SCE with a scan rate of 2mV/s.
The result in figure (8b) shows the effect of biocide on the electrochemical behavior of the system. The potentials of oxygen and hydrogen reduction moved to larger negative values and the limiting current of oxygen becomes higher.
The addition of biocide increases the pH from 3 to 7 moving the potentials of hydrogen evolution to more negative values in accordance with thermodynamics data.
Anodic polarization:
Figure 9, shows the result of anodic polarization of graphite at the potential range of 0 to 1400mV/SCE. The curve (9a), without Biocide, shows one anodic limiting current relative to the oxidation of water to hydrogen peroxide in the potential range of: E= 150 to 700 mV/ SCE:
H2O → H2O2 + 2H+ + 2e- 7 (12)
The addition 1mL of Biocide, exhibits two limiting currents in the potential range of 70mV/SCE to 400mV/SCE for the first one and 400mV/ SCE to 600mV/SCE for the second. Oxygen gas evolution occurs for anodic potential more positively for the solution containing biocide.
The second limiting current corresponds to an oxidation process controlled by a mass transfer.
Figure 9. Influence of biocide on the anodic polarization
Na2SO4 0.05M, H2SO4 pH=3, Sr= 2mV/s, Nr = 4000 rds/min
a: without biocide, b: with biocide pure 1ml.
The electrochemical behavior of N,N-Methylenebismorpholine depends on the applied potential and its polarity. In the cathodic regions, the potentials of reduction of oxygen and hydrogen moved to the higher negative values. This result can be attributed to the alkaline nature of N,N-Methylenebismorpholine. The neutralizing effect of biocide must be considered for the application of electro- Fenton process and the pH was systematically controlled.
range of: E= 400 mV/SCE to E= 600 mV/SCE with a controlled diffusion kinetics.
This result appears interesting because it represents an opportunity for a direct incineration of the biocide.
Optimization of incineration parameters:
Indirect incineration of N,N-Methylenebismorpholine was performed using an galvanostatic experimental device .
A DC generator LEYBOLDS 15V /20A was used as a current source, industrial graphite and platinum were used as cathode and anode respectively. The digital ammeter and millivotmeter were used for current and potential measurements.
A solution of 0.05M Na2SO4, air saturated (7 mg/l) at pH 3 were used for
all experiments.
The solution was magnetically stirred and air was bubbled during all the experiment. Ferrous sulfate was added as Fenton catalyst, 5 minutes before starting the electrolysis. pH was adjusted in the range of 2.5 to 3 by the adding of sulfuric acid.
The performance of incineration was controlled by COD analysis every hour. Effect of applied current and ratio COD/ Fe++ were experimented.
The effect of ferrous Sulfate:
A solution of 200 ml of 0.05M sodium sulfate containing pure biocide (COD: 1000 mg/l) was first galvanostatically (I = 30 mA) electrolyzed during six hours without addition of ferrous ions, the residual COD was analyzed every hour. Figure (10a) shows different changes on COD concentration.
The addition of 12 mg/l of ferrous ions corresponding to an approximate ratio of [H2O2]/ [ironII] = 2 34 shows a decrease in residual COD Figure (10b);
a residual concentration of 580 mg/l was unregistered after 5h of electrolysis representing to an efficiency of 42%.
Figure 10. Abatement of COD as a function of time. a: not catalyst b: with a catalyst ,[Fe2 +] = 12 mg /l. I = 30mA.
Applied current effect
Applied current of 12, 30.50, 75 and 100mA were used in similar conditions of previous experiment; figure 11 shows time evolution of the residual COD.
The kinetics appears more rapid during the first two hours then the decrease of residual COD becomes lower.
The residual values of COD for six hours of electrolysis and for different applied currents are shown in Figure (12).
Figure 11. Effect of applied current on the incineration of biocide.
0, 05M Na2SO4 pH =3, CODi = 1000mg/l ± 100, [Fe2+] = 12 mg/l,
CO2= 7mg/l.
Figure 12. Variation of residual concentration of COD as a function of
current
The result shows two parts of different applied currents. For the current less than - 50 mA(-1.4 mA/cm²), the rate of incineration of the biocide increase with the applied current, for the current higher than 50 mA the rate of incineration stabilises and becomes independent.
The current density of -1.4 mA/cm² for N,N Methylenebismorpholine incineration represents an optimum, the potential of the cathode was unregistered each 30 mn and showed a variation in the values range of : - 480 mV /SCE at starting of electrolysis to – 620 mV/SCE at the end of electrolysis.
Ratio COD/ (FeII) effect
The effect ratio of COD/ (FeII) on efficiency of the incineration was experimented for two hours of galvanostatic electrolysis (50 mA).
A solution of Na2SO4 0.05M (pH 3) saturated with air and magnetically
stirred was used in all experiments.
N, N Methylenebismorpholine was added in the saturated air sulphate solution and the equivalent of COD was systematically analyzed.
Concentrations of 12 to 224 mg/l of Fe2 + were experimented, figure (13)
shown the results.
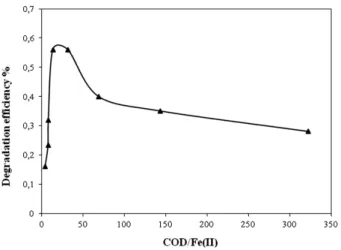
Figure (13), shows a maximum efficiency for a COD / Fe II ratio of 20 to 30, then a decrease in efficiency with an increasing concentration of catalyst Fe2 +.
The decrease in the rate of degradation of biocide for a higher concentration of Fe2 + is due to the reduction in hydroxyl radicals.
Figure 13. Effect of the ratio COD/Fe+ + on efficiency of incineration.
The optimal concentration of ferrous ions for the degradation ofN,NMethylenebismorpholine is in the range of 30 to 50 mg/l for an applied current of 50mA and a level of COD to mineralize of 900 to 1000 mg/l.
Incineration of N, N Methylenebismorpholine:
This experiment represents the application of the optimized parameters of indirect incineration of N,N Methylenebismorpholine contained in an aqueous acidified sulphate solution saturated with air .
The solution was first aerated by air insufflations for two hours and then electrolyzed during 1 hour to produce and accumulate hydrogen peroxide.
The solution was magnetically stirred and air was introduced with a rate of 1 litre per minute during all experiments.
The biocide and Fe II were then introduced after the electro generation of hydrogen peroxide. At each hour, we analyzed the residual COD. This result is represented in Figure (14).
Figure14. Evolution of residual COD with time of electrolysis
Na2SO4 (0,05M), p H 3, I= 50mA, Fe II= 30 mg/l, CO2: 7mg/l
Initial COD: 880 mg/l
The Figure 14 shows a complete mineralization of the biocide after six hours of electrolysis. The residual COD is 22 mg/l and the efficiency is 97%.
CONCLUSION
Cathodic incineration catalyzed by ferrous /ferric redox ion pair (Electro-Fenton) of the N,N-Methylenebismorpholine showed a very good efficiency, more than 97 % of the associated COD was oxidized after five hours of electrolysis.
Industrial graphite, largely used in electrical and electrochemical industries was used as cathode in this study; it exhibits a good electrochemical behavior with high hydrogen overpotential and a good availability.
A potential range of -500 mV/SCE to – 550 mV/SCE are optimal for the electrogeneration of hydrogen peroxide and the incineration of N,N- Methylenebismorpholinein the Electro Fenton process.
A COD/Fe++ ratio of approximately 30 represented the best ratio in this
study, 97% of COD was incinerated after two hours of saturated aeration and five hours of electrolysis.
The electro Fenton process exhibits, large possibilities for incineration or pre-incineration of refractory substances to biological treatments.
The N,N-Methylenebismorpholine presents an anodic electroactivity and offers other electrochemical possibilities for the treatment of aqueous waste containing this substance.
ACKNOWLEDGMENTS
The author gratefully acknowledges Dr. Zerouali Djilali for his helpful discussion.
REFERENCES
1. W.R Chen, C.M Sharpless,et al , Environ. Sci. Technol.,40, 2734–2739, (2006)
2. M.O Buffle, G.V Gunten, Environ. Sci. Technol.,40, 3057–3063,(2006) 3. J Riquelme-Valdes, E Ramirez , et al, J. Chil. Chem. Soc, 53, 4, (2008). 4. P.Ghosh, A.N Samanta,et al. Desalination., 5,DES-10187,(2010) 5. M.Ogura, I.Astuti,et al , Ind. Eng.Chem. Res., 43, 1890–1893,(2004) 6. J.A Zazo, J.A Casas, et al, Environ. Sci.Technol., 39, 9295–9302,(2005). 7. M Pourbaix., Atlas d’équilibres électrochimiques. Edition :
Gauthier-Villars Paris, 1963
8. M.A Oturan, J. Pinson,J. Phys. Chem.,99(38), 13948-13954,(1995) 9. M.S.El-Deab, T.Okajima , et al, Journal of the Electrochemical
Society,150 (7) A851-A857, (2003)
10. A.A.Gallegos, D Pletcher,. Electrochimca. Acta, ,44(14), 2483-2492, (1999)
11. Y.B Xie,. X.Z. Li, Mater. Chem. Phys., , 95,(1), 39-50, (2006)
12. A.Wang, J. Qu, et al, Dyes Pigments, Journal of Zhejiang University - Science A,65(3), 227-233 ,( 2005)
13. M.A Oturan. ,J Appl Electrochem, ,30, 475-782,(2000)
14. K Hanna,S. Chiron, et al, Water Research, , 39(12), 2763-2773 (2005) 15. J.J Aaron, M.A Oturan, Environmental applications, Turk. J. Chem.,
,25(4), 509-520, (2001)
16. E. Brillas, E. Mur, et al, Appl. Catal. B-Environ, 16(1), 31-42,(1998) 17. B Boye, M.M. Dieng, et al , Environ Sci. Technol, ,36(13), 3030-3035.
(2002)
18. E.Brillas, B. Boye, et al, Electrochimca. Acta, 49(25), 4487-4496,(2004) 19. Y.H Huang, S. Chou, et al, ,Water Sci.Technol., 39 145–149,(1999) 20. C Flox, S. Ammar, et al,Appl. Catal. B: Environ., 67, 93-104,(2006) 21. A Morão, A.Lopes, et al, Electrochemica Acta.,49, 1587-1595,(2004) 22. Eisenberg G.M. Industrial and Engineering chemistry, ,15(5),
1943,pp.327-328
23. Z.Qiang., J.H Chang ,et al.Water Research, ,36, 85-94, (2002) 24. M.A Oturan, J. Pinson. New J.Chem.,16, 705-710,(1992).
25. C.H Chu, The electrochemical oxidation of recalcitrant organic compounds. Ph.D. dissertation, University of Delaware, Newark, DE, (1995).
26. Y.H Hsiao , K Nobe,. J. Appl. Electrochem, ,23, 943-946,(1993) 27. T Tzedakis, A. Savall , M.J Clifton, J. Appl. Electrochem., ,19, 911-
921,(1989)
28. Y Sun, J.J Pignatello. Environ. Sci. Technol.,27, 304-310,(1993) 29. B.G Kwon, , D.S. Lee, et al,. Water Res., 33 (9) : 2110–2118,(1999) 30. M. Zhou, Yu, Q,et al, Purif. Technol.,57 (2) : 380–387,(2007) 31. W.P Ting, M.C.Lu, et al, J. Hazard. Mater.,161 (2–3) : 1484–1490,(2009) 32. E Brillas. B Boye , et al, Chemosphere, ,51,227-235,(2003)
33. I Sires, C.Arias,et al, J.Environ.Chem.,1,26-28,(2004)
34. E. Petrucci, A. Da Pozzo, P, et al, J. Appl. Electrochem, 35, 391-498, (2005)
35. M.C Edelhi, Contribution à l’étude de dégradation in situ des pesticides par procédés d’oxydation avancés faisant intervenir le fer. Application aux herbicides phénylurées. Doctorat de l’université de Marne-La-Vallée. Université de Marne-La-Vallée, 2004.