HAL Id: hal-00406631
https://hal.archives-ouvertes.fr/hal-00406631
Submitted on 23 Jul 2009HAL is a multi-disciplinary open access
archive for the deposit and dissemination of sci-entific research documents, whether they are pub-lished or not. The documents may come from
L’archive ouverte pluridisciplinaire HAL, est destinée au dépôt et à la diffusion de documents scientifiques de niveau recherche, publiés ou non, émanant des établissements d’enseignement et de
Understanding the atomic-scale contrast in Kelvin
Probe Force Microscopy
Laurent Nony, Adam Foster, Franck Bocquet, Christian Loppacher
To cite this version:
Laurent Nony, Adam Foster, Franck Bocquet, Christian Loppacher. Understanding the atomic-scale contrast in Kelvin Probe Force Microscopy. Physical Review Letters, American Physical Society, 2009, 103, pp.036802. �10.1103/PhysRevLett.103.036802�. �hal-00406631�
APS/123-QED
Understanding the atomic-scale contrast in Kelvin Probe Force
Microscopy
Laurent Nony1,2,∗, Adam S. Foster3,4, Franck Bocquet1,2 and Christian Loppacher1,2 (1)Aix-Marseille Universit´e, IM2NP,
Av. Normandie-Niemen, Case 151,
F-13397 Marseille CEDEX 20, France and (2)CNRS,
IM2NP (UMR 6242), Marseille-Toulon, France
(3)Department of Physics, Tampere University of
Technology P.O. Box 692, FIN-33101 Tampere, Finland
(4)Department of Applied Physics, Helsinki University of Technology,
P.O. Box 1100, FIN-02015 HUT, Finland
(Dated: July 23, 2009)
Abstract
A numerical analysis of the origin of the atomic-scale contrast in Kelvin probe force microscopy (KPFM) is presented. Atomistic simulations of the tip-sample interaction force field have been combined with a non-contact Atomic Force Microscope/KPFM simulator. The implementation mimics recent experimental results on the (001) surface of a bulk alkali halide crystal for which simultaneous atomic-scale topographical and Contact Potential Difference (CPD) contrasts were reported. The local CPD does reflect the periodicity of the ionic crystal, but not the magnitude of its Madelung surface potential. The imaging mechanism relies on the induced polarization of the ions at the tip-surface interface owing to the modulation of the applied bias voltage. Our findings are in excellent agreement with previous theoretical expectations and experimental observations.
Published in Phys. Rev. Lett. 103, 036802 (2009)
PACS numbers: 07.79.Lh, 31.15.bu, 77.22.Ej, 73.40.Cg Keywords:
Kelvin Probe Force Microscopy (KPFM) is a scanning probe technique able to compensate dynamically for electrostatic forces occurring between biased tip and sample [1]. These forces stem from work function differences between the electrodes when they do not consist of similar materials and/or when they carry charges. The KPFM controller supplies the proper DC voltage to align the Fermi levels of both electrodes, thereby compensating the electrostatic force. Thus, KPFM provides access to the contact potential difference (CPD) between electrodes. On the experimental level, KPFM is combined with the noncontact-Atomic Force Microscopy operating mode (nc-AFM) [2]. Hence, topographical and CPD images are acquired simultaneously.
For a decade, KPFM has proven its ability to map CPD changes at the nanometer scale with an accuracy of a few millivolts [3]. On various semi-conducting surfaces, several groups reported CPD images with contrasts showing atomic features, the positions of which were consistent with the ones of the surface atoms [4, 5, 6, 7]. However, some of these early works pointed out the inconsistency between the measured CPD and the values derived from other experimental techniques or from theoretical calculations [2, 5, 6]. It was stated that, when measured close to the surface, the so-called “local CPD” (LCPD) is influenced by the surface potential. Thus, it differs from the intrinsic CPD that relies on the macroscopic concept of work function [8]. The physics that connects the magnitude of the LCPD and the surface potential still remains under debate. Recently, Loppacher et al. have described a self-consistent analytical approach to the LCPD probed by KPFM with a metallic tip on the (001) facet of a bulk KBr crystal [9, 10]. It was found that the LCPD neither reflects the actual tip-surface CPD, nor the local surface potential, but an effective potential following the atomic corrugation of the Madelung surface potential of the ionic crystal [11], but differing from it due to the strong influence of the geometry of the tip. The theoretical framework proposed so far helps in understanding the origin of the atomic-scale KPFM contrast, but relies on an unrealistic geometry of the metallic tip. Thus, the analytical approach remains questionable, as it is known that the atomic-scale topographical contrast on alkali halides stems from tips apexes carrying ionic clusters, preliminarily picked-up from the surface [12].
In this letter, we conjointly improve the description of the tip and its interaction with the sample in order to achieve simultaneous atomic-scale topographical and KPFM contrast on a (001) NaCl surface. The work is carried out on the base of atomistic simulations of
FIG. 1: (Color online) a- Sketch of the numerical tip-surface setup. We have set zm = 5 mm
compared to z which scales in the sub-nm range. b- Sketch of the NaCl unit cell showing the 17×17 mesh used to calculate the (x,y,z,V) four-dimensional tip-surface force field. We have focused on four particular sites: anionic (A), cationic (C) and hollow (H1, H2) sites.
the force field occurring between a realistic tip consisting of a metallic body carrying a NaCl cluster and a defect-free (001) NaCl surface. Topographical and LCPD images are computed by means of our non-contact AFM/KPFM simulator [10, 13] operated in the frequency modulation-KPFM mode (FM-KPFM). For the first time, particular attention is paid to the ionic polarization at the tip-surface interface, i.e. the displacements of the ions induced by the inherent modulation of the applied bias voltage in the KPFM technique. Although weak (i.e. few picometers), and hence neglected so far, these displacements are crucial to understand the atomic-scale KPFM signal.
The calculations of the force field were performed using atomistic simulations as imple-mented in the code SCIFI [14]. The interatomic forces are computed from a sum of pairwise Buckingham potentials acting between ions treated atomistically in a shell model with cou-pled oppositely charged cores and shells in order to describe their polarizabilities. The SCIFI code also allows for the inclusion of metallic electrodes at the tip and below the surface. The interaction of these with ions in the surface and tip are treated by the method of images [14]. Using this approach, we can simulate the polarization of conductors and resultant atomic
geometries in the system as a function of tip position and applied bias voltage. Parameters for the species considered were taken from Ref.[15]. Unless specified otherwise, all cores and shells were allowed to relax completely with respect to interatomic and image forces with a convergence criterion of 1 meV/˚A per ion. Hence, in this work we take into account ionic relaxation, and electronic and ionic polarization as a function of both atomic interactions and applied bias.
The properties of the NaCl(001) surface are well understood and can be well represented by a slab of 4 atomic layers containing 10×10 ions, with those in the bottom layer and edges kept fixed (cf. Fig.1a). The NaCl slab is embedded within a semi-infinite, 5 mm thick, slab merely treated by means of its dielectric constant. A 64-atom cubic cluster of NaCl is em-bedded into a metallic sphere of radius R =5 nm and oriented such that the [111] direction is perpendicular to the surface with a Na atom at the apex. The most stable configuration is found when the cluster protrudes from the end of the sphere with a height RA = 0.3 nm
(cf. Fig.1a), and carries an intrinsic charge of +1 inducing an opposite charge in the vicinity of the metallic part of the tip. The NaCl atoms within the sphere are frozen and play no role in the calculation of image forces. They act as ghost metal atoms stabilizing the tip apex. The metallic part of the tip is biased with respect to the counter-electrode holding the crystal.
In order to compute images with the simulator, the NaCl unit cell was meshed with a 17×17 grid (cf. Fig.1b). We have focused at four particular sites: anionic site A, cationic site C and hollow sites H1 and H2 which are made inequivalent owing to the orientation of
the cluster with respect to the surface symmetry. For each pixel of the mesh, the distance de-pendence (z-dede-pendence) of the force is computed by 5 pm steps from 0.3 nm to 2.0 nm and the bias dependence by 10 mV steps from -3.4 V to +2.3 V. A Van der Waals force has been added as a long-range background (equ.2.4 in Ref.[16]). A long-range electrostatic force has been included as well with the form given in Ref.[10] (equ.14). It stands for a phenomenolog-ical term which depicts capacitive effects between the cantilever and the counter-electrode when mounted in the microscope. When using the simulator, we have made sure that the controllers are all in a critically damped regime when the tip is close to the surface, which prevents imaging artifacts from occurring [13]. The main parameters of the simulations are: oscillation amplitude: 8 nm peak-to-peak, resonance frequency: 150 kHz, cantilever stiffness: 30 N/m, Q-factor: 30000, scan size: 1.03×1.03 nm2, scan speed: 1.5 s/line. The
intrinsic charge of the tip induces a long-range background force. Thus, a DC voltage, Vref
dc = −0.91 V, is applied to the tip to compensate for it and nullify the LCPD at large
tip-sample separation (i.e. >2 nm). Vref
dc can be interpreted as the opposite of the
macro-scopic CPD of the electrodes-bulk NaCl system. Thus, the bias voltage applied to the tip is Vb = Vdc+ Vdcref+ Vacsin(2πfmodt). The FM-KPFM mode was implemented with a 500 Hz
bandwidth lockin amplifier and a 50 Hz bandwidth controller. The AC bias modulation is Vac =0.5 V and fmod = 1 kHz.
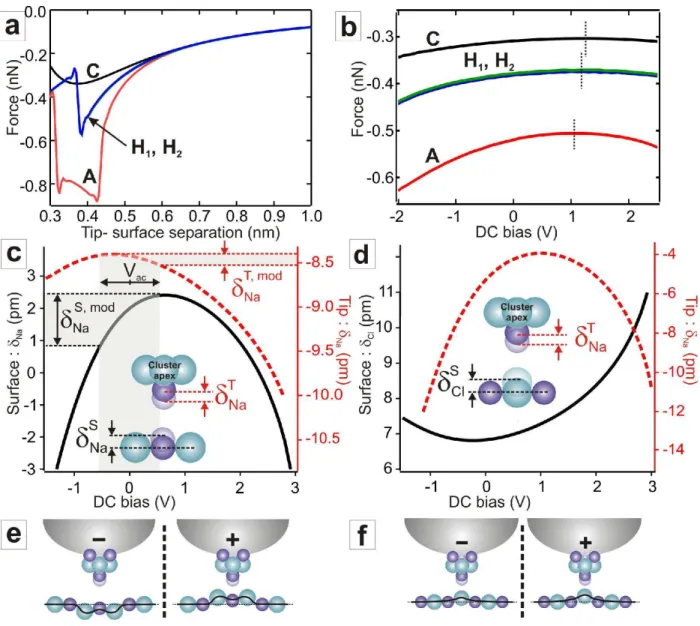
Force vs. distance curves computed above the four sites with Vdc = 0 V are shown in
Fig.2a. Below 0.45 nm, tip/surface instabilities on top of anionic and hollow sites occur. Above 0.45 nm, the curves differ significantly, although exhibiting similar features to those reported with almost equivalent setups [12, 17, 18]. Force vs. Vdc curves measured at z =
0.45 nm are shown in Figs.2b for the four sites. The maxima of the curves differ between sites (cf. dotted lines): -304 pN at 1.22 V (site C) and -506 pN at 1.06 V (site A). The curves systematically deviate from the capacitive, parabolic-like, behavior which stems from the polarization of the ions at the tip-surface interface. To assess this, the displacements of the cores of the foremost Na+ ion of the tip (δT
Na) when placed above a Na+ (δNaS ) and above
a Cl− (δS
Cl) of the slab as a function of Vdcare shown in Figs.2c and d, respectively. They are
measured at z = 0.45 nm. A positive displacement means that the ion is displaced upwards (e.g. towards the tip when considering an ion of the slab). We only have focused on the displacements of the cores of the ions that were judged as the most significant, although the polarization process involves all the ions of the interface and their shells. For the sake of clarity, we have as well sketched the ionic displacements in Figs.2e and f.
On top of Na+at zero bias, the foremost cation of the tip is attracted towards the surface:
δTNa=-8.5 pm. Simultaneously, the Na+ of the slab undergoes a moderate displacement
towards the tip: δS
Na=+2 pm. This behavior stems from the balance between the
short-range chemical interaction and the local electrostatic interaction due to the intrinsic charge of the tip, merely compensated by Vref
dc at large distance. With Vdc>0, the foremost cation
of the tip remains attracted to the surface, while the Na+ is repelled within the slab. The
short-range electrostatic force is then strengthened between the tip cation and the four Cl−
closest neighbors of the Na+ of the slab, while the latter is repelled from the tip because
of the overall less favourable chemical and electrostatic interaction. With Vdc < 0, the
FIG. 2: (Color online) a- Force vs. distance curves measured above the four sites at Vdc = 0 V.
Below 0.45 nm the tip becomes unstable. b- Force vs. Vdc curves at z = 0.45 nm. The dependence
is not parabolic. c- Vdc dependence of the displacement of the foremost Na+ ion of the tip, δTNa
(dashed line), at z = 0.45 nm on top of Na+ of the slab and corresponding δSNa displacement. The AC bias modulation (grey) triggers the dynamic displacement of the ions at the interface (δT, S, modNa ). d- Same as c- except that the tip is now placed on top of Cl−. Scheme of the induced
ionic displacements as a function of the sign of the bias voltage on top of e- Na+, and f- Cl−.
Then, the set of Cl− and Na+ ions are repelled within the slab.
On top of Cl− at zero bias, the favourable combination of the chemical interaction and of
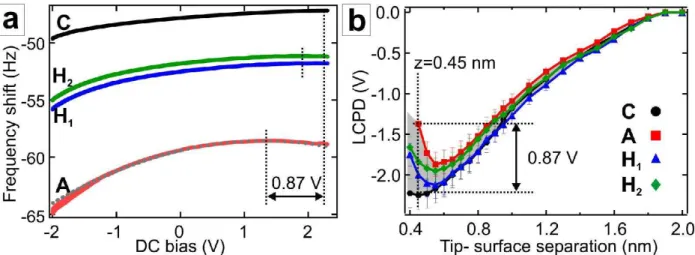
FIG. 3: (Color online) a- Spectroscopic curves computed above the four sites at z = 0.45 nm. A shift of 0.87 V is noticed between anionic (A) and cationic (C) sites. b- Distance dependence of the LCPD above the four sites derived from the spectroscopic curves. In the short-range regime, the LCPD exhibits a resonance-like and site-dependent behavior.
by Vref
dc produces significant displacements of the ions at the interface (δNaT = −6 pm; δClS =
+7 pm). With Vdc > 0, the local electrostatic interaction increases the mutual attraction
between ions. With Vdc < 0, the Cl− of the slab is less attracted by the tip due to the
repulsive electrostatic interaction, but the tip cation remains attracted by the surface, likely because the chemical interaction is still large enough.
Hence, when the KPFM controller is engaged, the AC modulation of the bias triggers complex dynamic displacements of the cluster/surface ions. As predicted in Ref.[9], these displacements support the LCPD signal and explain the deviation from the usual capacitive parabolic law of the force vs. bias voltage curve. Indeed, when performing the following simulations while freezing the ionic polarization, no KPFM contrast occurs.
The distance dependence of the LCPD has been investigated by means of spectroscopic curves, during which the KPFM and distance controllers are disengaged. When the tip is biased, the maximum of the curve gives a DC voltage opposite to that of the LCPD: Vdc = −VLCPD. In Fig.3a are shown spectroscopic curves measured on top of each site at
z = 0.45 nm. As expected from the force vs. Vdc curves, the spectroscopic curves deviate
from the parabolic-like behavior (shown for site A, dotted greyed curve) and the positions of the maxima differ upon sites. Furthermore, the latter positions do not match those of
the force vs. Vdc curves. However, such an effect is expected to occur as soon as the z and
V dependencies of the interaction force cannot be separated, i.e. F (z, Vdc) 6= h(z)g(Vdc). A
shift of +0.87 V is measured from site A to site C, consistently with the larger repulsive electrostatic force observed above cations. These measurements have been reproduced for various tip-surface separations and gathered in Fig.3b. When increasing the separation, the LCPD first decreases and then increases to converge towards 0 at large distance, as stated before. Below 0.6 nm, the curves unbundle and differ significantly upon sites (greyed area). These curves are equivalent to ∆f vs. distance curves that are driving the magnitude of the topographical contrast. Hence, a site-dependent KPFM contrast is indeed expected while scanning for tip-surface separations smaller than 0.6 nm. The magnitude of the LCPD contrast can be derived as well. At z = 0.45 nm (dotted line), a maximum of 0.87 V is expected. At equivalent height, the Madelung surface potential is 0.14 V [9]. This resonance-like effect has been predicted theoretically [10] and reported experimentally [19]. It relies on a subtle balance between short-range and long-range electrostatic forces, both weighting in the manner the LCPD is compensated.
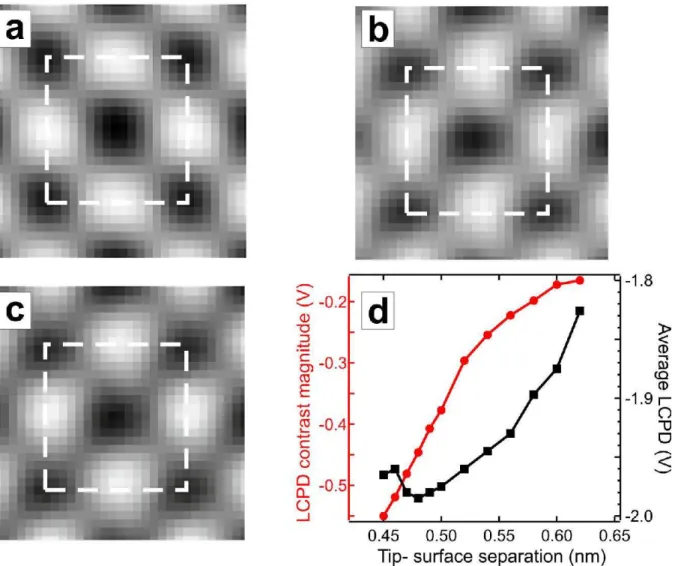
Finally, topographical and LCPD images have been computed (cf. Figs.4a and b, c, respectively). Images shown in Figs.4a (38 pm full scale) and b (0.56 V full scale) have been simultaneously computed with the distance controller engaged. The scan has been engaged on top of a cation at z = 0.45 nm, corresponding to ∆fset = −47.22 Hz. The
dotted area depicts the unit cell shown in Fig.1b. Topographical and LCPD images cations as depressions, consistently with spectroscopic curves. The magnitude of the contrasts as well as the distance range are in good agreement with our former experimental observations (30 pm, 0.1 V) [9]. Fig.4c (0.86 V full scale) is a LCPD image computed with similar conditions as b, but at constant height z = 0.45 nm, i.e. with the distance controller disengaged. The magnitude of the contrast matches the predicted behavior (cf. Fig.3b, dotted line). In Fig.4d is reported the magnitude of the LCPD contrast as a function of the tip-surface separation. The curve is deduced from scans for which the distance regulator was engaged. The average value of the LCPD (mean contrast) has been reported as well. It follows accurately the evolution of the average LCPD derived from the spectroscopic curves (cf. Fig.3b). The contrast expands around the average value while keeping confined within the greyed area, the size of which is controlled by the combination between short-range electrostatic and chemical forces. Thus, relevant information about the LCPD is not only
FIG. 4: (Color online) a- Topographical image computed with the nc-AFM/KPFM simulator. The vertical contrast is 38 pm. b- Simultaneously computed LCPD image. The contrast ranges from -2.24 to -1.69 V (0.56 V full scale). c- LCPD image computed at constant height, z = 0.45 nm. The contrast ranges from -2.24 to -1.38 V (0.86 V full scale), consistently with the expected range deduced from Fig.3b. d- Evolution of the magnitude of the LCPD contrast (dots) and of the average LCPD (squares) as a function of the distance.
carried by the magnitude of the KPFM contrast, but also by its average value.
In conclusion, we have described an imaging mechanism which accounts for simultaneous occurrence of atomic-scale topographical and KPFM contrast on a perfect bulk alkali halide crystal. A realistic tip design and a fine description of the bias and distance dependence of the interaction force field were mandatory to explain the KPFM contrast. Our major
finding is that the modulation of the bias voltage triggers short-range electrostatic forces which induce dynamic displacements of the ions at the tip-surface interface. These render the short-range chemical forces self-consistently bias-dependent. As the LCPD stands for the DC bias that makes the total force maximum, its mere interpretation on the basis of the Madelung surface potential is insufficient. Nevertheless, our results obtained on a defect-free ionic surface are crucial in order to quantitatively interpret KPFM measurements on more complex surfaces including defects.
ASF wishes to thank L. N. Kantorovich for useful discussions and acknowledges support from the Academy of Finland and ESF FANAS programme.
[1] J. Weaver and D. Abraham, J. Vac. Sci. Technol. B 9, 1559 (1991). [2] S. Kitamura and M. Iwatsuki, Appl. Phys. Lett. 72, 3154 (1998).
[3] Y. Rosenwaks, R. Shikler, T. Glatzel, and S. Sadewasser, Phys. Rev. B 70, 085320 (2004). [4] Y. Sugawara, T. Uchihashi, M. Abe, and S. Morita, Appl. Surf. Sci. 140, 371 (1999). [5] S. Kitamura, K. Suzuki, M. Iwatsuki, and C. Mooney, Appl. Surf. Sci. 157, 222 (2000). [6] K. Okamoto, K. Yoshimoto, Y. Sugawara, and S. Morita, Appl. Surf. Sci. 210, 128 (2003). [7] F. Krok et al., Phys. Rev. B 77, 235427 (2008).
[8] K. Wandelt, Appl. Surf. Sci. 111, 1 (1997).
[9] F. Bocquet, L. Nony, C. Loppacher, and T. Glatzel, Phys. Rev. B 78, 035410 (2008). [10] L. Nony, F. Bocquet, C. Loppacher, and T. Glatzel, Nanotechnology 20, 264014 (2009). [11] R. Watson, J. Davenport, M. Perlam, and T. Sham., Phys. Rev. B 24, 1791 (1981). [12] R. Hoffmann et al., Phys. Rev. Lett. 92, 146103 (2004).
[13] L. Nony et al., Phys. Rev. B 74, 235439 (2006).
[14] L. Kantorovich, A. Foster, A. Shluger, and A. Stoneham, Surf. Sci. 445, 283 (2000). [15] A. Shluger, A. Rohl, D. Gay, and R. Williams, J. Phys.: Condens. Matter 6, 1825 (1994). [16] M. Guggisberg et al., Phys. Rev. B 61, 11151 (2000).
[17] M. Lantz et al., Phys. Rev. B 74, 245426 (2006).
[18] A. Schirmeisen, D. Weiner, and H. Fuchs, Phys. Rev. Lett. 97, 136101 (2006). [19] S. Burke et al., Nanotechnology 20, 264012 (2009).