HAL Id: hal-02391655
https://hal.inria.fr/hal-02391655
Submitted on 11 Dec 2019
HAL is a multi-disciplinary open access
archive for the deposit and dissemination of
sci-entific research documents, whether they are
pub-lished or not. The documents may come from
teaching and research institutions in France or
abroad, or from public or private research centers.
L’archive ouverte pluridisciplinaire HAL, est
destinée au dépôt et à la diffusion de documents
scientifiques de niveau recherche, publiés ou non,
émanant des établissements d’enseignement et de
recherche français ou étrangers, des laboratoires
publics ou privés.
Line rendering of 3D meshes for data-driven
sketch-based modeling
Bastien Wailly, Adrien Bousseau
To cite this version:
Bastien Wailly, Adrien Bousseau. Line rendering of 3D meshes for data-driven sketch-based modeling.
Journées Francaises d’Informatique Graphique et de Réalité virtuelle, AFIG, Nov 2019, Marseille,
France. �hal-02391655�
Line rendering of 3D meshes for data-driven
sketch-based modeling
Bastien Wailly and Adrien Bousseau
Université Côte d’Azur, Inria
Figure 1: SynDraw is a tool to generate synthetic vector drawings from triangular meshes.
Abstract
Deep learning recently achieved impressive successes on various computer vision tasks for which large amounts of training data is available, such as image classification. These successes have motivated the use of computer graphics to generate synthetic data for tasks where real data is difficult to collect. We present SynDraw, a non-photorealistic rendering system designed to ease the generation of synthetic drawings to train data-driven sketch-based modeling systems. SynDraw processes triangular meshes and extracts various types of synthetic lines, including occluding contours, suggestive contours, creases, and demarcating curves. SynDraw exports these lines as vector graphics to allow subsequent stylization. Finally, SynDraw can also export attributes of the lines, such as their 3D coordinates and their types, which can serve as ground truth for depth prediction or line labeling tasks. We provide both a command-line interface for batch processing, as well as an interactive viewer to explore and save command-line extraction parameters. We will release SynDraw as an open source library to support research in non-photorealistic rendering and sketch-based modeling.
Keywords : sketch-based modeling, non-photorealistic rendering, geometry processing, deep learning, vector graphics
1. Introduction and Related Work
A number of recent sketch-based modeling systems rely on deep learning to recover 3D information from 2D line drawings. Examples include the voxel-based approach of Delanoy et al. [DAI∗18], the multi-view reconstruction technique by Lun et al. [LGK∗17], the parametric modeling approach by Nishida et al. [NGDA∗16], the normal map prediction by Su et al. [SDY∗18], and the method by Li et al. that
com-bines depth, normal and curvature-field information [LPL∗18]. All these data-driven approaches require thousands of drawings aligned with ground-truth 3D shapes for training, which would be cumbersome to collect by hand. The common solution to this chal-lenge is to resort to synthetic training data, obtained by rendering 3D shapes in a line-drawing style. Exist-ing systems either rely on custom non-photorealistic renderers, or on the publicly available rtsc software [DFRS03]. However, these renderers only support a subset of popular synthetic lines, and export them as bitmaps, which limits the range of stylization effects that can be applied on the resulting drawings. We pro-pose an open source library for line rendering, which
Bastien Wailly and Adrien Bousseau / Line rendering of 3D meshes for data-driven sketch-based modeling
Figure 2: Overview of our system. Each successive step edits the view graph (3D lines and vertices). The out-put SVG file is generated based on the state of the graph after all these steps.
we designed to fulfill the needs of modern data-driven sketch-based modeling systems.
Our library – called SynDraw – provides the follow-ing features:
• It takes as input triangle meshes, which is the most common form of geometry.
• It extracts popular line types described in the non-photorealistic rendering litterature – occlud-ing contours [HZ00], suggestive contours [DFRS03], ridges and valleys [OBS04], and demarcating curves [KST08].
• It outputs lines as vector polylines for easy styliza-tion.
• It also outputs the 3D coordinates, visibility, and types of the lines, which can serve as guiding chan-nels for stylization or as targets for prediction tasks. • It can be called via a command line interface, which facilitates the generation of large datasets with scripting. It also offers an interactive 3D viewer for parameter tuning.
• It runs on CPU only, and as such is simple to deploy on computing clusters.
SynDraw thus represents a valuable alternative to the Blender plug-in FreeStyle [GTDS04], which offers more advanced stylization features but was not de-signed for lightweight generation of large datasets. The main algorithmic components of SynDraw follow the recommendations made by Benard and Hertzmann in their tutorial on line rendering [BH18]. We implemen-ted SynDraw on top of the libIGL geometry library [JP∗18], using C++11.
2. Overview
Figure 2 lists the main steps of the line extraction al-gorithm implemented in SynDraw. The system takes as input a 3D mesh and a set of parameters, and out-puts an SVG file that encodes the lines and associated attributes as vector polylines. The first processing step consists in parsing the mesh to extract line segments
that will populate the view graph – a data structure that represents all lines and vertices (see the tutorial by Benard and Hertzmann for details [BH18]). The second step applies various filters to remove spurious lines. The third step determines which lines are visible from the current viewpoint. Finally, the extracted line segments are chained to form long polylines, before being exported. We offer user control on each of these steps through the input parameters.
3. Implementation 3.1. Line extraction
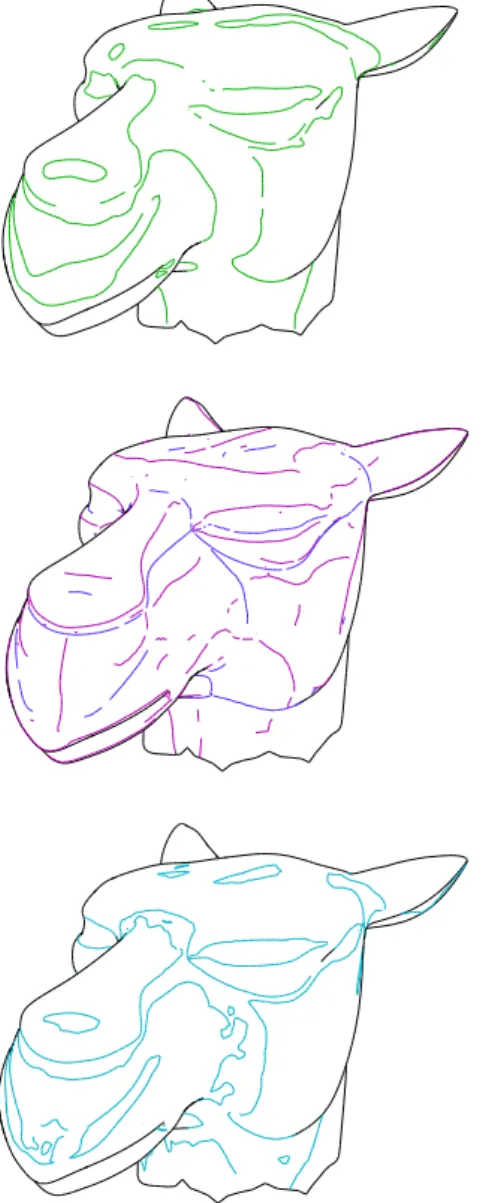
We extract different types of surface lines using pop-ular non-photorealistic rendering algorithms, namely smooth occluding contours [HZ00], suggestive con-tours [DFRS03], sharp and smooth creases [OBS04], demarcating curves [KST08], some of which are illus-trated in Figure 3. Many of these lines require access to differential quantities on the surface, such as the prin-cipal directions of curvature and the radial curvature. We compute these quantities using the method by Panozzo et al. [PPR10]. We use a Lazy Loading design pattern to avoid computing anything not needed given the input line parameters.
3.2. Filtering
The algorithmic lines we have implemented can quickly yield cluttered drawings if extracted with de-fault parameters. We allow users to filter out some of the lines based on several geometric criteria (Fig 4). First, users can remove lines that are facing the cam-era based on the angle between view direction and surface normal. This filtering was originally proposed by DeCarlo et al. to improve view coherency of sug-gestive contours [DFRS03], we extend it to all line types. Second, users can remove lines based on view-dependent curvature using the hysteresis threshold-ing technique proposed by Panozzo et al. for creases [PPR10], which we again extend to all line types.
3.3. Visibility
As suggested by Benard and Hertzmann [BH18], we construct the view graph embedding all 3D line seg-ments and identify singularity nodes (vertices) where visibility might change. The singularities split the graph into multiple regions sharing the same visib-ility. As a consequence, we can use one raycast per such region to determine if it is occluded or not. A particular singularity type that is difficult to compute is the image-space intersection, which requires com-puting every intersection between any line and an oc-cluding contour, which has a complexity of roughly O(n2) in the number of lines. We lower the complexity to O(n log(n)) by using a Binary Space Partitionning (BSP) algorithm. Other methods exist with the same complexity, such as the sweep line algorithm described by Bentley [BO79].
c
Figure 3: Camel head model with different line types, with filtering step disabled. From top to bottom : suggestive contours, ridges and valleys, demarcating curves. Occluding contours are in black.
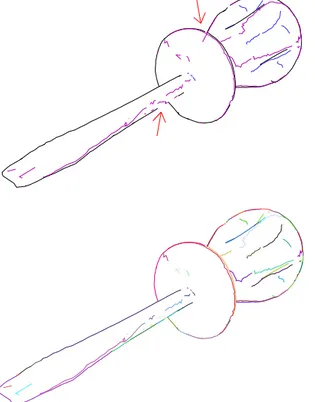
3.4. Chaining
The last processing step consists in chaining the ex-tracted line segments to form long polylines that re-semble human-drawn pen strokes. We assign consecut-ive segments to the same chain if they share the same line type and visibility, and if their angle is below a threshold. We also used those chains to make the vis-ibility more robust by casting multiple rays per chain and voting for the dominant visibility [BH18], which is especially beneficial at grazing angle where numerical imprecision often occurs (Fig 5).
Figure 4: Example of filtering based on facets normals, on cheburashka model (top: before, bottom: after).
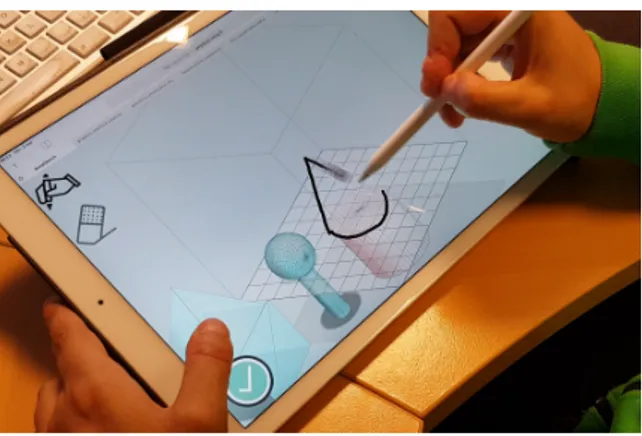
4. Interactive viewer
We provide an interactive OpenGL viewer to help users find suitable extraction parameters for the 3D shapes they are interested in (Figure 6). While the visibility computation can take a few seconds, other parameters can be adjusted in real time. Users can then save their parameter settings to apply them to other shapes via scripting.
5. Stylization tools
We developed a set of simple tools to further pro-cess the drawing, such as simulating sketchy drawings by perturbing the vector polylines with random 1D and/or 2D noise (Figure 7). Such stylization effects greatly improve the realism of the line drawings, which in turn makes the trained deep learning algorithms more robust to real-world sketches. Other effects in-clude varying the line width and opacity according to line type or depth. We also provide a simple rasterizer based on the CairoSVG library to convert the styl-ized drawings into bitmaps ready to be fed to deep networks.
Bastien Wailly and Adrien Bousseau / Line rendering of 3D meshes for data-driven sketch-based modeling
Figure 5: Impact of chaining. Top: chaining not ap-plied, visibility may be incorrect in regions of low graz-ing angle. Bottom: each unique color is a chain. Visib-ility is corrected thanks to multiple raycasts per chain.
Figure 6: The interactive viewer lets the user adjust extraction parameters and see their impact on the view graph.
Figure 7: Three levels of random noise illustrated on the teapot model.
6. Applications
SynDraw has already been used internally in several research projects. We demonstrated a procedural ap-proach for sketch-based modeling [WB19], where all deep networks have been trained with data produced by our system (Fig 8). We generated 100k synthetic drawings from simple meshes in around two days, which was enough to train our architecture for 20k iterations. Gryaditskaya et al. [GSH∗19] also used our tool to showcase the importance of prior knowledge on how designers draw when generating synthetic draw-ings, on the task of predicting normal maps from raster drawings.
7. Performance
Our system has been successfully tested on Unix and MacOS environments. On an Intel Xeon E5-2650 @ 2.2GHz (8 cores), a mesh with 50k facets is processed within one second to one minute, depending on the line types that are selected, with demarcating curves being the most costly type because of second order de-rivative computations. Larger meshes can take a signi-ficant amount of time to compute, while small meshes (<5k facets) are generally processed in a fraction of a second. We compute the parsing of a mesh in a parallel fashion and we believe other parts of the system could
c
Figure 8: We used SynDraw to generate training data for sketch-based modeling of parametric shapes.
also be optimized with parallel computing. One way to alleviate the potential overhead of the system is to gen-erate multiple drawings per mesh to reuse redundant computation such as non view-dependent curvature. We enable this optimization via a simple script-like C++ file that users can adapt to their needs.
8. Conclusion
We presented an open source library to generate syn-thetic drawings from 3D meshes. We designed and used this library to generate large training datasets for deep learning. The library is modular and can eas-ily be extended to include other line types, filtering methods, and stylization algorithms. The library also exports attributes of the lines, such as visibility and depth, and could be extended to support other attrib-utes such as semantic part labels. We hope that this library will foster research on data-driven sketch pro-cessing.
9. Acknowledgements
This work was supported by the ERC starting grant D3 (ERC-2016-STG 714221) and research and soft-ware donations from Adobe. We express special grate-fulness to Pierre Bénard for his help. We thank Adele Saint-Denis for her work in preparing the ground for the development of this tool.
Bibliography
[BH18] Bénard P., Hertzmann A.: Line draw-ings from 3d models. CoRR. Vol. abs/1810.01175 (2018).
[BO79] Bentley, Ottmann: Algorithms for re-porting and counting geometric intersections. IEEE Transactions on Computers. Vol. C-28, Num. 9 (Sep. 1979), 643–647.
[DAI∗18] Delanoy J., Aubry M., Isola P., Efros A. A., Bousseau A.: 3d sketching using multi-view deep volumetric prediction. Proceedings
of the ACM on Computer Graphics and Interactive Techniques. Vol. 1, Num. 1 (Jul 2018), 1–22. [DFRS03] DeCarlo D., Finkelstein A.,
Ru-sinkiewicz S., Santella A.: Suggestive contours for conveying shape. ACM Transactions on Graph-ics (Proc. SIGGRAPH). Vol. 22, Num. 3 (juillet 2003), 848–855.
[GSH∗19] Gryaditskaya Y., Sypesteyn M., Hoftijzer J. W., Pont S., Durand F., Bousseau A.: Opensketch: A richly-annotated dataset of product design sketches. ACM Trans-actions on Graphics (Proc. SIGGRAPH Asia). Vol. 38 (11 2019).
[GTDS04] Grabli S., Turquin E., Durand F., Sillion F.: Programmable style for npr line draw-ing. In Rendering Techniques 2004 (Eurographics Symposium on Rendering) (june 2004), Association for Computing Machinery.
[HZ00] Hertzmann A., Zorin D.: Illustrating smooth surfaces. ACM Transaction on Graphics (Proc. SIGGRAPH) (2000).
[JP∗18] Jacobson A., Panozzo D., et al.: libigl: A simple C++ geometry processing library, 2018. https://libigl.github.io/.
[KST08] Kolomenkin M., Shimshoni I., Tal A.: Demarcating curves for shape illustration. ACM Transactions on Graphics (proc. SIGGRAPH Asia). Vol. 27, Num. 5 (décembre 2008), 157:1–157:9. [LGK∗17] Lun Z., Gadelha M., Kalogerakis
E., Maji S., Wang R.: 3d shape reconstruc-tion from sketches via multi-view convolureconstruc-tional net-works. In 2017 International Conference on 3D Vis-ion (3DV) (2017).
[LPL∗18] Li C., Pan H., Liu Y., Sheffer A., Wang W.: Robust flow-guided neural prediction for sketch-based freeform surface modeling. ACM Transactions on Graphics (proc. SIGGRAPH Asia). Vol. 37, Num. 6 (2018), 238:1–238:12.
[NGDA∗16] Nishida G., Garcia-Dorado I., Aliaga D. G., Benes B., Bousseau A.: Inter-active sketching of urban procedural models. ACM Transactions on Graphics (proc. SIGGRAPH). Vol. 35, Num. 4 (2016).
[OBS04] Ohtake Y., Belyaev A., Seidel H.-P.: Ridge-valley lines on meshes via implicit surface fit-ting. ACM Transactions on Graphics (proc. SIG-GRAPH). Vol. 23, Num. 3 (août 2004), 609–612. [PPR10] Panozzo D., Puppo E., Rocca L.:
Effi-cient multi-scale curvature and crease estimation. In 2nd International Workshop on Computer Graph-ics, Computer Vision and MathematGraph-ics, GraVisMa 2010 - Workshop Proceedings (2010), pp. 9–16. [SDY∗18] Su W., Du D., Yang X., Zhou S., Fu
H.: Interactive sketch-based normal map generation with deep neural networks. Proceedings of the ACM on Computer Graphics and Interactive Techniques. Vol. 1, Num. 1 (2018).
Bastien Wailly and Adrien Bousseau / Line rendering of 3D meshes for data-driven sketch-based modeling
[WB19] Wailly B., Bousseau A.: Sketch-Based Modeling of Parametric Shapes. In ACM/EG Ex-pressive Symposium - Posters, Demos, and Art-works (2019), Berio D., Cruz P., Echevarria J., (Eds.), The Eurographics Association.
c