HAL Id: hal-01532163
https://hal-univ-rennes1.archives-ouvertes.fr/hal-01532163
Submitted on 2 Jun 2017
HAL is a multi-disciplinary open access
archive for the deposit and dissemination of
sci-entific research documents, whether they are
pub-lished or not. The documents may come from
teaching and research institutions in France or
abroad, or from public or private research centers.
L’archive ouverte pluridisciplinaire HAL, est
destinée au dépôt et à la diffusion de documents
scientifiques de niveau recherche, publiés ou non,
émanant des établissements d’enseignement et de
recherche français ou étrangers, des laboratoires
publics ou privés.
S. Speed, M. Feng, G. Fernandez Garcia, Fabrice Pointillart, Bertrand
Lefeuvre, F. Riobé, Stéphane Golhen, Boris Le Guennic, F. Totti, Y. Guyot,
et al.
To cite this version:
S. Speed, M. Feng, G. Fernandez Garcia, Fabrice Pointillart, Bertrand Lefeuvre, et al.. Lanthanide
complexes involving multichelating TTF-based ligands. Inorganic Chemistry Frontiers, Royal Society
of Chemistry, 2017, 4 (4), pp.604–617. �10.1039/c6qi00546b�. �hal-01532163�
ARTICLE
Lanthanide complexes Involving Multichelating TTF-based Ligands
S. Speed,a M. Feng,a G. Fernandez Garcia,a,c F. Pointillart,*a B. Lefeuvre,a F. Riobé,b S. Golhen,a B. Le
Guennic,*a F. Totti,c Y. Guyot,d O. Cador,a O. Maury,b and L. Ouahaba
The reaction between the 2-{TTF-fused-1H-benzimidazol-2-yl}pyridine alkylated either with the di-(pyrazol-1-yl)-4-pyridyl (L1) or dimethyl-2,2’-bipyridine (L2) moiety and 1 equiv. of Ln(hfac)32H2O (LnIII = DyIII and YbIII) leads to three dinuclear
complexes of formula [Yb2(hfac)6(L1)]2(CH2Cl2)·C6H14 (1) and [Ln2(hfac)6(L2)]CH2Cl2 (LnIII = YbIII (2) and DyIII (3)). The X-ray
structures highlight square antiprism (D4d symmetry) and spherical tricapped trigonal prism (D3h) for the eight- and
nine-coordinated lanthanide ions, respectively. Irradiation of the lowest-energy HOMO LUMO ILCT absorption band induced a 2F5/2 2F7/2 Yb-centered emission for 1 and 2. Both YbIII ions displayed similar emissions in 2 while two distinct emissions
were observed and attributed to the two YbIII ions in 1 depending on their coordination surroundings. Slow magnetic
relaxation is detected by dynamic magnetic measurements for 3 with a measured relaxation time 0 = 3.7(1.3) x 10-7 s and
an energy barrier = 39.6(2) cm-1. Taking into account the environment of both DyIII ions in 3, it was expected that both
metallic centers displayed similar dynamic magnetic behavior. The latter was rationalized by ab initio CASSCF/SI-SO calculations.
Introduction
Lanthanide ions are of great importance in molecular magnetism due to their magnetic and luminescence properties. Indeed, most of them possess a strong anisotropy and a large magnetic moment which make them good candidates for obtaining single-molecule magnets (SMMs).1 Moreover, these systems may have the ability to behave as quantum objects and act as storage units leading to potential applications such as high-density data storage devices, quantum computing or spintronics.2 Lanthanide complexes are already known to behave as SMMs with a large variety of organic ligands.3-5 In such systems the ligand plays the key role of controlling the adequate charge distribution around the lanthanide ion and so the desired axial magnetic anisotropy (Ising anisotropy) is achieved.6 As mentioned above, lanthanides are also widely studied because of their luminescence properties.
This luminescence covers a wide spectroscopic range that goes from the visible to the near-infrared region with characteristic emission bands. These specific properties are used in OLEDs,7 time-resolved fluoro-immunoassays8, biosensors9 and time-resolved imaging.10 However, due to the Laporte-forbidden f-f transitions,11 the emitting excited states are characterized by both long lifetimes and very weak absorption coefficients which lead to ineffective direct excitation processes in dilute solution. To overcome this disadvantage, indirect sensitization processes, via an organic chromophore, have been developed: i) triplet excited-state sensitization, ii) induced triplet metal-ligand charge transfer (MLCT) and iii) singlet excited-state with intra-ligand charge transfer (ILCT).12 We concentrate our attention on the ILCT process because the ligands we use preferentially, i.e. tetrathiafulvalene (TTF) functionalized derivatives, are of push-pull type.13 Considerable efforts are devoted to better understand and then predict the magnetic behaviour of lanthanide-based complexes. To that end, magnetic and luminescent coordination complexes involving lanthanides give the possibility to establish efficient correlation between these physical properties.14 In the past, it was demonstrated that TTF ligands are able to sensitize lanthanides’ luminescence,12,15 generate SMMs16 and that they can combine both properties to give redox-active luminescent SMMs.17 A possible approach to enhance such effects is to design novel compounds in which more than one metal centre display slow magnetic relaxation (multi-SMM behaviour). In order to achieve this, however, it is necessary to develop new synthetic strategies to incorporate in a bridging ligand different coordination sites. Moreover it is possible to exploit different previous synthetized SMMs as “building blocks”, to ensure the magnetic behaviour of each
a.Institut des Sciences Chimiques de Rennes UMR 6226 CNRS-UR1, Université de
Rennes 1, 35042 Rennes Cedex, France.
E-mail: [email protected], [email protected]
b.Laboratoire de Chimie de l’ENS-LYON-UMR 5182, 46 Allée d’Italie, 69364 Lyon
Cedex 07.
c.Dipartimento di Chimica, Università di Firenze, Via della Lastruccia 3 Polo
Scientifico, 50019 Sesto Fiorentino, Italy.
d.Université Claude Bernard Lyon 1, Institut Lumière Matière, UMR 5306
CNRS-Université Lyon 1, 10 rue Ada Byron, 69622 Villeurbanne Cedex, France.
Electronic Supplementary Information (ESI) available: Crystallographic information in CIF format, Ortep view of L1-L2 and 1-3 (Figs. S3, S5 and S7), packing views of L1 -L2 (Figs. S1, S2, S4, S6 and S8), cyclic voltammetry for ligands and compounds (Fig.
S9), additional data for absorption properties (Figs. S10-S15), first magnetization for 1-3 (Fig. S16). Frequency dependence of the ac susceptibility at 2 K of 3 (Fig. S17). Energy splitting of the 6H
15/2 multiplet for 3 (Fig. S18). Table of selected bond lengths
(Table S1, Shape analysis (Table S2), absorption data (Table S3) and best fitted parameters with the extended Debye model (Table S4). Computed g tensors and energy splitting for compound 3 (Table S5). See DOI: 10.1039/x0xx00000x
centre. Following this strategy, we recently used the ligand 2-
{1-[2,6-di(pyrazol-1-yl)-4-methylpyridyl]-4,5-[4,5-
bis(propylthio)-tetrathiafulvalenyl]-1H-benzimidazol-2-yl}pyridine (L1)17 (Scheme 1) which presents one bis-chelating (bzip = benzimidazol-2-ylpyridyl) and one tris-chelating [dpp = di-(pyrazol-1-yl)-4-pyridyl] coordination site.
Scheme 1. Molecular structure of ligands L1 and L2.
Herein, we present the crystal structure of the above-mentioned ligand L1. Subsequently, to induce changes in the
magnetic properties, we replace the tris-chelating moiety of L1
with a 4,4'-dimethyl-2,2'-bipyridine moiety (Mebpy) to give the 2-{1-[4,4’-dimethyl-2,2’-bipyridyl]-4,5-[4,5-bis(propylthio)-tetrathiafulvalenyl]-1H-benzimidazol-2-yl}pyridine ligand (L2)
(Scheme 1). The two dpp and Mebpy are grafted on the common 4,5-bis(propylthio)-tetrathiafulvalenyl]-1H-benzimidazol-2-yl}pyridine molecular skeleton which has been previously published by J. Wu and coll.18 Ligands L2 and L1 as
well as the resulting coordination complexes [Yb2(hfac)6(L1)]·CH2Cl2 (1) and [Ln2(hfac)6(L2)]·C6H14 (LnIII = Yb (2) and Dy (3)) (hfac- =1,1,1,5,5,5-hexafluoroacetylacetonate) were characterized by X-ray diffraction, absorption spectroscopy and cyclic voltammetry. The static and dynamic magnetic properties of the complexes were also investigated. Finally, the interpretation of both absorption and magnetic properties are supported by TD-DFT and CASSCF/SI-SO calculations.
Experimental section
General Procedures and Materials.
The precursors Ln(hfac)32H2O (LnIII = Dy and Yb; hfac- = 1,1,1,5,5,5-hexafluoroacetylacetonate anion) and the ligand 2-
{1-[2,6-di(pyrazol-1-yl)-4-methylpyridyl]-4,5-[4,5-
bis(propylthio)-tetrathiafulvalenyl]-1H-benzimidazol-2-yl}pyridine (L1) were synthesized following previously reported
methods.19,20 All other reagents were purchased from Aldrich Co., Ltd. and used without further purification.
Crystallization of the ligand 2-{1-[2,6-di(pyrazol-1-yl)-4-
methylpyridyl]-4,5-[4,5-bis(propylthio)-tetrathiafulvalenyl]-1H-benzimidazol-2-yl}pyridine (L1). Yellow single crystals of L1
suitable for X-ray study were obtained by slow diffusion of n-hexane in a concentrated CH2Cl2 solution of L1.
Synthesis of the ligand 2-{1-[4,4’-dimethyl-2,2’-bipyridyl]-4,5- [4,5-bis(propylthio)-tetrathiafulvalenyl]-1H-benzimidazol-2-yl}pyridine (L2). 60 mg of
2-(4,5-(4,5-bis(propylthio)-tetrathiafulvalenyl)-1H-benzimidazol-2-yl)-pyridine16 (0.11 mmol) and 25 mg of K2CO3 (0.18 mmol, 1.5 equiv) were added to 5 mL of DMF, and then the mixture was stirred for 30 min under argon. A solution of 2 mL of DMF containing 37 mg of 4-(Bromomethyl)-4'-methyl-2,2'-bipyridine21 (0.14 mmol, 1.25 equiv) was added, and the resulting mixture was heated at 70 °C. After the mixture had been heated for 2 h, additional K2CO3 (25 mg, 0.18 mmol, 1.5 equiv) and 4-(Bromomethyl)-4'-methyl-2,2'-bipyridine (15 mg, 0.06 mmol, 0.6 equiv) were added. The mixture was stirred and heated overnight. The orange precipitate was filtered, washed with water (3 × 50 mL), and finally dried in air. Yield: 45 mg (59 %). Anal. Calcd (%) for C34H31N5S6: C 58.17, H 4.45, N 9.98; found: C 58.05, H 4.41, N 9.99. 1H-NMR (CDCl3): 8.53 (d, 2.3 Hz, 4H), 7.82 (s, 4H), 7.74 (s, 4H), 6.46 (s, 4H), 4.01 (s, 4H) and 2.38 (s, 6H). Yellow single crystals of L2 suitable for X-ray study were obtained by slow diffusion of n-hexane in a concentrated solution of L2 in CH2Cl2. Synthesis of complexes 1-3.
[Yb2(hfac)6(L1)]2(CH2Cl2)·C6H14 (1). 33.2 mg of Yb(hfac)32H2O
(0.04 mmol) were dissolved in 10 mL of CH2Cl2 and then added to a solution of 10 mL of CH2Cl2 containing 14.8 mg of L1 (0.02
mmol). After 1 h of stirring, 40 mL of n-hexane were layered at room temperature in the dark. Slow diffusion leads to red single crystals which are suitable for X-ray studies. Yield 39 mg (75 %). Anal. Calcd (%) for C72H54Cl4Yb2F36N8O12S6: C 33.39, H 2.09, N 4.33; found: C 33.51, H 2.26 N, 4.39. I.R. (KBr): 2955, 2928, 2871, 2853, 1653, 1574, 1558, 1532, 1506, 1465, 1412, 1255, 1207, 1146, 1100, 1058, 975, 799, 661 and 587 cm-1.
[Yb2(hfac)6(L2)]CH2Cl2 (2). 21 mg of Yb(hfac)32H2O (0.025
mmol) were dissolved in 5 mL of CH2Cl2 and then added to a solution of 5 mL of CH2Cl2 containing 10 mg of L2 (0.014 mmol).
After 1 h of stirring, 20 mL of n-hexane were layered at room temperature in the dark. Slow diffusion leads to red single crystals which are suitable for X-ray studies. Yield 20 mg (70 %). Anal. Calcd (%) for C65H39Cl2F36Yb2N5O12S6: C 32.87, H 1.65, N 2.95; found: C 32.99, H 1.76 N, 2.94. I.R. (KBr): 2955, 2870, 2852, 1653, 1528, 1497, 1465, 1410, 1256, 1209, 1135, 1100, 1058, 976, 798, 660 and 587 cm-1.
[Dy2(hfac)6(L2)]CH2Cl2 (3). 21 mg of Dy(hfac)32H2O (0.025
mmol) were dissolved in 5 mL of CH2Cl2 and then added to a solution of 5 mL of CH2Cl2 containing 8 mg of L2 (0.011 mmol).
After 1 h of stirring, 20 mL of n-hexane were layered at room temperature in the dark. Slow diffusion leads to red single crystals which are suitable for X-ray studies. Yield 18 mg (70 %). Anal. Calcd (%) for C65H39Cl2F36Dy2N5O12S6: C 33.16, H 1.67, N 2.97; found: C 33.09, H 1.72 N, 2.94. I.R. (KBr): 2956, 2872, 2852, 1654, 1528, 1497, 1464, 1409, 1255, 1209, 1135, 1100, 1057, 978, 799, 660 and 587 cm-1.
Crystallography. Single crystals of L1 and L2; 1-3 were mounted
on a APEXII Bruker-AXS diffractometer for data collection (MoK radiation source, = 0.71073 Å), from the Centre de
Diffractométrie (CDIFX), Université de Rennes 1, France. Structures were solved with a direct method using the SIR-97 program and refined with a full matrix least-squares method on F2 using the SHELXL-97 program22. Crystallographic data are summarized in Table 1. Complete crystal structure results as a CIF file including bond lengths, angles, and atomic coordinates are deposited as Supporting Information (CCDC numbers: 1515791-1515795 for L1, L2, 2, 3 and 1 respectively).
Physical Measurements. The elemental analyses of the compounds were performed at the Centre Régional de Mesures Physiques de l’Ouest, Rennes. 1H NMR was recorded on a Bruker Ascend 400 spectrometer. Chemical shifts are reported in parts per million referenced to TMS for 1H NMR. Cyclic voltammetry was carried out in CH2Cl2 solution, containing 0.1 M N(C4H9)4PF6 as supporting electrolyte. Voltammograms were recorded at 100 mVs-1 at a platinum disk electrode. The potentials were measured versus a saturated calomel electrode (SCE). Absorption spectra were recorded on a Varian Cary 5000 UV-Visible-NIR spectrometer equipped with an integration sphere. The luminescence spectra were measured using a Horiba-Jobin Yvon Fluorolog-3® spectrofluorimeter, equipped with a three slit double grating excitation and emission monochromator with dispersions of 2.1 nm/mm (1200 grooves/mm). The steady-state luminescence was excited by unpolarized light from a 450 W xenon CW lamp and detected at a 90° angle for diluted solution measurements and for solid state measurement by a red-sensitive Hamamatsu R928 photomultiplier tube. Spectra were reference corrected for both the excitation source light intensity variation (lamp and grating) and the emission spectral response (detector and grating). Near infra-red spectra were recorded at a 90° angle using a liquid nitrogen cooled, solid indium/gallium/arsenic detector (850-1600 nm). The luminescence decay of ytterbium complexes was determined using a home–made set–up. The excitation of the YbIII luminescence decays was performed with an optical parametric oscillator from EKSPLA NT342, pumped with a pulsed frequency tripled YAG:Nd laser. The pulse duration was 6 ns at 10 Hz repetition rate. The detection was performed by a R1767 Hamamatsu photomultiplier through a Jobin–Yvon monochromator equipped with a 1 μm blazed grating. The signal was visualized and averaged with a Lecroy digital oscilloscope LT342. The dc magnetic susceptibility measurements were performed on solid polycrystalline samples with a Quantum Design MPMS-XL SQUID magnetometer between 2 and 300 K in applied magnetic field of 0.2 T for temperatures of 2-20 K and 1T for temperatures of 20-300 K. These measurements were all corrected for the diamagnetic contribution as calculated with Pascal’s constants. Computational Details. DFT geometry optimizations and TD-DFT excitation energy calculations of the ligands L1 and L2 and
the YIII analogues of the corresponding complexes were carried out with the Gaussian 09 (revision A.02) package23 employing the PBE0 hybrid functional.24 The “Stuttgart/Dresden” basis sets and effective core potentials were used to describe the yttrium atom,25 whereas all other atoms were described with the SVP basis sets.26 The first 80 monoelectronic excitations
were calculated. In all steps, a modelling of bulk solvent effects (solvent = dichloromethane) was included through the Polarisable Continuum Model (PCM),27 using a linear-response non-equilibrium approach for the TD-DFT step.28 Molecular orbitals were sketched using the Gabedit graphical interface.29 Wavefunction-based calculations were carried out for complex 3 by using the SA-CASSCF/RASSI-SO approach, as implemented in the MOLCAS quantum chemistry package (versions 8.0).30 To simplify the calculations and concentrate on the local magnetic properties, 3 has been treated as two independent DyIII-based fragments. The first one was composed by the Dy1 ion and the 4,5-bis(propylthio)-tetrathiafulvalenyl]-1H-benzimidazol-2-yl}pyridine moiety while the second fragment was constituted of the Dy2 ion and the dimethyl-2,2’-bipyridine moiety. Relativistic effects are treated in two steps on the basis of the Douglas–Kroll Hamiltonian: i) the scalar terms were included in the basis-set generation and were used to determine the spin-free wavefunctions and energies in the complete active space self-consistent field (CASSCF) method,31 and the spin-orbit coupling was added within the restricted-active-space-state-interaction (RASSI-SO) method, which uses the spin-free wavefunctions as basis states.32 The resulting wavefunctions and energies are used to compute the magnetic properties and g-tensors of the lowest states from the energy spectrum by using the pseudo-spin S = 1/2 formalism in the SINGLE-ANISO routine.33 Cholesky decomposition of the bielectronic integrals was employed to save disk space and speed-up the calculations.34 The atomic positions were extracted from the X-ray crystal structures. Only the positions of the H atoms were optimized using the DFT protocol described previously. The active space of the self-consistent field (CASSCF) method consisted of the nine 4f electrons of the DyIII ion spanning the seven 4f orbitals, i.e. CAS(9,7)SCF. State-averaged CASSCF calculations were performed for all of the sextets (21 roots), all of the quadruplets (224 roots), and 300 out of the 490 doublets of the DyIII ion. 21 sextets, 128 quadruplets, and 107 doublets were mixed through spin−orbit coupling in RASSI-SO. All atoms were described by ANO-RCC basis sets.35 The following contractions were used: [8s7p4d3f2g1h] for Dy, [4s3p2d] for the O directly coordinated to Dy, [3s2p] for other O atoms; [3s2p1d] for the N atoms; [4s3p] for the S atoms, [3s2p] for the C and F atoms and [2s] for the H atoms.
Results and discussion
Crystal structure analysis
L1. This ligand crystallizes in the P-1 (N°2) triclinic space
group (Table 1). The asymmetric unit is composed by only one molecule of L1 (Fig. 1). The neutrality of L1 is confirmed by the
central C9-C10 bond length of 1.318(10) Å. The TTF core adopts a planar conformation with the orientation of the dpp moiety almost perpendicular to it with an angle of 86.42º. The crystal packing reveals a regular one-dimensional stacking along the a axis (Fig. S1), with close S1S5 = 3.743 Å and S2S6 = 3.769 Å contacts.
Table 1. X-ray crystallographic data for the ligands L1 and L2, and complexes 1-3.
Fig. 1 ORTEP view of L1. Thermal ellipsoids are drawn at 30% probability. Hydrogen
atoms are omitted for clarity. Fig. 2 ORTEP view of L2. Thermal ellipsoids are drawn at 30% probability. Hydrogen atoms are omitted for clarity.
Compounds L1 L2 [Yb
2(hfac)6(L1)]·2CH2Cl2·C6H14 (1)
Formula C34H30N8S6 C34H31N5S6 C72H54Cl4Yb2F36N8O12S6
M / g.mol-1 743.0 702.0 2587.5
Crystal system Triclinic Triclinic Monoclinic
Space group P-1 (N°2) P-1 (N°2) P21/n (N°14) Cell parameters a = 8.184(9) Å b = 13.719(15) Å c = 16.857(16) Å = 112.03(5) ° β = 90.19(4) ° = 106.24(5) ° a = 8.1794(14) Å b = 14.562(2) Å c = 14.923(3) Å = 111.939(8) ° β = 95.390(6) ° = 96.410(7) ° a = 22.2682(13) Å b = 12.7174(8) Å c = 33.6141(16) Å β = 100.365(2) ° Volume / Å3 1672(3) 1620.6(5) 9364.0(9)
Cell formula units 2 2 4
T / K 150 (2) 150 (2) 150 (2) Diffraction reflection 2.63 ≤ 2θ ≤ 56.07 2.97 ≤ 2θ ≤ 55.44 2.04 ≤ 2θ ≤ 55.12 calc, g.cm-3 1.476 1.439 1.835 µ, mm-1 0.450 0.457 2.365 Number of reflections 7452 13955 82503 Independent reflections 7452 7348 21285 Fo2 > 2(Fo)2 3257 3151 16892 Number of variables 434 408 1205 Rint, R1, wR2 0.1738, 0.0776, 0.1412 0.0956, 0.0807, 0.1632 0.0703, 0.1173, 0.2927
Compounds [Yb2(hfac)6(L2)]·CH2Cl2 (2) [Dy2(hfac)6(L2)]·CH2Cl2 (3)
Formula C65H39Cl2Yb2F36N5O12S6 C65H39Cl2Dy2F36N5O12S6
M / g.mol-1 2375.4 2354.3
Crystal system Triclinic Triclinic
Space group P-1 (N°2) P-1 (N°2) Cell parameters a = 12.5259(6) Å b = 16.3942(9) Å c = 22.1956(12) Å = 87.532(2) ° β = 88.446(2) ° = 74.477(2) ° a = 12.5468(7) Å b = 16.3551(9) Å c = 22.1813(11) Å = 87.829(2) ° β = 88.851(2) ° = 74.949(2) ° Volume / Å3 4387.0(4) 4392.1(4)
Cell formula units 2 2
T / K 150 (2) 150(2) Diffraction reflection 1.84 ≤ 2θ ≤ 55.08 1.84 ≤ 2θ ≤ 55.09 calc, g.cm-3 1.798 1.780 µ, mm-1 2.456 2.025 Number of reflections 54840 68575 Independent reflections 19960 19845 Fo2 > 2(Fo)2 14598 16106 Number of variables 1155 1187 Rint, R1, wR2 0.0546, 0.0577, 0.1541 0.0357, 0.0496, 0.1335
L2. This ligand also crystallizes in the P-1 (N°2) triclinic space
group (Table 1). The asymmetric unit is composed by only one molecule of L2 (Fig. 2). As for L1, the neutrality of L2 is confirmed
by the central C9-C10 bond length of 1.338(8) Å. The TTF core adopts a planar conformation with the orientation of the Mebpy moiety almost perpendicular to it with an angle of 88.17º. The crystal packing reveals a regular one-dimensional stacking along the a axis (Fig. S2), with S2S6 = 3.693 Å contacts.
[Yb2(hfac)6(L1)]·2CH2Cl2·C6H14 (1). Compound 1 crystallizes in
the P21/n (N°14) monoclinic space group (Table 1). The asymmetric unit is composed of two Yb(hfac)3 moieties, one L1
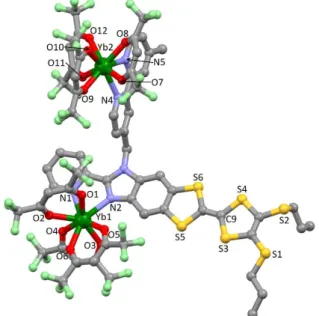
ligand, a n-hexane and two dichloromethane molecules of crystallization. An ORTEP view is depicted in the Fig. S3. The Yb1 ion is surrounded by six oxygen atoms that belong to three hfac -ligands and two nitrogen atoms from the bis-chelating coordination site (bzip moiety) of L1 (Fig. 3). The Yb2 ion is
surrounded by six oxygen atoms that belong to three hfac -ligands and three nitrogen atoms from the tris-chelating coordination site (dpp moiety) of L1.
Fig. 3 Molecular structure of 1. Hydrogen atoms and both dichloromethane and
n-hexane molecules of crystallization are omitted for clarity.
The average Yb-O distances are shorter (2.314(10) Å) than the average Yb-N distances (2.491(12) Å) (Table S1) due to the oxophilic character of the lanthanide, as usually observed. The arrangement of the ligands leads to a distorted square anti-prism (D4d symmetry) and spherical tricapped trigonal anti-prism (D3h symmetry) as coordination polyhedra for Yb1 and Yb2 ions, respectively. The distortion is visualized by continuous shape measures performed with SHAPE 2.1 (Table S2).36
The central C=C bond of the TTF core is equal to 1.373(18) Å which confirms the neutral form of L1. The shortest SS
contacts (S4S6 = 3.758 Å, S4S5 = 3.898 Å and S3S6 = 3.903 Å) lead to the formation of isolated dimers head-to-tail donors (Fig. S4), separated by Yb(hfac)3 moieties. The shortest intra- and intermolecular Yb-Yb distances are 10.759 Å and 10.772 Å (Yb1-Yb2), respectively.
[Ln2(hfac)6(L2)]·CH2Cl2 (Ln = Yb (2), Dy (3)). Compounds 2 and 3
are isostructural and so only one description will be provided
for both compounds. The values for 3 will be given in brackets. Both complexes crystallize in the P-1 (N°2) triclinic space group (Table 1).
Fig. 4 Molecular structure of 2. Hydrogen atoms and dichloromethane molecule of
crystallization are omitted for clarity.
The asymmetric unit is composed of two Ln(hfac)3 moieties, one L2 ligand and a dichloromethane molecule of crystallization
(Figs. 4, S5 and S7). The X-ray structure reveals that the two coordination sites of L2 are coordinated to a Ln(hfac)3 moiety.
The LnIII ions are surrounded by six oxygen atoms that belong to three hfac- ligands and two nitrogen atoms that belong to the bis-chelating coordination sites (the Mebpy or the bzip moieties). Selected bond lengths are reported in Table S1. The average Ln-O distances 2.296(5) Å [(2.337(4) Å)] are shorter than the average Ln-N distances 2.468(5) Å [(2.517(5) Å)] due to the usually observed oxophilic character of the lanthanide. The arrangement of the ligands leads to a distorted square anti-prism (D4d symmetry) as coordination polyhedra for both Ln ions of the molecule (Table S2). The central C=C bond of the TTF core is equal to 1.342(9) Å [1.348(7) Å] which confirms the neutral form of L2. The crystal packing reveals the formation of
dimers stacked head-to-tail with short S4S6 = 3.651 Å [(S3S5 = 3.656 Å)] contacts arranged as a one-dimensional network and isolated one another by Ln(hfac)3 moieties (Figs. S6 and S8). The shortest intra- and intermolecular Ln-Ln distances are 10.426 Å [10.479 Å] and 10.030 Å [8.410 Å] (Yb1-Yb2 / Dy2-Dy2), respectively.
Electrochemical Properties. The redox properties of the ligands L1 and L2 as well as the related complexes 1-3 are investigated
by cyclic voltammetry (Fig. S9), the values of the oxidation potentials are listed in Table 2. The cyclic voltammograms for the free ligands, L1 and L2, show two mono-electronic oxidations
at about 0.50 V for the first oxidation and about 0.90 V for the second oxidation, corresponding to the formation of a radical cation and a dication TTF fragment, respectively (Fig. S9).
Table 2. Oxidation potentials (V vs SCE, nBu4NPF6, 0.1 M in CH2Cl2 at 100 mV·s-1) of the
ligands L1 and L2 and the complexes 1-3.
E1 1/2 E21/2 L1 L2 1 2 3 0.51 0.51 0.48 0.52 0.51 0.93 0.92 0.94 0.96 0.97
The electrochemistry of complexes 1-3 remains similar to that of the free ligands, the coordination of the electron attracting Ln(hfac)3 fragments does not significantly affect the oxidation potentials (Table 2). The electrochemical properties attest that the reversibility of the oxidation potentials and the redox-activity of both ligands (L1 and L2) are conserved after
complexation.
Photo-physical Properties. The UV-visible absorption
properties of L1, L2 and complexes 1 and 2 have been studied
both in solution (CH2Cl2, Figs. 5 and S10) and solid-state (KBr pellets, Figs. S11-S15). To rationalize the attributions of the experimental absorption bands, TD-DFT calculations were performed on the DFT-optimized geometries (see computational details) of the ligands L1 and L2 and the YIII analogues of complexes 1 and 2, following a computational strategy already used successfully on other TTF-based systems.16g,17b,37
Fig. 5 a) Experimental UV/vis absorption spectrum in solution (c = 4·10-5 M) of L1 in CH
2Cl2
(open grey circles), respective Gaussian decompositions (dashed lines) and best fit (full black line). b) Theoretical absorption spectrum (black line), the bars represent the mean contribution of the absorption spectra that are listed in Table 3. c) Experimental UV/vis absorption spectrum in solution (c = 4·10-5 M) of 1 in CH
2Cl2 (open grey circles), respective
Gaussian decompositions (dashed lines) and best fit (full black line). d) Theoretical absorption spectrum (black line), the bars represent the mean contribution of the absorption spectra that are listed in Table 3.
The molecular orbital diagrams and calculated UV-visible absorption spectra were also determined (Figs. 5-6, S10, S13 and Tables 3 and S3). The experimental absorption curve of L1
has been decomposed into eight bands (Fig. 5a and Table 3).
The calculated UV-visible absorption spectrum for L1
reproduces well the experimental curve (Figs. 5a and 5b). The lowest energy band is calculated at 24310 cm-1 (experimental value 25200 cm-1) and attributed to a -* HOMO LUMO transition, identified as a TTF to benzoimidazolpyridine (bzip) charge transfer (ILCT) (Fig. 6, Table 3). This result is in agreement with the energy of the ILCT observed for the 4,5-
bis(propylthio)-tetrathiafulvalenyl]-1H-benzimidazol-2-yl}pyridine molecular skeleton (25189 cm-1) showing that the alkylation has no significant influence on the energy of the ILCT.18 The next three bands were calculated at 29132, 33294 and 34857 cm-1 (experimental values centred at 30100, 32600 and 36300 cm-1) are assigned to intra-TTF transition (ID) (first transition) and ILCT (the next two). The highest energy part of the spectrum is assigned to intra-dpp (IA) transitions.
Fig. 6 MO diagram of L1 (left) and complex 1 (right). Energy levels of the centered TTF
donor, dpp acceptor and hfac- are represented in orange, blue and green, respectively.
The experimental absorption curve of 1 was decomposed also into eight bands (Fig. 5c and Table 3). The calculated UV-visible absorption spectrum for 1 reproduces well the experimental curves (Figs. 5c and 5d). The lowest energy band was calculated at 19113 cm-1 (experimental value at 21000 cm-1) and attributed to a -* HOMO LUMO transition (Fig. 6), identified as a TTF to benzoimidazolpyridine (bzip) charge transfer (ILCT). This band is significantly lower (by ~4200 cm-1) than the experimental energy for the free ligand L1 (25200 cm-1) due to the electron-withdrawing character of the Yb(hfac)3 moiety, which decreases the electron density of the orbitals centered on both the acceptor and the donor parts of the ligand. Also upon the coordination of the Yb(hfac)3 moiety there is the appearance of a new band centered at 38092 cm-1 (experimental value at 33100 cm-1) that is attributed to intra-hfac- excitations. The experimental absorption curve of L2 has
been decomposed into eight bands (Fig. S10a and Table S3). The calculated UV-visible absorption spectrum for L2 reproduces
well the experimental curve (Figs. S10a and S10b). The lowest energy band is calculated at 23321 cm-1 (experimental value at 24500 cm-1) and attributed to a -* HOMO LUMO transition, identified as a TTF to benzoimidazolpyridine (bzip) charge transfer (ILCT) (Fig. S13, Table S3).
ARTICLE
Table 3. TD-DFT calculated excitation energies and main compositions of the low-lying electronic transitions for L1 and 1. In addition, the charge transfer and the pure
intramolecular transitions are reported. ID, IA, H and L represent the intramolecular TTF (Donor) or intramolecular dpp (Acceptor) transitions, and the HOMO and LUMO, respectively. Therefore, ILCT stands for Intra-Ligand Charge Transfer. The theoretical values are evaluated at the PCM(CH2Cl2)-PBE0/SVP level of approximation.
Eexp
(cm-1)
Etheo
(cm-1) Osc. Type Assignment Transition
L1 25200 24310 0.28 ILCT TTF*bzip HL (82%) 30100 29132 0.05 ID TTF*TTF HL+5 (94%) 32600 33046 33542 0.70 0.27 ILCT ID TTF*bzip TTF*TTF HL+6 (36%) HL+7 (31%) 36300 34732 35670 0.10 0.12 ILCT ID TTF*bzip TTF*TTF H-2L (74%) H-1L+4 (26%) HL+7/10 (23/21%) 38500 36594 37070 0.11 0.12 IA bzip*dpp H-2L+1 (80%) H-3L+1/2 (14/17%) 40200 39191 0.32 IA bzip*dpp H-3L+1/2 (34/45%) 41000 42237 42537 0.15 0.22 IA ILCT bzip*dpp TTF*bzip H-13L (16%) H-7L+1 (44%) H-6L (22%) H-2L+5 (10%) H-1L+6 (26%) 43500 43380 0.22 IA dpp*dpp H-7L+2 (16%) H-6L/+2 (17/25%) 1 21100 19114 0.27 ILCT TTF*bzip HL (99%) 25400 28624 0.36 ILCT TTF*bzip H-1L (94%) 27900 30080 0.09 ILCT TTF*bzip H-3/2L (36/58%) 30800 33399 0.43 ID TTF*TTF HL+14 (46%) 33100 37787 38316 38398 0.12 0.39 0.15 Ihfac IA hfac*hfac dpp*dpp H-11L+1/2 (29/54%) H-10L+7 (39%) 35700 34966 0.09 IA dpp*dpp H-10L+3 (23%) 39200 36182 0.23 ID TTF*TTF H-1L+10 (30%) 44100 / / / / /
The next two bands were calculated at 28703 and 32112 cm-1 (experimental values centred at 27500 and 30400 cm-1) and are attributed to an intra-TTF transition (ID) and another ILCT. The rest of the spectrum is a mix of intra-Mebpy (IA) and intra-TTF (ID) transitions. The experimental absorption curve of 2 was decomposed into nine bands (Fig. S10c and Table S3). The calculated UV-visible absorption spectrum for 2 reproduces well the experimental curves (Figs. S10c and S10d). The lowest energy band was calculated at 19304 cm-1 (experimental value at 21600 cm-1) and attributed to a -* HOMO LUMO transition, identified as a TTF to benzoimidazolpyridine (bzip) charge transfer (ILCT) (Fig. S13). This band is significantly lower (by ~2900 cm-1) than the experimental energy for the free ligand L2 (24500 cm-1) due to the electron-withdrawing character of the Yb(hfac)3 moiety, which decreases the electron density of the orbitals centered on both the acceptor and the donor parts of the ligand. Also upon the coordination of the Yb(hfac)3
moiety there is the appearance of a new band centered at 38196 cm-1 (experimental value at 33700 cm-1). This band is attributed to intra-hfac- excitations.
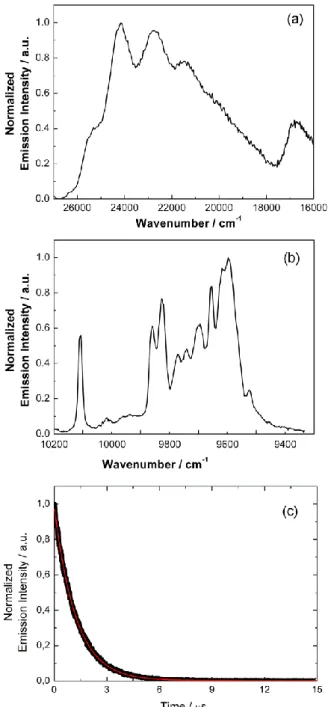
Metal-centered luminescence. The emission properties of complexes 1 and 2 were studied at room temperature and at 77 K in solid state (Figs. 7 and 8). Excitation of the samples at 20000 cm-1 induces the luminescence of the YbIII ions, assigned to the 2F5/2 2F7/2 transition. Ten emission maxima and shoulders are clearly identified at the following energies in the spectrum of 2: 10206 cm-1, 9961 cm-1, 9927 cm-1, 9871 cm-1, 9840 cm-1, 9797 cm-1, 9756 cm-1, 9709 cm-1, 9696 cm-1 and 9624 cm-1 (Figure 8). This number of contributions is higher than the degeneracy of the 2F7/2 ground state (Kramer’s doublets), which has a maximum of four contributions. These additional emission contributions cannot only be explained by the presence of two distinct YbIII ions in the complex. Indeed although tiny structural
differences are present, both YbIII emitters present very similar polyhedron symmetry (D4d) and therefore the same crystal field splitting in the luminescence spectra is expected. The presence of additional signals, that are frequently observed, could thus be attributed to additional transitions coming from the second and/or third MJ states of the 2F5/2 multiplet by analogy with some of our previous studies37 and the one by Auzel et al.39 or to vibrational contributions.
Fig. 7 (a) Visible (ex = 28570 cm-1 (350 nm)) and (b) NIR (ex = 20000cm-1 (500 nm))
luminescence spectra of 2 in the solid state at 77 K, (c) Decay kinetics of 2F
5/2 recorded at
10000 cm–1 (1000 nm) in solid state at room temperature under 22222 cm–1 (450 nm) excitation for 2. The red line represents the monoexponential fit.
On the other hand, the dissymmetrical bimetallic complex 1 exhibits eleven emission maxima and shoulders at the following energies: 10206 cm-1, 10172 cm-1, 10115 cm-1, 10042 cm-1, 9966 cm-1, 9923 cm-1, 9871 cm-1, 9836 cm-1, 9754 cm-1, 9685 cm-1, and
9622 cm-1. Once again, the number of contributions is higher than eight, a value expected for two emitting YbIII ions in two different coordination environments, i.e. two different coordination polyhedra with different symmetries (Yb1-N2O6 in D4d and Yb2-N3O6 in D3h). Then the additional emissive bands could be also attributed to the participation of excited MJ states of the 2F5/2 multiplet state as well as vibrational contributions.
Fig. 8 Visible (ex = 28570 cm-1 (350 nm)) (a) and NIR (ex = 20000cm-1 (500 nm)), (b)
luminescence spectra of 1 (black line) in the solid state at 77K. For comparison are superimposed the spectra of [Yb2(hfac)6(L3)]38 (red line) and 2 (green line) recorded in
the same conditions, (c) Decay kinetics of 2F
5/2 recorded at 10000 cm–1 (1000 nm) in solid
state at room temperature under 22222 cm–1 (450 nm) excitation for 1. The red line represents the monoexponential fit.
To visualize the contributions of the different YbIII ions, we compared the first emission band of the spectra of 1 (black line in Fig. 8) with an analogous complex of formula [Yb2(hfac)6(L3)]C6H14 (where L3 =
bis(2,6-di(pyrazol-1-yl)-4-methylthiolpyridine)-4’,5’-ethylenedithiotetrathiafulvene) that has two YbIII ions in a N3O6 environment40 (red line in Fig. 8) and with complex 2 (green line in Fig. 8). The first emission band is at 10206 cm-1 at the same position than in complex 2 and has a shoulder at 10172 cm-1 due to the contribution of the YbIII ions in a N3O6 environment. Qualitatively, contributions of the two types of coordination environment can be found for 1 but the resolution of the spectra is not good enough to draw any definitive conclusions. It was recently demonstrated that the presence of a low-energy ILCT transition can suggest a sensitization occurring directly via the transfer of energy from the charge transfer state.12,15c,d,41 The presence of the phosphorescence signal at 77 K (Figs. 7a, 8a) suggests that the 3* state should be also involved in the sensitization mechanism.42 In the present case, it is complicated to discriminate between the possible sensitization processes and both energy transfers from singlet and triplet excited states may simultaneously occur. As already observed for similar TTF-based ligands, for example the 4,5-bis(propylthio)-tetrathiafulvalene- 2-(2-pyridyl)benzimidazole-methyl-2-pyridine ligand,42 and due to the presence of the YbIII ion an additional sensitization process involving a stepwise photo-induced electron transfer can be considered.
For both complexes, the luminescence decay was best fitted by a single exponential function of time synonymous with a 2F5/2 state lifetime of 12.2 s for complex 2 (Fig. 7c) and 11.9 s for complex 1 (Fig. 8c). The presence of two different emitting centres in 1 does not give two significantly different emission lifetimes. Such lifetimes are in the range of the standard {Yb(hfac)3(diimine)} luminophores43 as well as with our previously reported [Yb(hfac)3(L4)] complex (where L4 =
4,5-bis(propylthio)-tetrathiafulvalene- 2-(2-pyridyl)benzimidazole-methyl-2-pyridine).42
Magnetic properties
Static magnetic measurements were performed on the four compounds. The temperature dependences of MT for
powdered samples of 1-3 are represented in Fig. 9.
Fig. 9 . Thermal variation of χMT for compounds 1 (triangles), 2 (squares) and 3 (circles)
with simulated curve (red line) for 3.
The room temperature values are 4.72 cm3·K·mol-1, 4.53 cm3·K·mol-1, and 28.00 cm3·K·mol-1 for 1-3, respectively. On cooling, MT decreases monotonically down to 2.25 cm3·K·mol
-1, 2.31 cm3·K·mol-1, 24.18 cm3·K·mol-1 for 1-3, respectively. The experimental room temperature values of MT are in
agreement with the expected values of 5.14 cm3·K·mol-1 and 28.34 cm3·K·mol-1 for two magnetically isolated YbIII and DyIII, respectively.44 For compounds 1-3, classical behaviour in the field range 0-50 kOe is observed from the first magnetization curves measured at 2 K for magnetically isolated lanthanides (Fig. S16).
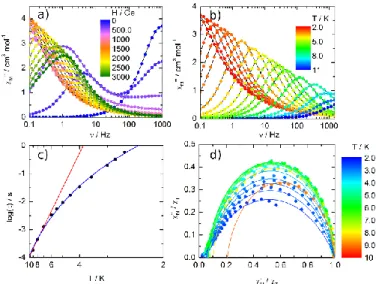
Dynamic Measurements. For the YbIII derivatives 1 and 2, no out-of-phase component of the magnetic susceptibility (χM’’) was observed while an immobilized powder of 3 shows frequency dependence in zero external dc field but with a maximum of the M’’ vs. curve ( the frequency of the ac oscillating field) that falls at the limit of the available frequencies (Fig. 10a). The DyIII ions lie in almost the same environment N2O6-D4d and should therefore behave similarly. This is indeed what is observed in the extended Debye45 analysis of the 2 K data in zero field with only one relaxing centre that shows that the relaxation process concerns more than 70% of the magnetic moment (Fig. S17). The application of a moderate external dc field induces the appearance of a second relaxation process at low frequency which grows at the expense of the fast relaxation process (Fig. 10a). Only at fields higher than 800 Oe one relaxation is visible. The optimum field, the field for which relaxation is slowest, is estimated at 800 Oe (Fig. 10a).
Fig. 10 (a) Scan field of the frequency dependence of M’’ of 3 at 2 K, (b) Frequency
dependence of χM” between 2 and 10 K, (c) temperature variation of the relaxation time
measured in an external field of 800 Oe with the best fitted curve (red line) in the temperature range of 2.5-10 K, and (d) normalized Cole-Cole plots at several temperatures between 2 and 10 K.
In such applied field, the out-of-phase component of χM was observed in the temperature range of 2-11 K (Fig. 10b). The frequency dependence of the ac susceptibility can be analysed in the framework of the extended Debye model both for field and temperature variations. Both DyIII ion sites are treated
identically and relax at the same rate: only one maximum is observed on the M’’ vs. curves at any temperature. The temperature dependence of the relaxation time at 800 Oe is extracted from the extended Debye model between 2.0 and 10.0 K (Table S4). The relaxation time follows the Arrhenius law = 0 exp(/kT) only above 6 K with 0 = 3.7(1.3)×10-7 s and = 39.6(2) cm-1 (Figure 11c) while the full curve is easily reproduced with a Raman only process = C×Tn with C = 4.8(6)×10-3 and n = 6.26(7). The value of n is close to 7 expected for Kramers ions46 which tends to prove that the relaxation does not occur through first excited state. The Cole-Cole46b plots normalized to their isothermal value are represented in Fig. 10d. Only the plots with maximum on M’’ vs. M’ are shown. Clearly, the curves do not collapse into a single master one.
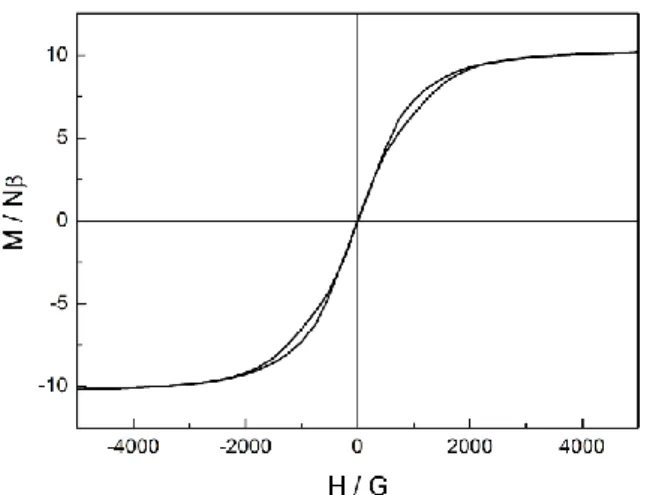
Relaxation times on the order of a second remain too fast to observe the opening of the hysteresis loop at 2 K while at 0.47 K the hysteresis loop slightly opens (Fig. 11).
Fig. 11 Magnetic hysteresis loop of 3 measured at 0.47 K.
Observation of remnant magnetization (residual magnetization in the absence of an external field) is problematic in the case of mononuclear complexes of DyIII. The typical butterfly-shaped hysteresis loop observed in 3, is a consequence of the hyperfine coupling and the internal field created in condensed phases by neighbouring molecules.
Ab initio calculations. SA-CASSCF/RASSI-SO calculations were performed on two separate DyIII monomeric fragments of 3 to rationalize the observed magnetic properties (see computational details). Energy spectra and g tensors for the eight Kramer’s doublets of the ground 6H15/2 multiplet of the two DyIII ions are given in Figure S18 and Table S5. The energy splitting of the 6H15/2 multiplet is almost identical for the two DyIII ions leading to similar magnetic contributions of each metallic centre in the thermal dependence of the MT product. The calculated MT vs T (Fig. 11) and M vs H (Fig. S16) curves fairly well reproduced the experimental curves. Calculations confirm the axial character of the magnetic anisotropy tensor of the ground Kramer’s doublet with large gz values of 19.24 for Dy1 and 19.34 for Dy2 and almost negligible gx and gy values (Table S5). It clearly appears that the gz value for Dy1 and Dy2 is
close to the expected gz = 20 for a pure MJ = 15/2 ground state.47 The calculated ground-state easy axis (Fig. 12) for each DyIII ion is oriented perpendicular to the plane formed by the {tetrathiafulvalenyl-1H-benzimidazol-2-yl}pyridine and bipyridine moieties as expected for an oblate ion.48,16g Moreover, magnetic relaxation pathways can be interpreted on the basis of magnetic transition moments (Fig. 13). It confirms the similarity in the dynamic magnetic properties for both DyIII ions. In both cases, no direct transition is expected whereas relaxation mechanisms involving the first and second MJ states are highly probable.
Fig. 12 Representation of complex 3 with theoretical orientations of the easy magnetic
axis of the two DyIII centres.
Fig. 13 Computed magnetization blocking barriers in complex 3 for Dy1 (a) and Dy2 (b)
ions. Numbers provided on each arrow are the mean absolute values for the corresponding matrix elements of the magnetic transition dipole moment.
Slightly different relaxation pathways are calculated for the two metal sites, however these variations are not enough to experimentally discriminate the two DyIII ions. The calculations indicate a difference between the and the expected barrier, being the latter almost the double of the former: ~90 cm-1 vs ~40 cm-1. However, such discrepancy is pretty common in literature49 and probably due the contribution of coupling of spin-phonon degrees of freedom in the SMM relaxation mechanisms. The latter are not accounted in the ab initio model. The general importance of such contributions was recently evidenced in the spin-phonon bottleneck mechanism50 and in the strong dependence both in sign and magnitude of anisotropic exchange on single vibrational mode51.
Conclusions
The present work describes the crystal structure of two TTF-based ligands involving either 2,6-di(pyrazol-1-yl)-4pyridine (L1)
or 4,4'-dimethyl-2,2'-bipyridine (L2) as second coordinating
fragment while the first one is insured by the fused benzimidazol-2-yl-pyridine. Three dinuclear coordination complexes of formulae [Yb2(hfac)6(L1)]2(CH2Cl2)·C6H14 (1) and
[Ln2(hfac)6(L2)]CH2Cl2 (Ln = Yb (2) and Dy (3)) have been
synthesized. Their X-ray structures reveal that both coordination sites can be occupied in the case of DyIII and YbIII ions. The lanthanide ions in eight-coordination environment adopt square antiprism polyhedra (D4d symmetry) while the ones in nine-coordination sphere adopt spherical tricapped trigonal prism (D3h).
The UV-visible absorption properties of the ligands and relative complexes have been determined and rationalized by TD-DFT calculations. The lowest-energy absorption bands have been attributed to HOMO LUMO ILCT bands and used to sensitize the YbIII luminescence of 1 and 2 through an efficient antenna effect of L1 and L2. The YbIII luminescence is identical for both metal centres in 2 since they adopt very similar environment and coordination polyhedra symmetry while two distinct emission contributions can be quantitatively distinguished for 1. This is in agreement with the two magnetic behaviours observed in the DyIII analogue of 1 which has been previously studied by some of us.18
On a magnetic point of view, compound 3 behaves as a SMM with an opening of the hysteresis loop detected at low temperature. The two DyIII centres have very similar dynamic characteristics. Ab initio calculations rationalized the uniaxiality of the magnetic anisotropy for both Dy1 and Dy2 ions and the orientations of their anisotropy axis were determined.
In future work, the possibility to selectively coordinate the different chelating coordination sites will be explored in order to open the route to the design of large variety of hetero-bimetallic pure-lanthanide and 3d-4f complexes.
Acknowledgements
This work was supported by Région Bretagne, Rennes Métropole, CNRS, Université de Rennes 1 and FEDER. G.F.G
gratefully acknowledges the European Commission through the ERC-AdG 267746 MolNanoMas (project n. 267746) and the ANR (ANR-13-BS07-0022-01) for financial support. B.L.G. and G.F.G. thank the French GENCI/IDRIS-CINES centr for high-performance computing resources.
Notes and references
1 D. N. Woodruff, R. E. P. Winpenny and R. A. Layfield, Chem.
Rev., 2013, 113, 5110-5148.
2 (a) D. Gatteschi, R. Sessoli and J. Villain, Molecular Nanomagnets; Oxford University Press: New York, 2006; (b) L. Bogani and W. Wernsdorfer, Nat. Mater., 2008, 7, 179-186; (c) M. Mannini, F. Pineider, P. Sainctavit, C. Danieli, E. Otero, C. Sciancalepore, A.-M. Talarico, M.-A. Arrio, A. Cornia, D. Gatteschi and R. Sessoli, Nat. Mater., 2009, 8, 194-197; (d) M. N. Leuenberger and D. Loss, Nature, 2001, 410, 789−793; (e) J. Lehmann, A. Gaita-Arino, E. Coronado and D. Loss, Nat.
Nanotechnol., 2007, 2, 312-317; (f) M. Ganzhorn, S.
Klyatskaya, M. Ruben and W. Wernsdorfer, Nat. Nanotechnol. 2013, 8, 165-169.
3 (a) P.-E. Car, M. Perfetti, M. Mannini, A. Favre, A. Caneschi, R. Sessoli, Chem. Commun., 2011, 47, 3751-3753; (b) G. Cucinotta, M. Perfetti, J. Luzon, M. Etienne, P.-E. Car, A. Caneschi, G. Calvez, K. Bernot and R. Sessoli, Angew. Chem.,
Int. Ed. 2012, 51, 1606-1610; (c) M.-E. Boulon, G. Cucinotta, J.
Luzon, C. Dedl’Innocenti, M. Perfetti, K. Bernot, G. Calvez, A. Caneschi and R. Sessoli, Angew. Chem., Int. Ed., 2013, 52, 350-354.
4 (a) S.-D. Jiang, B.-W. Wang, G. Su, Z.-M. Wang and S. Gao,
Angew. Chem., Int. Ed., 2010, 49, 7448-7451; (b) R. A. Layfield,
J. J. W. Mcdouall, S. A. Sulway, F. Tuna, D. Collison and R. E. P. Winpenny, Chem.-Eur. J., 2010, 16, 4442-4446; (c) S.-D. Jiang, S.-S. Liu, L.-N. Zhou, B.-W. Wang, Z.-M. Wang and S. Gao,
Inorg. Chem., 2012, 51, 3079-3087; (d) M. Jeletic, P.-H. Lin, J.
J. Le Roy, I. Korobkov, S. I. Gorelsky and M. Murugesu, J. Am.
Chem. Soc., 2011, 133, 19286-19289; (e) S. Demir, J. M.
Zadrozny and J. R. Long, Chem.-Eur. J., 2014, 20, 9524-9529; (f) J. J. Le Roy, M. Jeletic, S. I. Gorelsky, I. Korobkov, L. Ungur, L. F. Chibotaru and M. Murugesu, J. Am. Chem. Soc., 2013, 135, 3502-3510.
5 (a) N. Ishikawa, M. Sugita, T. Ishikawa, S. Koshihara and Y. Kaizu, J. Am. Chem. Soc., 2003, 125, 8694-8695; (b) K. Wang, S. Zeng, H. Wang, J. Doub and J. Jiang, Inorg. Chem. Front. 2014, 1, 167-171.
6 J. Jung, F. Le Natur, O. Cador, F. Pointillart, G. Calvez, C. Daiguebonne, O. Guillou, T. Guizouarn, B. Le Guennic and K. Bernot, Chem. Commun., 2014, 50, 13346-13348.
7 K. Kuriki, Y. Koike, Y. Okamoto, Chem. Rev., 2002, 102, 2347-2356.
8 E. G. Moore, A. P. S. Samuel and K. N. Raymond, Acc. Chem.
Res., 2009, 42, 542-552 and references therein.
9 (a) J.-C. G. Bünzli, Chem. Rev., 2010, 110, 2729-2755; (b) R. M. Duke, E. B. Veale, F. M. Pfeffer, P. E. Kruger and T. Gunnlaugsson, Chem. Soc. Rev., 2010, 39, 3936-3953. 10 (a) A. Beeby, S. W. Botchway, I. M. Clarkson, S. Faulkner, A. M.
Parker, D. Parker and J. A. G. Williams, J. Photochem.
Photobiol., B, 2000, 57, 83-89; (b) A. Grichine, A. Haefele, S.
Pascal, A. Duperray, R. Michel, C. Andraud, O. Maury, Chem.
Science, 2014, 5, 3475-3485.
11 J. H. van Vleck, J. Phys. Chem., 1937, 41, 67-80.
12 A. D’Aléo, F. Pointillart, L. Ouahab, C. Andraud and O. Maury,
Coord. Chem. Rev. 2012, 256, 1604-1620.
13 F. Pointillart, B. Le Guennic, O. Cador, O. Maury and L. Ouahab, Acc. Chem. Res., 2015, 48, 2834-2842.
14 (a) G. Cucinotta, M. Perfetti, J. Luzon, M. Etienne, P. E. Car, A. Caneschi, G. Calvez, K. Bernot and R. Sessoli, Angew. Chem.
Int. Ed. 2012, 51, 1606-1610; (b) J. Long, R. Vallat, R. A. S.
Ferreira, L. D. Carlos, F. A. A. Paz, Y. Guari and J. Larionova,
Chem. Commun., 2012, 48, 9974-9976; (c) K. Yamashita, R.
Miyazaki, Y. Kataoka, T. Nakanishi, Y. Hasegawa, M. Nakano, T. Yamamura and T. Kajiwara, Dalton Trans., 2013, 42, 1987-1990; (d) K. Ehama, Y. Ohmichi, S. Sakamoto, T. Fujinami, N. Matsumoto, N. Mochida, T. Ishida, Y. Sunatsuki, M. Tsuchimoto and N. Re, Inorg. Chem. 2013, 52, 12828-12841; (e) M. Ren, S.-S. Bao, R. A. S. Ferreira, L.-M. Zheng and L. D. Carlos, Chem. Commun., 2014, 50, 7621-7624; (f) X. Yi, K. Bernot, V. Le Corre, G. Calvez, F. Pointillart, O. Cador, B. Le Guennic, J. Jung, O. Maury, V. Placide, Y. Guyot, T. Roisnel, C. Daiguebonne and O. Guillou, Chem. Eur. J., 2014, 20, 1569-1576.
15 (a) S. Faulkner, B. P. Burton-Pye, T. Khan, L. R. Martin, S. D. Wray and P. J. Skabara, Chem. Commun., 2002, 1668-1669; (b) S. J. A. Pope, B. P. Burton-Pye, R. Berridge, T. Khan, P. Skabara and S. Faulkner, Dalton Trans., 2006, 2907-2912; (c) F. Pointillart, T. Cauchy, O. Maury, Y. Le Gal, S. Golhen, O. Cador and L. Ouahab, Chem. Eur. J., 2010, 16, 11926-11941; (d) F. Pointillart, A. Bourdolle, T. Cauchy, O. Maury, Y. Le Gal, S. Golhen, O. Cador and L. Ouahab, Inorg. Chem., 2012, 51, 978-984; (e) F. Pointillart, B. Le Guennic, S. Golhen, O. Cador, O. Maury and L. Ouahab, Inorg. Chem., 2013, 52, 1610-1620; (f) Y.-F. Ran, M. Steinmann, M. Sigrist, S.-X. Liu, J. Hauser and S. Decurtins, C. R. Chim., 2012, 15, 838-844; (f) G. Lapadula, D. Trummer, M. P. Conley, M. Steinmann, Y.-F. Ran, S. Brasselet, Y. Guyot, O. Maury, S. Decurtins, S.-X. Liu, C. Copéret, Chem.
Mater., 2015, 27, 2033-2039.
16 (a) F. Pointillart, Y. Le Gal, S. Golhen, O. Cador and L. Ouahab,
Chem. Eur. J., 2011, 17, 10397-10404; (b) F. Pointillart, S.
Klementieva, V. Kuropatov, Y. Le Gal, S. Golhen, O. Cador, V. Cherkasov and L. Ouahab, Chem. Commun., 2012, 48, 714-716; (c) F. Pointillart, B. Le Guennic, T. Cauchy, S. Golhen, O. Cador, O. Maury and L. Ouahab, Inorg. Chem., 2013, 52, 5978-5990; (d) G. Cosquer, F. Pointillart, S. Golhen, O. Cador and L. Ouahab, Chem. Eur. J., 2013, 19, 7895-7903; (e) T. T. da Cunha, J. Jung, M.-E. Boulon, G. Campo, F. Pointillart, C. L. M. Pereira, B. Le Guennic, O. Cador, K. Bernot, F. Pineider, S. Golhen and L. Ouahab, J. Am. Chem. Soc., 2013, 135, 16332-16335; (f) F. Pointillart, K. Bernot, S. Golhen, B. Le Guennic, T. Guizouarn, L. Ouahab and O. Cador, Angew. Chem. Int. Ed., 2015, 54, 1504-1507; (g) F. Pointillart, J. Jung, R. Berraud-Pache, B. Le Guennic, V. Dorcet, S. Golhen, O. Cador, O. Maury, Y. Guyot, S. Decurtins, S.-X. Liu and L. Ouahab, Inorg. Chem., 2015, 54, 5384-5397; (h) F. Gao, X.-M. Zhang, L. Cui, K. Deng, Q.-D. Zeng and J.-L. Zuo, Scientific Rep. 2014, 4, 5928.
17 (a) F. Pointillart, B. Le Guennic, S. Golhen, O. Cador, O. Maury and L. Ouahab, Chem. Commun., 2013, 49, 615-617; (b) K. Soussi, J. Jung, F. Pointillart, B. Le Guennic, B. Lefeuvre, S. Golhen, O. Cador, Y. Guyot, O. Maury, and L. Ouahab, Inorg.
Chem. Front., 2015, 2, 1105-1117.
18 J. Wu, N. Dupont, S.-X. Liu, A. Neels, A. Hauser, S. Decurtins,
Chem. Asian J., 2009, 4, 392-399.
19 M. Feng, F. Pointillart, B. Lefeuvre, V. Dorcet, S. Golhen, O. Cador and L. Ouahab, Inorg. Chem., 2015, 54, 4021-4028. 20 M. F. Richardson, W. F. Wagner and D. E. Sands, J. Inorg. Nucl.
Chem., 1968, 30, 1275-1289.
21 K. Kodama, A. Kobayashi and T. Hirose, Tetrahedron Lett., 2013, 54, 5514–5517.
22 SHELX97 - Programs for Crystal Structure Analysis (Release 97-2). G. M. Sheldrick, Institüt für Anorganische Chemie der Universität, Tammanstrasse 4, D-3400 Göttingen, Germany, 1998. SIR97 – A. Altomare, M. C. ; Burla, M. Camalli, G. L. Cascarano, C. Giacovazzo, A. Guagliardi, A. G. G. Moliterni, G. Polidori and R. Spagna, J. Appl. Cryst., 1999, 32, 115-119.
23 M. J. Frisch, G. W. Trucks, H. B. Schlegel, G. E. Scuseria, M. A. Robb, J. R. Cheeseman, G. Scalmani, V. Barone, B. Mennucci, G. A. Petersson, H. Nakatsuji, M. Caricato, X. Li, H. P. Hratchian, A. F. Izmaylov, J. Bloino, G. Zheng, J. L. Sonnenberg, M. Hada, M. Ehara, K. Toyota, R. Fukuda, J. Hasegawa, M. Ishida, T. Nakajima, Y. Honda, O. Kitao, H. Nakai, T. Vreven, Jr. J. A. Montgomery, J. E. Peralta, F. Ogliaro, M. Bearpark, J. J. Heyd, E. Brothers, K. N. Kudin, V. N. Staroverov, R. Kobayashi, J. Normand, K. Raghavachari, A. Rendell, J. C. Burant, S. S. Iyengar, J. Tomasi, M. Cossi, N. Rega, J. M. Millam, M. Klene, J. E. Knox, J. B. Cross, V. Bakken, C. Adamo, J. Jaramillo, R. Gomperts, R. E. Stratmann, O. Yazyev, A. J. Austin, R. Cammi, C. Pomelli, J. W. Ochterski, R. L. Martin, K. Morokuma, V. G. Zakrzewski, G. A. Voth, P. Salvador, J. J. Dannenberg, S. Dapprich, A. D. Daniels, O. Farkas, J. B. Foresman, J. V. Ortiz, J. Cioslowski and D. J.; Fox, Gaussian 09 Revision A.02, Gaussian Inc., Wallingford CT, 2009.
24 J. P. Perdew, K. Burke and M. Ernzerhof, Phys. Rev. Lett., 1996, 77, 3865-3868; (b) C. Adamo and V. Barone, J. Chem. Phys., 1999, 110, 6158-6170.
25 M. Dolg, H. Stoll and H. Preuss, Theor. Chim. Acta, 1993, 85, 441-450.
26 F. Weigend and R. Ahlrichs, Phys. Chem. Chem. Phys., 2005, 7, 3297-3305.
27 J. Tomasi, B. Mennucci and R. Cammi, Chem. Rev., 2005, 105, 2999-3093.
28 (a) M. Cossi and V. Barone, J. Chem. Phys., 2001, 115, 4708-4717; (b) R. Improta, V. Barone, G. Scalmani and M. J. A. Frisch, J. Chem. Phys., 2006, 125, 054103-054109.
29 A.-R. Allouche, J. Comput. Chem., 2011, 32, 174-182.
30 F. Aquilante, L. De Vico, N. Ferré, G. Ghigo, P. A. Malmqvist, P. Neogrady, T. Bondo Pedersen, M. Pitonak, M. Reiher, B. O. Roos, L. Serrano-Andrés, M. Urban, V. Veryazov and R. Lindh,
J. Comput. Chem., 2010, 31, 224-247.
31 B. O. Roos, P. R. Taylor and P. E. M. A. Siegbahn, Chem. Phys. 1980, 48, 157-288.
32 (a) P. A. Malmqvist, B. O. Roos and B. Schimmelpfennig, Chem.
Phys. Lett. 2002, 357, 230−240; (b) P. A. Malmqvist and B. O.
Roos, Chem. Phys. Lett., 1989, 155, 189−194.
33 (a) L. F. Chibotaru and L. Ungur, J. Chem. Phys., 2012, 137, 064112–064122; (b) L. F. Chibotaru, L. Ungur and A. Soncini,
Angew. Chem., Int. Ed., 2008, 47, 4126–4129.
34 F. Aquilante, P.-A. Malmqvist, T.-B. Pedersen, A. Ghosh and B. O. Roos, J. Chem. Theory Comput., 2008, 4, 694–702. 35 (a) B. O. Roos, R. Lindh, P.-A. Malmqvist, V. Veryazov, P.-O.
Widmark, J. Phys. Chem. A, 2004, 108, 2851–2858; (b) B. O. Roos, R. Lindh, P.-A. Malmqvist, V. Veryazov and P.-O. Widmark, J. Phys. Chem. A, 2005, 109, 6575–6579; (c) B. O. Roos, R. Lindh, P.-A. Malmqvist, V. Veryazov, P.-O. Widmark and A.-C. Borin, J. Phys. Chem. A, 2008, 112, 11431–11435. 36 M. Llunell, D. Casanova, J. Cirera, J. M. Bofill, P. Alemany and
S. Alvarez, S. SHAPE (version 2.1), Barcelona, 2013.
37 G. Cosquer, F. Pointillart, B. Le Guennic, Y. Le Gal, S. Golhen, O. Cador and L. Ouahab, Inorg. Chem., 2012, 51, 8488-8501. 38 X. Yi, K. Bernot, V. Le Corre, G. Calvez, P. Pointillart, O. Cador,
B. Le Guennic, J. Jung, O. Maury, V. Placide, Y. Guyot, T. Roisnel, C. Daiguebonne and O. and Guillou, Chem.-Eur. J., 2014, 20, 1569-1576.
39 P. Goldner, F. Pell, D. Meichenin, F. Auzel, J. Lumin., 1997, 71, 137-150.
40 M. Feng, F. Pointillart, B. Le Guennic, B. Lefeuvre, S. Golhen, O. Cador, O. Maury and L. Ouahab, Chem. Asian J., 2014, 2814-2825.
41 (a) A. D'Aléo, A. Picot, A. Beeby, J. A. G. Williams, B.. Le Guennic, C. Andraud and O. Maury, Inorg. Chem., 2008, 47, 10258-10268; (b) F. Pointillart, O. Maury, Y. Le Gal, S. Golhen, O. Cador and L. Ouahab, Inorg. Chem., 2009, 48, 7421-7429; (c) A. Bourdolle, M. Allali, A. D’ Aléo, P. L. Baldeck, K. Kamada,
J. A. G. Williams, H. Le Bozec, C. Andraud and O. Maury,
ChemPhysChem., 2013, 14, 3361-3367.
42 G. Cosquer, F. Pointillart, J. Jung, B. Le Guennic, S. Golhen, O. Cador, Y. Guyot, A. Brenier, O. Maury and L. Ouahab, Eur. J.
Inorg. Chem., 2014, 69-82.
43 (a) C. Görlder-Walrand and K. Binnemans, Hanbook on the
Physiscs and Chemistry of Rare Earths, 1996, 23, p. 121; (b) N.
M. Shavaleev, G. Accorsi, D. Virgili, Z. R. Bell, T. Lazarides, G. Calogero, N. Armaroli, M. D. Ward, Inorg. Chem., 2005, 44, 61-72.
44 O. Kahn, Molecular Magnetism; VCH: Weinhem, 1993. 45 (a) R. Orbach, Proc. Phys. Soc. A, 1961, 264, 458; (b) C.
Rudowicz, J. Phys. C: Solid State Phys., 1985, 18, 1415. 46 (a) C. Dekker, A. F. M. Arts, H. W. Wijn, A. J. van Duyneveldt
and J. A. Mydosh, Phys. Rev. B, 1989, 40, 11243; (b) K. S. Cole and R. H. Cole, J. Chem. Phys., 1941, 9, 341.
47 A. Abragam and B. Bleaney, Electron paramagnetic Resonance of Transition ions, Dover Publications, INC: New York, 1986.
48 (a) J. Jung, T. T. da Cunha, B. Le Guennic, F. Pointillart, C. L. M. Pereira, J. Luzon, S. Golhen, O. Cador, O. Maury and L. Ouahab, Eur. J. Inorg. Chem., 2014, 3888-3894.
49 (a) K. S. Pedersen, J. Dreiser, H. Weihe, R. Sibille, H. V. Johannesen, M. A. Sørensen, B. E. Nielsen, M. Sigrist, H. Mutka, S. Rols, J. Bendix and S. Piligkos, Inorg. Chem., 2015, 54, 7600-7606; (b) J. M. Zadrozny and J. R. Long, J. Am. Chem. Soc., 2011, 133, 20732-20734; (c) D. E. Freedman, W. H.
Harman, T. D. Harris, G. H. Long, C. J. Chang and J. R.; Long, J.
Am. Chem. Soc., 2010, 132, 1224-1225.
50 L. Tesi, A. Lunghi, M. Atzori, E. Lucaccini, L. Sorace, F. Totti and R. Sessoli, Dalton Trans. DOI: 10.1039/C6DT02559E.