HAL Id: hal-02454194
https://hal.archives-ouvertes.fr/hal-02454194
Submitted on 24 Jan 2020
HAL is a multi-disciplinary open access
archive for the deposit and dissemination of
sci-entific research documents, whether they are
pub-lished or not. The documents may come from
teaching and research institutions in France or
abroad, or from public or private research centers.
L’archive ouverte pluridisciplinaire HAL, est
destinée au dépôt et à la diffusion de documents
scientifiques de niveau recherche, publiés ou non,
émanant des établissements d’enseignement et de
recherche français ou étrangers, des laboratoires
publics ou privés.
Transient surface tension in miscible liquids
Laurent Lacaze, Patrick Guenoun, Daniel Beysens, Michel Delsanti, Philippe
Petitjeans, Pascal Kurowski
To cite this version:
Laurent Lacaze, Patrick Guenoun, Daniel Beysens, Michel Delsanti, Philippe Petitjeans, et al..
Tran-sient surface tension in miscible liquids. Physical Review E : Statistical, Nonlinear, and Soft Matter
Physics, American Physical Society, 2010, 82 (4), �10.1103/PhysRevE.82.041606�. �hal-02454194�
Transient surface tension in miscible liquids
Laurent Lacaze,1,2Patrick Guenoun,2,
*
Daniel Beysens,1,3Michel Delsanti,2Philippe Petitjeans,1and Pascal Kurowski1 1Laboratoire de Physique et Mécanique des Milieux Hétérogènes (PMMH), Ecole Supérieure de Physique et de Chimie Industrielles (ESPCI), 10 rue Vauquelin, 75231 Paris Cedex 5, France
2
IRAMIS, LIONS, UMR SIS2M 3299 CEA-CNRS, CEA-Saclay, F-91191 Gif-Sur-Yvette Cedex, France 3CEA, INAC, Service des Basses Températures, F-38042 Grenoble, France
共Received 9 February 2010; revised manuscript received 16 June 2010; published 27 October 2010兲
Evidence of the existence of a transient surface tension between two miscible fluid phases is given. This is done by making use of a density matched free of gravity perturbations, binary liquid of isobutyric acid and water, which presents a miscibility gap and is studied by light scattering. The experiment is performed very near the critical point of the binary liquid, where the diffusion of phases is extremely slow. The surface tension is deduced from the evolution of the structure factor obtained from low angle light scattering. The latter evolution is successfully analyzed in terms of a local equilibrium diffusive approach that makes explicit how the surface tension decreases with time.
DOI:10.1103/PhysRevE.82.041606 PACS number共s兲: 68.05.⫺n, 05.60.Cd, 64.70.Ja
I. INTRODUCTION
When a drop of wine is gently immersed in a glass of water from the tip of a pen, after unavoidable initial hydro-dynamics and buoyancy effects, some experiments show that the drop, before dissolving away, can retain for a while a ringlike compact shape关1兴. It looks like as if a nonzero
sur-face tension between both phases, nevertheless completely miscible, could persist for some time. From a mechanical point of view, surface tension can be calculated as an integral of unbalanced tangential stresses over the interface thickness 关2,3兴. It is thus of no surprise that, within the assumption of
temporal and local equilibrium, such a tension can be as-cribed to an interface between two miscible fluids 关4兴 and
assumes a nonzero value. This was first considered by Ko-rteweg 关5兴, who introduced the so-called Korteweg stresses
due to concentration inhomogeneities.
The determination of such a transient surface tension should play an important role in numerous applications of fluid mechanics, where mixing of two fluids needs to be mastered down to small scales 共microfluidics兲. A transient surface tension between two miscible phases appears also as a necessary input in the numerical simulations of miscible fluids when modeling Rayleigh-Taylor instabilities 关6兴 or
Hele-Shaw flows关7兴.
A number of attempts to measure a transient surface ten-sion have been carried out so far by different techniques. Following a pioneering study on geophysical fluids by Mungall关8兴, a couple of experimental studies have used the
rotating drop method in order to put directly into contact two fluids and measure the surface tension 关1兴. Such a surface
tension determination necessitates a precise knowledge of the evolution of the phase densities, which is not always available 关9–12兴. Moreover, the method of analysis of the
drop profile is often delicate since the standard conditions of a single elongated cylinder are not always met. Other at-tempts dealt with measurements of the light scattered by a
gravity-pinned planar interface between partially miscible liquids, suddenly quenched from the two-phase region to the one-phase region 关13,14兴. The step in temperature made in
both cases was of several tenths of degrees across the critical point. This leads to a temporal evolution that is mostly not isothermal since the surface tension varies strongly with tem-perature when approaching the critical point. Moreover, the origin of the scattered light can be attributed to both ther-mally activated capillary waves共giving access to surface ten-sion兲 and bulk nonequilibrium concentration fluctuations 共due to the widening interface兲 关14兴. In the one-phase region,
these latter bulk fluctuations tend to be dominant over the single interface signal, making the surface signal delicate to detect.
In the experiments presented here, we choose another ex-perimental configuration aimed at reaching a quasi-isothermal behavior and at maximizing the surface signal over the bulk fluctuation signal. We investigate by light-scattering techniques the bulk remixing of a partially mis-cible binary liquid 共isobutyric acid and water, denoted IW兲 initially in its two-phase region very close to its critical point. In this region, well-known critical slowing down al-lows precise time-resolved measurements to be performed, and a universal evolution, which follows scaling laws in tem-perature, can be used with confidence共see, e.g., Chap. 8.5 in 关15兴兲. We are then able 共i兲 to precisely locate the time where
the system returns to the one-phase region and共ii兲 to follow a quasi-isothermal behavior for the surface tension relax-ation. Our detected signal relies on correlation between mul-tiple interfaces 共structure factor兲 and is dominant over bulk scattering as long as interfaces are sharp enough.
The IW mixture exhibits an upper critical solution tem-perature. The initial state of the mixture is prepared at a temperature T⬎Tc共the critical temperature兲, where the
sys-tem is homogeneous 共one-phase region兲. Phase separation and subsequent remixing are triggered by two successive thermal quenches, a first quench below Tc, and a second
quench above Tc. The quenches are precisely controlled by
using a thin sample immersed in a thermostat with tempera-ture control within 0.2 mK. Provided the phase transition time scale is adapted, the initial two-phase state developing
during the first quench can be described as a set of random interfaces whose evolution is precisely known and driven for long times by surface tension关16兴. In addition, the IW
mix-ture exhibits density matching, so that gravity perturbations 共buoyancy flows兲 are absent 关17兴.
Along this first quench below Tc, if no further action was
taken, the domains of both phases would grow—thanks to capillary flows—and eventually give rise to two macroscopi-cally well separated phases due to long term gravity sedi-mentation and wetting forces. Before reaching this final state, the second thermal quench above Tcdrives the mixture
back to the one-phase region. During all the quenches, light scattering through the sample provides the structure factor of the domains, which is the Fourier transform of the domain correlation function. The evolution of the domains during the first quench is driven by both the mutual diffusion of the species共“demixing”兲 and the domain coalescences, the latter inducing capillary flows. During the second upward quench, mutual diffusion again 共“remixing”兲 and possible capillary flows, due to the expected transient surface tension, contrib-ute to the dynamics.
In this paper, we show that capillary flows persist for some time when the mixture is quenched back to the one-phase region, during the second quench. The interfacial ten-sion is then deduced from the persistence of capillary flows and is shown to vanish with time according to a simple dif-fusion model.
II. EXPERIMENTAL
The IW mixture is used at critical concentration 共acid mass fraction of 0.3885兲 关18兴. Its miscibility critical
tempera-ture is Tc⬃26.5 °C. This value can appreciably change with
the presence of even minute impurity concentrations in the cell. Its experimental determination is thus necessary prior to each experiment. It is obtained within a precision of 0.4 mK from light transmittancy measurements. A parallelepipedic fused-quartz cell of 2 mm inner width with walls of 1 mm thickness is filled with the mixture and placed in a copper oven coupled to a temperature regulation within 0.1 mK 共ATNE, France兲. This temperature control system enables one also to quench up or down the system in temperature. The thermal evolution of the sample is monitored by in situ optical measurements through the sample 共light transmit-tancy兲 by shining a laser beam whose power is low enough 共⬍0.1 mW兲 so as not to heat the sample. Since the transmit-ted light intensity varies like It⬃共T−Tc兲 关19兴, the
tempera-ture variation can be then determined in the sample precisely at the beam location and provides the accurate requested de-termination of Tc. The quench down is limited by the small
natural cooling heat flux with a thermal constant of order 20 s. The parameters of the temperature regulation are chosen to minimize the time of quenching up, which is of order 10 s.
The light scattered from the cell is detected at small angles by a charge-coupled device camera. The transfer wave vector is k = 4n sin共/2兲/0, where 0 共633.3 nm兲 is the laser wavelength in vacuum, n = 1.3568 is the mixture refrac-tive index for this wavelength 关20兴, and is the scattering angle in the liquid. Details on the small-angle scattering setup can be found in Ref. 关21兴.
A typical double-quench experiment goes as follows. Ini-tially, the mixture is stirred at Tc+ 10 K, where it
homog-enizes. Then, temperature is gradually decreased down to temperature Ti at a few mK above Tc. At a time t = tI, the
mixture is quenched down to the temperature Tfat a few mK
below Tc, where it phase separates. After some time on order
of 30–40 s, the mixture is quenched back up at a time t = tIIto
the initial temperature Ti. The scattered light Is共k,t,T兲 is
re-corded throughout the whole process.
In order to obtain the structure factor S共k,t,T兲 due to the interfaces, a background contribution Ib共k,t,T兲 has to be
subtracted from the raw signal Is共k,t,T兲. This background
corresponds to the bulk scattering fluctuations plus the para-sitic contributions 共cell windows, optics兲. Its contribution could be estimated from the stationary equilibrium intensity Ib共k,Ti兲 recorded at the temperature Tiin the one phase
re-gion, i.e., Ib共k,Ti兲=Is共k,Ti兲. However, it was observed that
such a treatment does not account for a perfect subtraction at high wave vectors presumably because those fluctuations are nonequilibrium. Actually, during phase separation, the high wave-vector fluctuations are not identical to the Ornstein-Zernike-type fluctuations of the one-phase region but are nonequilibrium fluctuations, which add up to large scale cor-relations of domains measured by the structure factor. We then chose to model these fluctuations by a simple multipli-cative factor共t兲 since we do not expect these fluctuations to have any structure in the wave-vector range of S共k,t兲. This factor ensures that S共k,t兲 goes to zero outside the k window under study, an approximate but reasonable assumption. The factor 共t兲 is such as Ib共k,t,T兲=共t兲⫻Is共k,Ti兲. It is
deter-mined to obtain Is共k,t,T兲−共t兲Is共k,Ti兲=0 for 2.48
⫻106 m−1⬍k⬍k
max, where kmax共=2.53⫻106 m−1兲 is the
maximum accessible wave vector of the setup. In order to extract the structure factor after the background subtraction, a normalization is performed: S共k,t,T兲⬀关Is共k,t,T兲
− Ib共k,t,T兲兴/共t兲. An example of such a treatment is given in
Fig.1.
It must be noted that the background subtraction from the scattered light is only useful for assessing the scaling behav-ior of the structure factor. It is not necessary for the discus-sion of the evolution of the peak of the structure factor with time.
III. RESULTS
Several double quenches have been carried out. Common features are observed for all of them, and we report here about four double quenches 共see Table I兲. After 30–40 s of
separation at Tf, the mixture was quenched back up to Ti. For
T⬍Tc, S共k,t,T兲 is a peak-shaped curve as a function of k.
The position of the maximum Sm共t,T兲=S共k=km, t , T兲
corre-sponds to the mean distance Lm共t兲=2/km共t兲 between the
growing domains of the separating phases at temperature T. As time increases, the maximum Sm共t,T兲 increases and
km共t,T兲 diminishes, the latter behavior showing the phases
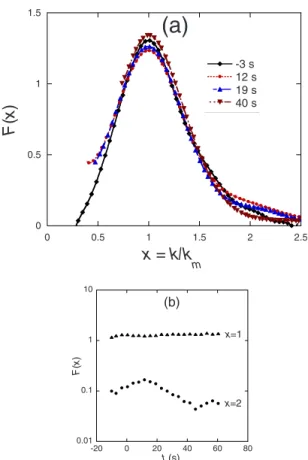
coarsening. Relying on scaling assumptions and experi-ments, a time invariant scaling form F共x兲 has been proposed 共see, e.g., Eq. 8.3.13 in 关15兴兲. With x=k/km, it reads
LACAZE et al. PHYSICAL REVIEW E 82, 041606共2010兲
F共x兲 = km共t兲
3S共k,t兲
冕
k2S共k,t兲dk. 共1兲
The integral in Eq.共1兲 is performed from km/2 to 2kmand is
weakly sensitive to the choice of the integration interval. Such a scaling behavior is shown in Figs.2共a兲and2共b兲for a quench of 5 mK amplitude 共set 2 in Table I兲. In this case,
tI= −40 s and tII= 0 s. Scaling is typically observed from 30
s after the beginning of the first quench below Tc.
For T⬎TcS共k,t,T兲 is still a peak-shaped curve as a
func-tion of k and, for some time, coarsening persists as the posi-tion of the maximum of the curve, km共t,T兲, keeps decreasing
with time. Scaling is preserved until about 20 s after the beginning of the second quench above Tc.
IV. DISCUSSION A. Evolution below Tc
The evolution of km共t兲 in the two-phase region can be cast
into a universal scaling form when expressed with reduced quantities kmⴱ共t兲=km共t兲−and tⴱ= t/t−共see, e.g., the
introduc-tion of Secintroduc-tion 8.5 in 关15兴兲. − is the correlation length of
critical fluctuations below Tc. It varies as a function of the
distance to Tcas −=0
−⑀−, where ⑀=兩共T−T
c兲/Tc兩 is the
re-duced temperature and= 0.63. The nonuniversal amplitude is0−= 0.181 nm for IW关22兴. The time t−is the typical
dif-fusion time of a critical fluctuation. It can be expressed as 关15兴
t−=共 −兲2
D− . 共2兲
Here, D− is the diffusion constant below Tc, which can be
written as
D−= kBTc
6−, 共3兲
where is the shear viscosity, which remains almost con-stant near Tcand equals 2.9⫻10−3 Pa s for IW关22兴.
The process of phase separation below Tc can be
under-stood as follows关23兴. At early times, just after the mixture is
quenched below Tc 共time tⴱ⬇1兲, domains of both phases
nucleate on critical fluctuations 共kmⴱ⬇1兲. The concentration
and size of domains grow by diffusion, corresponding to the diffusive part of the kmevolution,
km,dⴱ ⬃ tⴱ−1/3. 共4兲
At the same time, the domains coalesce, inducing hydrody-namics flows of capillary origin that speed up the process and correspond to the hydrodynamic component of the km
evolution. At low Reynolds number, in the viscous limit, this component is proportional to time and corresponds to
km,hⴱ ⬃ tⴱ−1. 共5兲
While at early time both diffusion and coalescence contribute to the growth of domains, at late times 共tⴱ⬎ ⬃103兲 only coalescence-induced capillary flows dominate the evolution, 0 1x10⁴ 2x10⁴ 3x10⁴ 4x10⁴ 0 5x10⁵ 1x10⁶ 1.5x10⁶ 2x10⁶ 2.5x10⁶
I
(a
rb
.
u
n
its)
k
m(m
-1)
I
s(k)
I
b(k)
S(k)
FIG. 1. Structure factor S共k兲 from the raw scattered intensity
关Is共k兲, arbitrary units兴 and the background intensity 关Ib共k兲, arbitrary
units兴 at t=7.5 s and for a quench of 5 mK below Tc. S共k兲 is
obtained by subtracting to the raw intensity a background term which is assumed to be homothetic to the one-phase fluctuation
background. The background level is adjusted to make S共k兲 null at
the highest wave vector共see text兲.
0 0.5 1 1.5 0 0.5 1 1.5 2 2.5 S(10) S(30) S(40) S(90)
(a)
x = k/k
mF
(x
)
-3 s 12 s 19 s 40 s 0.01 0.1 1 10 -20 0 20 40 60 80 F (x ) t (s) x=1 x=2 (b)FIG. 2. 共Color online兲 共a兲 Scaled evolution of the reduced
struc-ture factor F共x兲 after a quench to Tc− 5 mK at time tI= −40 s and
Tc+ 5 mK at tII= 0 s. Scaling is not yet established at t = −3 s while
it is observed at later times共here are shown t=12 and 19 s兲. Later
on it breaks down at t = 40 s.共b兲 Evolution of F共x兲 for two
charac-teristic x values; x = 2 highlights the breaking of scaling at t ⯝20 s.
i.e., km⬇km,h. More precisely, when written in nonscaled
variables, Eq.共5兲 reflects the growth of domains of size Lm,h
due to capillary instabilities driven by the interfacial tension
, Lm,h= 2 km,h ⬀ t. 共6兲
This dual diffusive and hydrodynamic behavior was de-scribed by Furukawa关24兴, who gave a solution for kmⴱ in the
form
共kmⴱ − 1兲 − †共Aⴱ/Bⴱ兲1/2兵tan−1关kmⴱ共Bⴱ/Aⴱ兲1/2兴
− tan−1关共Bⴱ/Aⴱ兲1/2兴其‡ = Bⴱtⴱ, 共7兲 where Aⴱ and Bⴱ are adjustable parameters. For binary liq-uids 关17兴, Aⴱ⬃0.14 and Bⴱ⬃0.022 are found to reproduce
the experimental data.
In the time and temperature range investigated here 关20 ⬍共t−tI兲ⴱ⬍500兴, an approximation of the above solution
关Eq. 共7兲兴 reads Lmⴱ= 6.785tⴱ1/3+ 0.157tⴱ, where the
coeffi-cients are known within 20% because of the scattering of experimental data. This uncertainty will be taken into ac-count in the fits presented below. Making use of the universal relation关25兴
= kBT/10.4共−兲2, 共8兲
one obtains in terms of direct-space variables Lm= a共t − t1兲1/3+ b
共t − t1兲, 共9兲
with a = 2.84⫻10−6 m s−1/3 and b = 8.70⫻10−2. The time t1
takes into account the actual equilibration time of the sample, and the difference with tI is due to the thermal
dif-fusion in the thermostat and the sample. Note that the present mixture is closely density matched 关26兴 and the effect of
gravity on the flows is thus negligible关27兴. This means that
the evolution during quench I is limited to the range defined as kmlc⬎1, where lcis the capillary length. During the
evo-lution below Tc the structure factor progressively develops,
but the scaling in F共x兲 is observed typically 30 s after tI 共t
⬎−10 s兲, as shown in Fig.2. As already noted, this is due to the thermal delay between the fluid and the thermostat and the time needed for thermal gradients to fade away.
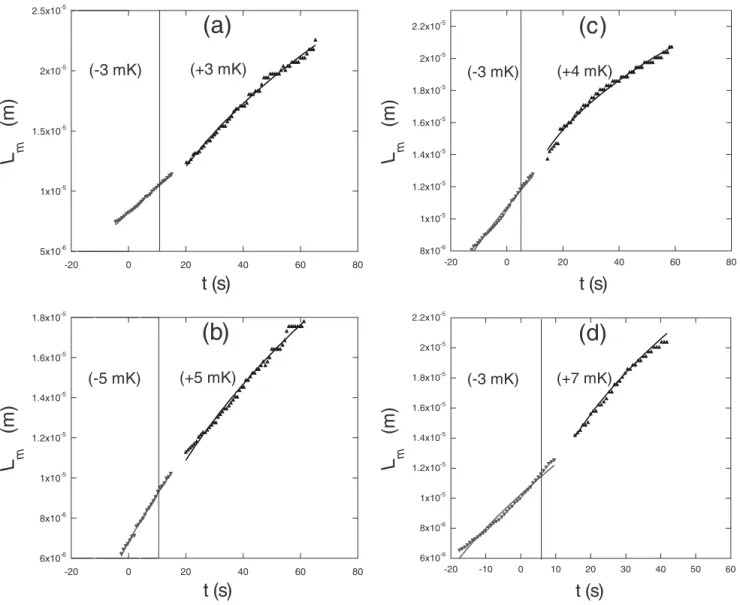
The domain evolution is fitted—thanks to Eq. 共9兲 共Fig. 3兲—and the best fit is obtained for a=2.27⫻10−6 m s−1/3, a value within the 20% uncertainty range of the nominal value. Since the exact time delay for reaching the temperature equi-librium in the sample is unknown, we consider the origin of time t1 and the 共temperature-dependent兲 surface tension as
adjustable parameters. The result of the fits are given in Table I, upper line, where the value of is obtained by making use of Eq. 共8兲. As expected, the values for t1 are
found to be on the order of −15 s. The surface tensionfitis
found to be somewhat lower than the expected value at temperature Tf, the largest discrepancy being found for the
deepest quench where the equilibration time is the largest. This can be due to the fact that the fluid has not reached its final equilibrium temperature yet. 共The error on can also originate from the uncertainty on b.兲
T A BLE I. Results of the fits to the Lm evolution below and above Tc . The underlined numbers are imposed in the fits. The symbol fit is used for both fits of the surface tension in the two-phase region 共upper part of the table 兲 and of the prefactor of the transient surface tension in the one-phase region 共lower part of the table 兲. Lm 共m兲 Set T − Tc 共mK 兲 共10 −9 Nm −1兲 t1 共s兲 t2 共s 兲 L0 共10 −6 m 兲 fit / li,fi t 共10 −6 m 兲 D 共10 −1 3 ms −2兲 li =1 6 − 共10 −6 m 兲 li,fi t /li T ⬍ Tc 2.84 ⫻ 10 −6共t − t1 兲 1/ 3 + 8.70 ⫻ 10 −2共 / 兲共 t− t1 兲 1 − 3 6.0 − 18.9 ⫾ 0.3 0.64 ⫾ 0.15 2 − 5 1 1.0 − 12.5 ⫾ 0.2 0.36 ⫾ 0.01 3 − 3 6.0 − 28.3 ⫾ 0.4 0.93 ⫾ 0.02 4 − 3 6.0 − 27.0 ⫾ 0.4 0.88 ⫾ 0.03 T ⬎ Tc L0 + 8.70 ⫻ 10 −2⫻ 共 / 兲共 t− t2 兲 /关 1+4 D +共t − t2 兲/ li 21/兴 2 1+ 3 1 0 គ 8.5 ⫾ 0.4 2.2 ⫾ 0.3 7.7 ⫾ 1 1.48 4.08 1.9 ⫾ 0.3 2+ 5 1 0 គ 8.5 ⫾ 0.3 0.8 ⫾ 0.1 8.9 ⫾ 2 2.04 2.96 3 ⫾ 1 3+ 4 7គ 11.9 ⫾ 0.07 2.9 ⫾ 1 4.6 ⫾ 0.2 1.77 4.08 1.13 ⫾ 0.05 4+ 7 5គ 9.3 ⫾ 1.2 1.1 ⫾ 0.5 6.7 ⫾ 3 2.52 4.08 1.64 ⫾ 0.7
LACAZE et al. PHYSICAL REVIEW E 82, 041606共2010兲
B. Evolution above Tc
When the temperature is set back to Ti共t larger than tII兲,
the peaked shapes of the structure factors around a kmvalue
are preserved for some time, as well as the decrease of km
with time. This behavior means that the domains are still growing. As diffusion now acts to dissolve the domains, the origin of the coarsening can only be found in the persistence of capillary flows and then shows the preservation of surface tension. However, the surface tension must decrease with time since diffusion thickens the domain interfaces and low-ers the concentration of the phases. When plotted together, one can observe a modification in the behavior of Lm共t兲
be-tween the two-phase and one-phase regions. Similarly, the scaling of the structure factor关F共x兲⬃const兴 is also preserved for about 20 s 关Fig. 2共b兲兴, and a progressive breaking of scaling occurs with time. This phenomenon is very progres-sive and corresponds also to the modification of the Lm
evo-lution关Fig.3兴.
In agreement with the expectation that the coarsening in the monophasic region is due to a transient surface tension, we assume the Lmevolution above Tc, Lm
+
, to be similar to Eq. 共9兲, but without the first diffusive term as discussed
above, Lm + = L0+ b
冉
+共t兲 冊
共t − t2兲, 共10兲where+共t兲 represents the transient surface tension that we analyze below and t2is the time when the temperature in the
sample returns to Ti. In the following, we propose a model
that fits the data of the evolution of+共t兲 共Figs.3and4兲. L 0
is the pattern wavelength reached at time t2. Note that the b value has no reason to be equal to the previous value of 8.70⫻10−2, which has been determined in the two-phase re-gion. 5x10⁻⁶ 1x10⁻⁵ 1.5x10⁻⁵ 2x10⁻⁵ 2.5x10⁻⁵ -20 0 20 40 60 80
L
m(m
)
t (s)
(-3 mK) (+3 mK)(a)
6x10⁻⁶ 8x10⁻⁶ 1x10⁻⁵ 1.2x10⁻⁵ 1.4x10⁻⁵ 1.6x10⁻⁵ 1.8x10⁻⁵ -20 0 20 40 60 80L
m(m
)
t (s)
(+5 mK)(b)
(-5 mK) 6x10⁻⁶ 8x10⁻⁶ 1x10⁻⁵ 1.2x10⁻⁵ 1.4x10⁻⁵ 1.6x10⁻⁵ 1.8x10⁻⁵ 2x10⁻⁵ 2.2x10⁻⁵ -20 -10 0 10 20 30 40 50 60t (s)
(+7 mK)(d)
(-3 mK)L
m(m
)
8x10⁻⁶ 1x10⁻⁵ 1.2x10⁻⁵ 1.4x10⁻⁵ 1.6x10⁻⁵ 1.8x10⁻⁵ 2x10⁻⁵ 2.2x10⁻⁵ -20 0 20 40 60 80L
m(m
)
t (s)
(+4 mK)(c)
(-3 mK)FIG. 3. Evolution of the typical domain length scale for two double-quench experiments:共a兲 共+3,−3,+3兲 mK performed at time tI=
−40 s,共b兲 共+5,−5,+5兲 mK performed at time tI= −40 s,共c兲 共+3,−3,+4兲 mK performed at time tI= −40 s,共d兲 共+3,−3,+7兲 mK performed
at time tI= −40 s. T⬍Tc共gray triangles downward兲: fit to Eq. 共9兲 共gray curve兲. T⬎Tc共black triangles upward兲: fit to Eq. 共17兲 共black curve兲.
C. Surface-tension evolution
The surface-tension evolution can be calculated within an approach derived from statistical mechanics adapted to a pla-nar interface 关4兴. The surface tension is derived from the
expression of the pressure tensor given by Irving and Kirk-wood 关28兴 within an approximation of small concentration
gradients. The surface tension can then be written as 关4兴
= c
冕
冉
d⌽ dz冊
2
dz, 共11兲
where c = n2关c
11+ c22− c12兴, with n as the total density of the
mixture and c␣=
冉
2 15冊
冕
s 3冉
du␣ ds冊
共s兲g␣共s兲d 3s, 共12兲where u␣共s兲 is the pair potential between particles of com-ponents ␣ and  separated by s, and g␣共s兲, the pair-correlation function. ⌽共z兲 corresponds to the mole fraction profile across the interface and is given by
⌽共z兲 = 1/2关共⌽1+⌽2兲 − 共⌽1−⌽2兲f共z兲兴, 共13兲
where⌽1,2are the molar fraction of phases 1 and 2,
respec-tively, and f共z兲 a function approaching ⫾1 when z, the nor-mal coordinate to the interface, approaches⫾⬁. An excellent approximation is to consider the interface profile as arising from a time average of capillary waves since this profile was successfully compared to reflectivity measurements 关29,30兴:
f共z兲=erf共
冑
z/li兲. The interface thickness liat T⬍Tcwasde-termined to be li⬇16− in order to reproduce experimental
data. In the framework of local equilibrium, we make the assumption that the time evolution at TiⱖTcis described by
a widening of the interface thickness l共t兲 by diffusion, the
concentration profile keeping the error function dependence f共z兲=erf关
冑
z/li共t兲兴. The profile now verifies a diffusionequation with a diffusion coefficient D+= kBT/6+共Ti兲,
f˙ = D+2f/z2, 共14兲 and one finds
l2共t兲 = 4D+t + li2. 共15兲
Note that this diffusion equation is an approximation since close to the critical point the real dynamical equation should stem from a time-dependent Ginzburg-Landau equation de-rived from the free energy. However, its derivation is quite beyond the scope of the present paper. Then, the surface-tension evolution for TiⱖTc,+共t兲, can be calculated, thanks
to Eq.共11兲, with t becoming t−t2,
+共t兲 =
冑
1 +4D + li2 共t − t2兲 . 共16兲The prefactor of the surface tension,, is identified with the surface tension at the temperature reached before quench-ing up, expected to be close tofitreached below Tcand liis
the interfacial thickness at the same temperature.
Equation共16兲 is only valid for t⬎t2and, once introduced in Eq.共10兲, gives a proper fitting function for Lm,
Lm= L0+ b
冉
冊
t − t2冑
1 +4D + li 2 共t − t2兲 . 共17兲Note that, contrary to li, Lmis still a growing function of time
since the latter quantity obeys a hydrodynamic equation and 6x10⁻⁹ 8x10⁻⁹ 1x10⁻⁸ 1.2x10⁻⁸ 1.4x10⁻⁸ 1.6x10⁻⁸ -20 0 20 40 60 80 (+3 mK) (-3 mK) σ + (Nm -1 ) t (s) (a) 5x10⁻⁹ 6x10⁻⁹ 7x10⁻⁹ 8x10⁻⁹ 9x10⁻⁹ 1x10⁻⁸ 1.1x10⁻⁸ -20 0 20 40 60 80 (+5 mK) (-5 mK) σ + (Nm -1 ) t (s) (b) t (s) 5x10⁻⁹ 6x10⁻⁹ 7x10⁻⁹ 8x10⁻⁹ 9x10⁻⁹ 1x10⁻⁸ 1.1x10⁻⁸ 1.2x10⁻⁸ -20 -10 0 10 20 30 40 50 60 (+4 mK) (-3 mK) σ + (Nm -1 ) (c) 8x10⁻⁹ 9x10⁻⁹ 1x10⁻⁸ 1.1x10⁻⁸ 1.2x10⁻⁸ 1.3x10⁻⁸ 1.4x10⁻⁸ -20 -10 0 10 20 30 40 50 (+7 mK) (-3 mK) σ + (Nm -1 ) t (s) (d)
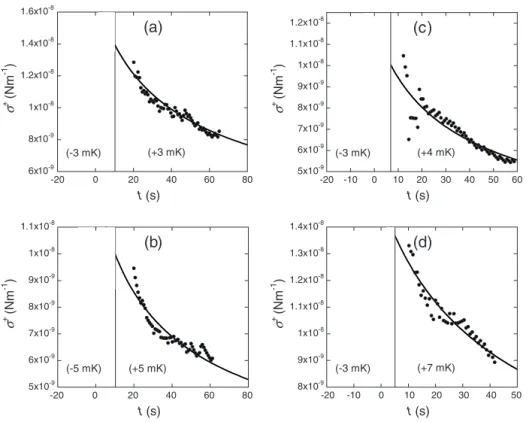
FIG. 4. Corresponding
de-crease of the surface tension with time for the four evolutions
de-picted in Figs. 3共a兲–3共d兲,
respec-tively. Full line: fit to Eq.共18兲.
LACAZE et al. PHYSICAL REVIEW E 82, 041606共2010兲
not a diffusive one as li. Of course, Lm will lose its one
dimension meaning at times longer than the ones under study, when concentration profiles mix with each other. Here, li corresponds to the thickness of the domain interfaces at
time t2and should be compared to 16−. The best fits共Fig.3兲
are found with an imposed t2 between 5 and 10 s共in
agree-ment with what is known about thermal evolution for an upward quench兲 and L0, , and li left free. The values are
reported in TableI共lower row兲. For these fits, we decided to
set b = 8.7⫻10−2 determined for the two-phase region. As
noted above, the uncertainty in b prevents us from drawing any precise conclusions from the obtained values offit. We
note that they are slightly higher than the determined fit
values in the two-phase region which means that b could be somewhat higher in the one-phase region. About li, the
val-ues are somewhat larger but fully compatible with the ex-pected values at the one-phase temperatures. This slight dis-agreement can be due to two distinct factors. The first one concerns the oversimplifications made in the modeling of the surface-tension evolution. The second one—probably the most important one—is the widening of l共t兲 between tIIand
t2since the upward quench takes some time to be completed.
However, the consistency of the fit parameters validates our procedure, which is indeed accurately controlled in time and temperature and amenable to a quantitative analysis.
In order to make apparent the evolution of the surface tension during remixing, we have plotted in Figs.4the tran-sient surface tension as deduced from Eq. 共10兲; it fits to
+共t兲 = fit
冑
1 +4D+
li,fit2 共t − t2兲
. 共18兲
The data show clearly the decrease of the surface tension with time. Comparable evolutions were already reported, and it is interesting to compare these previous findings with the present results. In Ref.关10兴, the same IW mixture was
inves-tigated by measuring the surface tension by the spinning drop method. The time evolution of /⌬ in the one-phase region, where ⌬ is the density difference between the two miscible phases, was found to follow a nonmonotonous de-crease, exhibiting a local maximum at some time. This
pe-culiar behavior was attributed to the coupled evolution of the surface tension and the density difference. In Ref.关13兴,
sur-face tensions of several 10−7 N/m were found,
correspond-ing to a much larger distance to the critical point than in our experiment where ⬇10−9 N/m. Fits of the Ref. 关13兴
re-sults to a diffusion equation lead to diffusion coefficient sev-eral orders of magnitude lower than expected at those tem-peratures. In Ref.关14兴, the nonequilibrium bulk fluctuations
were taken into account for properly isolating the interface scattering signal. Surface-tension variations were detected at a distance from the critical point even larger than in Ref. 关13兴. The reported variations span a large range between 3
⫻10−5 and 3⫻10−7 N/m but no quantitative analysis was
reported. In the latter two cases, because large temperature steps were performed between the two-phase and the one-phase regions, a large uncertainty is likely to reside in the time where the system becomes monophasic. In contrast, since our experiment involves only minute temperature steps, the determination of this latter time is in agreement with thermal behaviors. This explains why our experiments can be analyzed within the local equilibrium hypothesis, which makes quantitative the diffusive analysis that we have presented.
V. CONCLUSION
This study was performed with a partially miscible den-sity matched binary liquid in the close vicinity of its critical point where dynamics is largely slowed down. It unambigu-ously shows the existence of a transient nonzero surface ten-sion between miscible fluids. The surface-tenten-sion relaxation can be convincingly represented by a simple model of inter-face diffusion and local equilibrium. It then follows that the use of a dynamic surface-tension term in the fluid mechanics of miscible phases is fully justified.
ACKNOWLEDGMENTS
Centre National d’Etudes Spatiales in France is acknowl-edged for a partial financial support. We warmly thank Marc Robert for fruitful discussions and a critical reading of the paper.
关1兴 P. Petijeans, C. R. Acad. Sci., Paris, t 325, Ser. II 86, 587 共1996兲.
关2兴 R. J. Hunter, Foundations of Colloid Science 共Oxford
Univer-sity Press, New York, 1987兲, pp. 234–237.
关3兴 J. S. Rowlinson and B. Widom, Molecular Theory of
Capillar-ity共Oxford University Press, Oxford, 1982兲.
关4兴 H. T. Davis, Numerical Simulation and Oil Recovery 共Springer-Verlag, Berlin, 1988兲, pp. 105–110.
关5兴 D. Korteweg, Arch. Néerl. Sci. Ex. Nat., Série II 6, 1 共1901兲.
关6兴 X. F. Liu, E. George, W. G. Bo, and J. Glimm,Phys. Rev. E
73, 056301共2006兲.
关7兴 C.-Y. Chen, C.-W. Huang, H. Gadelha, and J. A. Miranda,
Phys. Rev. E 78, 016306共2008兲.
关8兴 J. E. Mungall,Phys. Rev. Lett. 73, 288共1994兲.
关9兴 B. Zoltowski, Y. Chekanov, J. Masere, J. A. Pojman, and V.
Volpert,Langmuir 23, 5522共2007兲.
关10兴 J. A. Pojman, C. Whitmore, M. L. T. Liveri, R. Lombardo, J.
Marszalek, R. Parker, and B. Zoltowski, Langmuir 22, 2569
共2006兲.
关11兴 G. Viner and J. Pojman,Opt. Lasers Eng. 46, 893共2008兲.
关12兴 N. Bessonov, J. A. Pojman, G. Viner, V. Volpert, and B.
Zol-towski,Math. Model. Nat. Phenom. 3, 108共2008兲.
关13兴 S. E. May and J. V. Maher,Phys. Rev. Lett. 67, 2013共1991兲.
关14兴 P. Cicuta, A. Vailati, and M. Giglio, Appl. Opt. 40, 4140
共2001兲.
Press, Cambridge, 2002兲, pp. 421–425.
关16兴 E. D. Siggia,Phys. Rev. A 20, 595共1979兲.
关17兴 P. Guenoun, R. Gastaud, F. Perrot, and D. Beysens,Phys. Rev.
A 36, 4876共1987兲.
关18兴 A. Kumar, H. R. Krishnamurthy, and E. S. R. Gopal, Phys.
Rep. 98, 57共1983兲.
关19兴 F. Kammoun, J. P. Astruc, D. Beysens, P. Hede, and P.
Gue-noun,Rev. Sci. Instrum. 63, 3659共1992兲.
关20兴 D. Beysens and A. Bourgou,Phys. Rev. A 19, 2407共1979兲.
关21兴 A. Thill, S. Désert, and M. Delsanti,Eur. Phys. J.: Appl. Phys.
17, 201共2002兲.
关22兴 D. Beysens, A. Bourgou, and G. Paladin, Phys. Rev. A 30,
2686共1984兲.
关23兴 V. S. Nikolayev, D. Beysens, and P. Guenoun,Phys. Rev. Lett.
76, 3144共1996兲.
关24兴 H. Furukawa,Adv. Phys. 34, 703共1985兲.
关25兴 M. R. Moldover,Phys. Rev. A 31, 1022共1985兲.
关26兴 S. C. Greer,Phys. Rev. A 14, 1770共1976兲.
关27兴 D. Beysens, Microgravity Q. 5, 34 共1995兲.
关28兴 J. H. Irving and J. G. Kirkwood, J. Chem. Phys. 18, 817
共1950兲.
关29兴 D. Beysens and M. Robert,J. Chem. Phys. 87, 3056共1987兲.;
93, 6911共1990兲.
关30兴 F. P. Buff, R. A. Lovett, and F. H. Stillinger,Phys. Rev. Lett.
15, 621共1965兲.
LACAZE et al. PHYSICAL REVIEW E 82, 041606共2010兲