READ THESE TERMS AND CONDITIONS CAREFULLY BEFORE USING THIS WEBSITE.
https://nrc-publications.canada.ca/eng/copyright
Vous avez des questions? Nous pouvons vous aider. Pour communiquer directement avec un auteur, consultez la première page de la revue dans laquelle son article a été publié afin de trouver ses coordonnées. Si vous n’arrivez pas à les repérer, communiquez avec nous à PublicationsArchive-ArchivesPublications@nrc-cnrc.gc.ca.
Questions? Contact the NRC Publications Archive team at
PublicationsArchive-ArchivesPublications@nrc-cnrc.gc.ca. If you wish to email the authors directly, please see the first page of the publication for their contact information.
NRC Publications Archive
Archives des publications du CNRC
This publication could be one of several versions: author’s original, accepted manuscript or the publisher’s version. / La version de cette publication peut être l’une des suivantes : la version prépublication de l’auteur, la version acceptée du manuscrit ou la version de l’éditeur.
Access and use of this website and the material on it are subject to the Terms and Conditions set forth at
Upscaling of material emissions: comparison of small and full-scale chamber results and evaluation of an IAQ simulation model
Biesenthal, T. A.; Magee, R. J.; Bodalal, A.; Lusztyk, E.; Brouzes, M. A.; Nong, G.; Shaw, C. Y.
https://publications-cnrc.canada.ca/fra/droits
L’accès à ce site Web et l’utilisation de son contenu sont assujettis aux conditions présentées dans le site LISEZ CES CONDITIONS ATTENTIVEMENT AVANT D’UTILISER CE SITE WEB.
NRC Publications Record / Notice d'Archives des publications de CNRC: https://nrc-publications.canada.ca/eng/view/object/?id=5448ec39-1bf0-4568-a468-f3c6ee6d0240 https://publications-cnrc.canada.ca/fra/voir/objet/?id=5448ec39-1bf0-4568-a468-f3c6ee6d0240
Upscaling of material emissions: comparison of small and full-scale chamber results and evaluation of an IAQ simulation model
Biesenthal, T.A.; Magee, R.J.; Bodalal, A.;
Lusztyk, E.; Brouzes, M.A.; Nong, G.; Shaw, C.Y.
A version of this paper is published in / Une version de ce document se trouve dans:
Indoor Air 2002 Conference, Monterey, CA., U.S.A., 30 June - 5 July 2002, pp. 1-6
www.nrc.ca/irc/ircpubs
UPSCALING OF MATERIAL EMISSIONS: COMPARISON OF
SMALL AND FULL-SCALE CHAMBER RESULTS AND
EVALUATION OF AN IAQ SIMULATION MODEL
TA Biesenthal∗, RJ Magee, A Bodalal, E Lusztyk, M Brouzes, G Nong, and CY Shaw
Indoor Environment Program, Institute for Research in Construction, National Research Council of Canada
ABSTRACT
The emission rates of selected volatile organic compounds (VOCs) were determined for a series of building materials. Those same building materials were used to construct scaled-down ("mock-up") versions of the primary emitting surfaces from a recently constructed research house. The mock-up version of the house materials (including a painted wall assembly and a flooring assembly) was
assembled in a full-scale (55 m3) stainless steel chamber and the VOC concentrations were
measured under standard conditions. A single zone model was used to simulate the concentrations during the mock-up experiments, based on the emission rates determined from the small chamber tests. The agreement between the predicted and observed concentrations was examined in detail, and in most cases the deviations can be attributed to the effects of unquantified sinks and sometimes unquantified sources.
INDEX TERMS
VOCs, Chamber tests, Modeling pollutant concentrations, Laboratory experiments.
INTRODUCTION
The importance of VOCs to indoor air quality has been recognized for some time and a great deal of effort has been invested in trying to determining the VOC emission rates from many different materials in the indoor environment. One of the approaches often taken in this task is small chamber testing. However, it is extremely difficult to relate small chamber emission testing results to VOC concentrations in real indoor environments. One useful tool to address this difficulty is computer simulation, but there are significant challenges in both modelling the emissions and upscaling them to building dimensions, not to mention complications such as sink effects and varying environmental and material conditions.
The construction of a pair of research houses presented an excellent opportunity to investigate the usefulness of small chamber tests in predicting real house concentrations via computer simulation (Magee et al., 2002). This paper presents the results of a simpler, intermediate goal: to use small chamber tests to predict the concentrations in a full-scale chamber containing a scaled-down portion of the research houses. The Material Emission DataBase - Indoor Air Quality simulation program (MEDB-IAQ) was used to predict the observed VOC concentrations during the mock-up tests. MEDB-IAQ was developed at the National Research Council of Canada and includes a database of VOC emissions from various building materials combined with a single-zone model to predict VOC
concentrations (Zhang et al., 1999). The aim of this part of the study was to evaluate the
performance of the simulation program and identify potential problems with upscaling of the small chamber tests to more appropriate dimensions and conditions. Although the simulation program predicted most VOC concentration trends reasonably well during the mock-up tests, there were some significant deviations. These are attributed to several main causes: unaccounted-for sinks, unaccounted-for sources, and possibly unrepresentative samples.
METHODS
Full-scale chamber tests
The VOC emissions of scaled-down ("mock-up") versions of selected surfaces in the research
houses were examined in a full-scale stainless steel chamber (55 m3; 5 x 4 x 2.75 m) at 23 °C and
50 % relative humidity. The performance of this chamber has been described previously (Zhang et al., 1996). The materials used in the mock-up tests typically accounted for the largest surface areas in the houses and formed two main systems: a wall assembly consisting of primed and painted (both water-based) drywall on white pine studs, and a floor assembly of carpet, underpad, and oriented-strandboard (OSB) subfloor on engineered I-beam joists (OSB and pine). A small sample of particleboard was also included in the mock-up to represent the exposed particleboard surfaces on the basement stairs of the house. The materials used in the experiments were the same as those used in the construction of the houses, and were obtained from the same suppliers.
Two full-scale mock up experiments were performed. Each test had several phases; the wall assembly was always present, but the floor assembly was added and removed at various times through the course of the experiment (see Figures 1-3 for timing of phases). The air change rate was
0.25 h-1 and 0.5 h-1 in Mock-ups 1 and 2 respectively. In both experiments, the drywall panels were
primed and painted outside the chamber and added to the chamber after a drying period (48 hours in Mock-up 1 and 24 hours in Mock-up 2). The scaled-down surface areas used in the chamber were determined by considering the surface areas and air change rates in the research house and the volume of both the house and the full-scale chamber.
Small chamber tests
A total of 12 different materials that were used in the construction of the research houses were tested for VOC emissions in small (50 L) chambers under standard environmental conditions (23.0±0.5 °C; 50±2% relative humidity; 1 air change per hour (ACH)), using standard protocols (ASTM, 1997; Zhu et al., 1998) . The test specimens were collected directly from the construction site. For the purposes of this paper, the individual emission test data from the 6 materials making up the floor and wall assemblies from the mock-up experiments were examined (carpet, underpad, OSB, engineered wood I-beam, particleboard, and an assembly of paint-primer-drywall).
VOC sampling and analysis
During the chamber experiments, air samples were collected by drawing chamber air through multisorbent cartridges (Carbotrap 300, Supelco). These cartridges were subsequently thermally desorbed (ATD400, Perkin Elmer) and analyzed by GC/MS (HP5890/HP5989, Hewlett Packard). For the mock-up experiments, 25-40 VOCs were typically identified in the samples, accounting for approximately 75% of the total chromatogram peak areas. For the small chamber tests on individual materials, 10-20 different compounds were typically identified. However, in all experiments only a
subset of the identified VOCs (~4-6 per sample) were quantified in every sample; quantification was done using either a direct calibration standard of the relevant compounds or using the response factor of a similar species. The quantified VOCs for the mock-up experiments included VOCs which could be used as markers of the individual materials in the chamber: hexanal, a-pinene, and limonene (wood-based products); 4-phenylcyclohexene (4-PC) (carpet); and 2,2,4-trimethyl-1,3-pentanediol isobutyrate (two isomers: Texanol I and II) (water-based paints and primers). For this paper, emissions of only these VOCs are discussed. Total VOC concentrations were also calculated. In the context of this experiment, TVOC refers to the sum of the chromatographic peak areas between 5 and 40 minutes, calculated as a toluene-equivalent concentration.
RESULTS
The emission data from the small chamber tests were used to fit semi-empirical models describing their emission behaviour. For the painted wall assembly, the initial evaporative phase was fit according to the vapour pressure-boundary layer model described by Guo and Tichenor (1992). After 24 hours, and for all dry products, an empirical 2-parameter power law model was fit to the data. Because of the design of the mock-up experiments (using dry, painted drywall), only the period from 24h on is relevant to this paper.
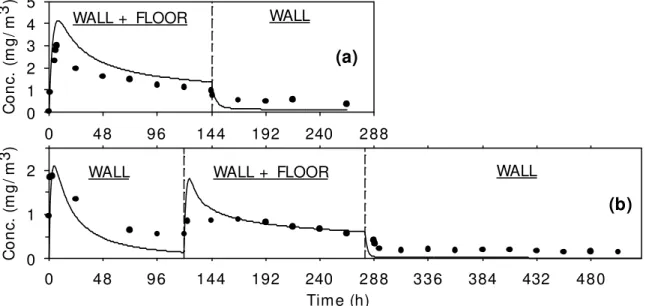
The full-scale chamber concentrations of TVOC during both mock-up experiments are shown in Figure 1. Mock-up 1 was characterized by relatively high initial TVOC levels which decrease slightly upon removal of the floor assembly. Mock-up 2 had lower initial TVOC concentrations, as expected with a two-fold increase in air change rate, and exhibited an increase in TVOC
concentrations when the floor assembly was added. In general, the simulated TVOC concentrations agreed reasonably well with the observed data, but with some noteworthy exceptions.
Tim e (h) 0 48 96 144 192 240 288 336 384 432 480 C o n c . (m g / m 3) 0 1 2 (b) WALL WALL + FLOOR WALL 0 48 96 144 192 240 288 C o n c . (m g / m 3) 0 1 2 3 4 5
WALL + FLOOR WALL
(a)
Figure 1. TVOC concentrations (circles) in the full-scale chamber during the Mock-up 1 (a) and Mock-up 2 (b) tests. The solid lines shows the predicted concentrations based on the MEDB-IAQ simulation program results for each test.
In Mock-up 1, the simulation overpredicted the observed concentrations in the first part of the experiment, which suggests the presence of a sink for TVOC. In the second part of the test, the
observations were higher than the predicted values, which could be due to unaccounted-for sources in the chamber. In Mock-up 2, the concentrations were initially higher than the simulated values, again suggesting an additional source of TVOC. Upon addition of the floor the agreement was quite good, but in the last phase of the test, there again appeared to be an extra source of TVOC in the chamber that was not included in the simulation.
Although useful for an overview of the data and simulation results, an examination of TVOC does not allow one to reasonably track the origin of any disagreements between the observed data and the
simulations because all materials are sources of TVOC. Figure 2 shows the results for α-pinene. In
both mock-ups, the simulation did a poor job of predicting the observed concentrations. In theory,
the floor assembly should be the only source of α-pinene (i.e. from I-beam, particleboard) in the
mock-up tests. However, the predicted floor emissions were too high compared to the observed data in the periods when the floor assembly was in the chamber. In contrast, when the floor
assembly was not in the chamber, significant α-pinene concentrations were present. It appears that
there was another source.
Time (h) 0 4 8 9 6 1 4 4 192 240 2 8 8 336 384 4 3 2 480 C o n c . (m g / m 3) 0.0 0.2 0.4 0.6 0 4 8 9 6 1 4 4 192 240 2 8 8 C o n c . (m g / m 3) 0.0 0.2 0.4 0.6 0.8 1.0 WALL + FLOOR WALL + FLOOR WALL WALL WALL (a) (b)
Figure 2. α-Pinene concentrations (circles) in the full-scale chamber during the Mock-up 1 (a) and Mock-up 2 (b) tests. The solid lines shows the predicted concentrations based on the MEDB-IAQ simulation program results for each test.
Re-emission from sinks is a possibility, but that cannot account for the large initial concentrations observed in the beginning of Mock-up 2 with only the painted wall present. Another likely source is the stud wall used to support the painted drywall assembly. Although efforts were made to isolate the pine studs from the chamber (including wrapping exposed parts with aluminum foil, and sealing the spaces between the studs and the chamber walls with partially filled Tedlar bags), the data
indicates that isolation was not complete. Based on previously determined α-pinene emission rates
from pine lumber, the concentrations observed correspond to approx. 10% of the stud wall surface
area being exposed. The dominant source of α-pinene from the floor assembly is the spruce-pine-fir
(SPF) chords of the I-beam, although the magnitude of that source appears to be lower than that predicted by the small chamber tests: adding the floor assembly to the chamber in Mock-up 2 had little impact on the chamber concentrations.
Another compound with wood-based sources is hexanal. In this case, the agreement with the
simulated data was quite reasonable (data not shown). In contrast with α-pinene, hexanal has
primarily engineered-wood sources (OSB, particleboard) in the mock-up materials. Carpet was a unique source for 4-phenylcyclohexene (4-PC) in the experiments. Yet despite the apparent simplicity of a single source, the model predictions were about 2 times higher than the observed values in both mock-up tests (data not shown). The 4-PC emission rates determined in the carpet small chamber test were relatively low compared to others carpets examined previously, and an overprediction based on those results seems incongruous. Another explanation is that there were significant 4-PC sinks during the tests.
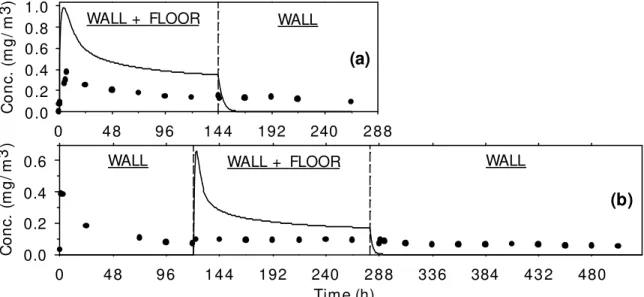
Two isomers of 2,2,4-trimethyl-1,3-pentanediol isobutyrate (referred to here as Texanol I and Texanol II) were found in small chamber tests of the painted wall assembly. The mock-up test concentrations of Texanol II are shown in Figure 3. In Mock-up 1, the difference between the simulated and observed concentrations suggests that there were some sinks present for Texanol II, which is not surprising for such a large, bulky molecule. However, Mock-up 2 gave conflicting indications of sinks: there was little change in concentration upon adding the floor assembly to the chamber, but when the floor assembly was removed, the concentration dipped as though a source had been removed. One would expect similar evidence of sink behaviour for Texanol I, but nothing was evident because the simulation tended to underpredict the observed Texanol I concentrations in the first phase of each mock-up (data not shown).
0 48 9 6 144 1 9 2 240 288 C o n c . (m g / m 3) 0.0 0.2 0.4 0.6 0.8 Tim e (h) 0 4 8 9 6 1 4 4 192 240 2 8 8 336 384 4 3 2 480 C o n c . (m g / m 3) 0.0 0.2 0.4 0.6 0.8 WALL + FLOOR WALL + FLOOR WALL WALL WALL (a) (b)
Figure 3. Texanol isomer II concentrations (circles) in the full-scale chamber during the Mock-up 1 (a) and Mock-up 2 (b) tests. The solid lines shows the predicted concentrations based on the MEDB-IAQ simulation program results for each test.
DISCUSSION
Even with a relatively simple system under controlled conditions, it is not straightforward to predict VOC concentrations. In most cases, any difference between predicted and observed data can be explained by sink effects, which are not included in the simulation program at this time. However, it is also true that the particular sample tested in the small chamber may not have been representative of the material as a whole. Some specimen-to-specimen variability is expected in most cases, even
with the most careful sample preparation and handling procedures. In this case, samples were collected directly from the construction site (to ensure they were the same materials that went into building the houses), where they could have been subject to contamination from any number of sources. Also, the mock-up materials were purchased later and could have had a much different history, although they were from the same supplier. Factors such as these could all have contributed to poor simulation results. However, since neither the sink effect nor the sample representativeness is known, it is difficult to know whether a given discrepancy is due to an unrepresentative sample or to an unrecognized sink. Unknown sources present an entirely different problem (as evidenced by the apparent leakage from the stud walls), and real buildings are full of such obscure sources.
CONCLUSION AND IMPLICATIONS
The focus of a great deal of the work done on indoor VOCs is on source characterization. While this is undoubtably important, it is just as critical to understand what happens to these VOCs once they are emitted to be able to draw any conclusions about possible impacts on indoor VOC concentrations. Even in very simple cases, the knowledge of sinks (e.g. reversible/irreversible adsorption, ozonolysis) will likely dictate the success of using emission tests to predict VOC concentrations, as will a good understanding of the representativeness of a particular specimen.
ACKNOWLEDGEMENTS
The authors would like to thank Jianshun Zhang for his contributions as original project manager for this work and both he and Dan Sander for their work on MEDB-IAQ. This project was financially supported by Natural Resources Canada, the Canadian Mortgage and Housing Corporation, and the Canadian Centre for Housing Technology.
REFERENCES
ASTM. 1997. ASTM Standard D5516-97, Standard Guide for Small-Scale Environmental Chamber Determinations of Organic Emissions From Indoor Materials/Products, West Conshohocken: American Society for Testing and Materials.
Guo Z, and Tichenor BA. 1992, Fundamental mass transfer models applied to evaluating the emissions of vapor-phase organics from interior architectural coatings, Proceedings of the EPA/AWMA Indoor Air Quality Symposium. Durham, NC.
Magee RJ, Bodalal A, Biesenthal TA, et al. 2002. Prediction of VOC concentration profiles in a newly constructed house using small chamber data and an IAQ simulation program,
Proceedings of The 9th International Conference on Indoor Air Quality and Climate -Indoor Air 2002. Monterey, CA: -Indoor Air 2002.
Zhang JS, Kanabus-Kaminska JM, Shaw CY, et al. 1996. Performance evaluation of a full-scale chamber for material emission tests and studies, Proceedings of The 7th International Conference on Indoor Air Quality and Climate - Indoor Air '96, Vol 3, pp. 373-378. Nagoya: Indoor Air '96.
Zhang JS, Zhu JP, Magee RJ. 1999. A Database of VOC emissions from building materials, Proceedings of the First NSF International Conference on Indoor Air Health, Vol 1, pp 87-96, Denver, Colorado.
Zhu JP, Zhang JS, Lusztyk E, et al. 1998. Measurements of VOC emissions from three building materials using small environmental chamber under defined standard test conditions, Air & Waste Management Association 91st Annual Meeting & Exhibition, San Diego, CA.