Publisher’s version / Version de l'éditeur:
Vous avez des questions? Nous pouvons vous aider. Pour communiquer directement avec un auteur, consultez la première page de la revue dans laquelle son article a été publié afin de trouver ses coordonnées. Si vous n’arrivez pas à les repérer, communiquez avec nous à PublicationsArchive-ArchivesPublications@nrc-cnrc.gc.ca.
Questions? Contact the NRC Publications Archive team at
PublicationsArchive-ArchivesPublications@nrc-cnrc.gc.ca. If you wish to email the authors directly, please see the first page of the publication for their contact information.
https://publications-cnrc.canada.ca/fra/droits
L’accès à ce site Web et l’utilisation de son contenu sont assujettis aux conditions présentées dans le site LISEZ CES CONDITIONS ATTENTIVEMENT AVANT D’UTILISER CE SITE WEB.
Internal Report (National Research Council of Canada. Institute for Research in Construction), 1997-11-01
READ THESE TERMS AND CONDITIONS CAREFULLY BEFORE USING THIS WEBSITE.
https://nrc-publications.canada.ca/eng/copyright
NRC Publications Archive Record / Notice des Archives des publications du CNRC :
https://nrc-publications.canada.ca/eng/view/object/?id=530911f1-a7ab-4e51-bc63-0e8e86cf6411 https://publications-cnrc.canada.ca/fra/voir/objet/?id=530911f1-a7ab-4e51-bc63-0e8e86cf6411
NRC Publications Archive
Archives des publications du CNRC
For the publisher’s version, please access the DOI link below./ Pour consulter la version de l’éditeur, utilisez le lien DOI ci-dessous.
https://doi.org/10.4224/20338000
Access and use of this website and the material on it are subject to the Terms and Conditions set forth at
A Review of Volatile Organics Emission Data for Building Materials and Furnishings
A Review of Volatile Organics
Emission Data for Building
Materials and Furnishings
Irlternal report (Institute 1 by Y. An, J.S. Zhang and C.Y. Shaw ~ O N A L Y S E
Internal Report No. IRC-IR-750
Date of issue: November 1997
CISTI/ICIST NRC/CNRC
IP,C S e r
Received on: 12-16-97 Internal repart.
This internal report, white not intended for general distribution, may be cited or referenced in other publications.
A
Review of Volatile Organics Emission Data
for Building Materials and Furnishings
Y.
An, J. S. Zhang andC.
Y.
ShawABSTRACT
Published emission data of volatile organic compounds (VOCs) from building materials and furnishings are reviewed. The building materials and furnishings reviewed include coating materials (i.e., wood stain, varnish, wax, and paint), installation materials (i.e., adhesive and caulking), wood products, vinyl coverings, linoleum, and carpets. These emission data are summarized in tables and analyzed systematically. The emission data of the same type materials from different laboratories are compared. The emission characteristics and emission range of individual materials are given.
IRCNRC CMEIAQ: Report 4.1 (08197)
1. INTRODUCTION
Building materials have been recognized as one of the major sources of volatile organic compounds (VOCs) in indoor environments. Reliable emission data are needed for selecting building materials to control the
VOC
level indoors. In this report, published emission data were evaluated. Data included in this report are those obtained by using well documented testing methods and procedures under typical indoor environmental conditions.2. METHODS OF EVALUATION
AND
REPORTING2.1 Criteria
Emission data obtained from laboratory emission cells (FLEC), small chambers, full- scale chambers, and test buildings were reviewed. The operating conditions of these test apparatus and facilities are shown in Table 2.1.
Table 2.1 Range of Operating Conditions of the Test Apparatus and Facilities
The two criteria used to screen the published emission data are methods and procedures used to collect and prepare the samples and the adequacy of the documented test conditions and results. For new material samples, the required information includes the shipping and storage procedures, the shipment date, package and storage duration. For used material samples, a description of the usage history is required. For wet material samples, the specimen description includes substrate preparation, application method, specimen size (or loading factor), amount applied per unit surface area, and elapsed time before placed in the chamber. For dry materials, the information includes specimen size (or loading factor) and edge sealing method.
Chamber FLEC
Small Full-scale
2.2 Presentation of data
Data expressed in terms of both numbers and graphs are accepted and included in this report. Systematic names according to Chemical Abstracts (CA) are used for VOCs. The emission data in this report are expressed in the following units. Appropriate conversion was made when unit in the original literature was different.
Vdwne (m 0.00M)35 0.003
-
1 20-
30 Concentration: mglm:; Emission factor: m m h ; Rate constant: h‘f
,
Elapsed time: h.Air change rate -1 171
-
200 0 5 - 4 0.5-
2 Air velocity (cmls) 350-1400 0 - 2 5 0 0 - 100 Humidity (46) 40-60 40-60 40-60 TemperahweCC)
20-
25 20-
25 20-25JRUNRC CMEIAQ: Report 4.1 (08197)
Testing periods used in previous works often differ from each other. In order to facilitate analysis and comparison of the emission data, the technique of interpolation or extrapolation was used to calculate the emission factors at t = 0,24 h (1 day), 168 h (7 day) and 720 h (30 day), when appropriate. Interpolations of the data using the models that were given in the original paper were made to fit the measured data (e.g., the fmt order decay model). Extrapolations of the data were made only when the extrapolated period is less than 113 of the measured period. Interpolated or extrapolated emission factors are denoted as
E*,
E@m, orE@7m.
Unless specifically noted, the time zero in this review is defined as the start of the dynamic chamber testing, i.e., when the chamber door is closed after the specimen is placed in the chamber and the chamber is operated at the testing
air
change rate. When the test procedure included the pre-conditioning, the preconditioning time period was identified ast.
In this report, t, for "wet" materials is the time between the application and the start of the dynamic test (i.e., the time zero). For dry materials,t
is the time between unpacking the sample and the start of the dynamic test.2.3 Report of Results
For each material, the following results are reported:
VOCs identified and their headspace concentrations (if available); A brief description of emission characteristics;
Measured emission factors which are defined as the emission factors measured (or
interpolatedlextrapolated based on the measured data) at 0.24.168, and 720h after time
zero;
8 Models used, their coefficients, and the time period t in which the models are valid,
based on the experimental data;
Effects of sample preparation and test conditions (e.g., air change rate and
RH)
on emissions, if investigated,The results were grouped
as
follows:Grouu 1. "Wet" individual coatin~ materials. Materials belong to this group include: wood stains, varnishes, paints, wax. These materials are applied "wet" on a substrate. Theii emission characteristics are therefore dependent on both the coating materials themselves and the substrate used. VOC emissions from the "wet" coating materials can generally be divided into
two periods (e.g., Tichenor, 1987, Chang and Guo, 1992, Wies et al., 1996, and Zhang et al., 1996): (1) an initial period (drying period) in which the emission rate is high, but decreases quickly with time; (2) a later period (after the surface become dry or a thin film is formed) in which the emission rate is low and it decreases slowly with time. During the first period of the emission, the emission is primarily controlled by the interfacial evaporative mass transfer process, while in the second period by the VOC diffusion through the material (internal diffusion).
IRUNRC CMEIAQ: Report 4.1 (08197)
Group 2. 'Wet" individual installation materials. This group includes materials such as adhesives, caulk and sealant, and varieties of joint, patching and texturing compounds. These materials may have similar emission profiles as that of "wet" individual coating materials, but their time scales for the internal emission process are expected to be larger due to the relative "thicker layer" and slower drying process.
Group 3. Drv individual materials. This group includes the majority of materials used to construct and furnish residential and commercial buildings, such as carpets, gypsum wallboards, particleboard, oriented strand board (OSB), vinyl flooring materials, ceiling tiles, fabrics, etc..
VOC
emissions from these materials are generally characterized by nearly constant or very slowly decaying emission rates.Group 4: Material svstemslassemblies. In practice, different individual materials are usually used together to form material systemslassemblies such as:
carpet I1 adhesive I1 concrete;
paint N gypsum board 11 vapor barrier; carpet I1 underpad I/ plywood I1 wood joists; wax I1 vinyl sheet 11 adhesive I1 concrete;
polyurethane floor vanish I/ wood stain I1 hard wood 11 plywood 11 wood joists; etc.. 2.3 List of Nomenclature C,: C,: EF: EFo: EFlst: EFznd: EF,:
Sample surface area (m2);
VOC
concentration (mg/m3) in chamber air;Maximum concentration in chamber during dynamic test (mg/m3);
Initial
VOC
concentration at the material surface in mass transfer model (mg/m3);Nominal emission factor (mg/m2h) at time t;
Nominal emission factor (mg/m2h) at time of starting chamber test; First phase emission factor in double-exponential model (mg/m2h); Second phase emission factor in doubleexponential model (mg/m2h);
Nominal emission factor (mg/m2h), defined
as
the emission factor at t hour after start of the chamber testing as reported by the original author(s);Interpolated or extrapolated nominal emission factor (mg/m2h) at time t (t = 0, 24,168 or 720 hour);
Initial emission factor (mg/m2h) in the diffusion model;
Emission decay rate constant in the first-order decay model (h-'); Interfacial mass transfer coefficient (mh) in mass transfer model;
First phase emission decay rate constant in doubleexponential model (h-I); Second phase emission decay rate constant in doubleexponential model (h-I); Adsorption rate constant in sink model (mh-I);
I R W C CMEIAQ: Report 4.1 (08197) kd : kdif: Ke: ks:
L:
M:hlZ:
N:RH:
t: T: E: TVOC: U:v:
Desorption rate constant in sink model (h");
Emission decay rate constant in the diffusion model (m-'K'); Adsorption/desorption coefficient in sink model (m),
K
=k$kd;
Rate decay constant at the material surface in mass transfer model @"); Loading factor, i.e., sample area divided by chamber volume (m21m3); Sample mass (g);
Mass per unit area in sink (mg/mZ); Air change per hour @'I);
Relative humidity (%); Test time period (h); Temperature CC);
Preconditioning time period (h);
Total VOCs identifkl and measured by GUFID or GUMS; Air velocities (mls);
Chamber volume (m3);
3. WET INDIVIDUAL COATING MATERIALS
Coating materials are essentially made of oils or resins which are dissolved in solvents. Most of the wet materials can be classified as solvent-based or water-based.
The
former indicates that organic compounds are used as solvent while the latter means that water is used as the primary solvent. VOC contents of these two types of wet materials are quite different. Solvent-based coatings normally contain 10%-
40% of VOCs (Ancona et al., 1993), while water-based coatings contain about 2%-
12% of VOCs (Jenkins et al., 1995).The
VOCs initially emitted from solvent-based coatings are mainly those in the solvents. They are different from those initially emitted from water-based coatings. The emission profdes are also quite different between the two type of coating materials. Emissions of individual coating materials will be discussed in detaiIs as follows.3.1 Wood Stains
Major VOCs emitted from wood stains were identified to be nonane, decane, undecane, dodecane and 1,2,4-trimethylbenzene (Chang and Guo, 1992b, and Zhang et al., 1996). Other VOCs identified from headspace test are 2-butanone, benzene, hexane, trirnethylhexane, and cyclodecane (Tichenor and Guo, 1991). Most of these VOCs represent the composition of mineral spirits which are the common solvents, or thinners for wood stains.
Zhang et al. (1996) reported that the TVOC equilibrium concentration measured in the headspace of a vial containing 2 ml wood stain sample was 10809 mg/m3. The measured equilibrium concentrations of nonane, decane, undecane, and dodecane were 2074, 1172, 21 1, and 12 mg/m3, respectively. These equilibrium concentrations correlate to the volatility of the corresponding compounds. That is, the measured concentration of a compound is directly propotional to its vapor pressure but inversely proportional to its boiling point (the vapor
I R m C CMEIAQ: Report 4.1 (08197)
pressures of nonane, decane, undecane, and dodecane, at 2 3 ' ~ and 1 atrn, are 4.6, 1.70, 0.66, and 0.27 mmHg, respectively).
Chang and Guo (1992b) proposed a double-exponential model for predicting the wood stain emission characteristics. This model suggested that the emission process consists of two phases, i.e., f m t phase emission and second phase emission. Data in Table 3.1 indicated that the emission factor and rate decay constant in the first phase emission increase with the vapor pressure of the corresponding compound. The first phase emission was thus postulated as an evaporation-contr011ed process. The rate decay constants in the second phase emission are much smaller than those in the first phase emission, and are close to those of dry materials (see chapter 5). The authors suggested that the rate decay constants in the second phase emission are related to diffusivity of the corresponding compound.
The
second phase emission was thus interpreted as a diffusion-controlled process. Furthermore, the data shown in Table 3.1 were measured at different test conditions, i.e., air change rates were from 0.36-
4.7 ACH and2 3
loading factors were from 0.1
-
1.3 m 11x1.
In general, the emission factor and rate decay constant in evaporation process increase with air change rate, but no clear correlation was found for the second phase emission data and air change rate.Table 3.1 Emission data estimated by a double-exponential model
Note:
Data are from Chang and Guo, 1992b;
Test conditions: 0.166m3, 23'~. 50%RH, 0.36-4.7ACH. L=0.1-1.3mz/m3; Doubleexponential model: EF = EFI, exp(-kid + EFM exp(-kM).
Zhang et al. (1996) investigated wood stain emission with an interfacial mass transfer model. The key parameter of this model is the interfacial mass transfer coefficient K (rnlh)
between gas phase and material surface. The results (Table 3.2) showed that K is dependent on the air velocity and turbulence. However, the rate decay constant of the concentration at the material surface estimated by the mass transfer model is barely influenced by air velocities.
t (h) 144 144 144 144 VOC Nonane 1.2.4-Trimethylbenzene Decane Undecane
Table 3.2 Wood stain mission data estimated by mass transfer model
Note: Data are from Zhang et al., 1996;
Test conditions: 0.4m3, 24'~. 0.5ACH. 45%RH, L=0.41m2/m3; V.P. (nrmHe. ) 4.6 2.23 1.7 0.66 Kz .d .I 0.007-0.036 0.0060.028 0.005-0.029 0.005-0.035 t @) , 144 144
t
@) cO.1 < 0.1 <0.1 < 0 EFI, ( d m % ) 220-6643 96-2816 242-6673 51-1103 VOC TVOC TVOC U (Ids) 0.066 0.167 kw 4 0.59-10.0 0.34-6.22 0.22-4.16 0.101.57 K(mm)
9.31 18.12 E F w 0.19-2.11 0.17-1.24 0.71-6.03 0.52-6.65&(o(o)
(mglm 2773 1713k
(,,.I 0.29 0.28 t @) 0.16 0.16IRUNRC CMEIAQ: Report 4.1 (08/97)
Mass transfer model: EF = K [ C,(O)exp(-kt)
-
C I.Woo6 stain emissions in a test building were also measured (Chang and Guo, 1994).
Analysis of the experimental results by fust-order model indicated the presence of a strong sink effect. For a detailed discussion of the sink effect, refer to An et al, 1997. The sink effect was further analyzed by a sink model. The adsorption/desorption coefficients of the sink model were found related to the vapor pressure of the compounds (see Table 3.3).
Table 3.3 Wood stain emission data estimated by a sink model
Note: Data are from Chang and Guo, 1994;
Test conditions: 305m3, 2 2 ' ~ 0.2SACH. Ls0.02m~m3; Sink model: EF = F& exp(-kt)
-
k.C + W, and K. = k. I kThe existing wood stain emission data, i.e., emission factor and rate decay constant, from four references are summarized in Table 3.4. It is shown that there are some differences in the emission data measured in different laboratories, probably due to the different test conditions and different estimation models. An analysis of these data indicated that the VOC
emissions from the wood stains can be characterized by two stages, a drying stage (evaporation-controlled) and an emission stage (diffusion-controlled) as suggested by Chang and Guo (1992b). The measured emission factors in the drying stage are much greater than those in the second stage, i.e., less than 1% of the initial value. The drylng period is typically less than 10 hours. The emission factors and rate decay constants in this drying period are greater than 2000 mg/m2h and 0.2 K', respectively, depending on test conditions.
Voc Nonane Decane Undecane
Table 3.4 Emission Data of wood stains k . (null) 0.15 0.19 0.15 V.P. (mmHa) 4.6 1.70 0.66
4
-1 0.09 0.081 0.024 S (m) 1.67 2.35 6.25t
(h) nla nla nla t @I) 80 80 80IRUNRC CMEIAQ: Report 4.1 (08197)
Note: All E@, values are estimated by the first-order decay model: EF (or Em) = FFo exp(-kt). Ref. 1. Tichenor and Guo, 1991;
Test wnditions: 0.166m3, 2 3 k . 0.354.6ACH. 50%RH, M.1-1.3m2/m3; 2. Zhang et al., 1996;
Test conditions: 0.4m3, 24'~. 05ACH, 45%RH, M.41m2/m3; 3. Chang and Guo, 1994;
Test wnditions: 305m3, 22'~. 0.25ACH, Ld.02m2/m3, sink model; 4. Chang and Guo, 1992b;
Test conditions: 0.166m3, 23'~, 50%RH, 0.36ACH. M.lm2/m3, doubleexponential model, EFo and k are of the average of the second phase emission.
3.2 Varnishes
There are many types of varnish formulas, such as alkyd, urethane varnishes, primer oils, water-based acrylic urethanes. The resin composition and solvents for common varnishes are listed in Table 3.5. As it is presented, the drying time is dependent on the type of solvents. In general, mineral spirit and tuqentine require a longer time to evaporate than esters and ketones. The VOCs emitted
from
common varnishes at early stage (i.e., a few hours) represent mainly the composition of the solvent. The major VOCs emitted from a waterborne varnish were butyl acetate, butoxyethanol, 2-(2ethoxyethoxy)ethanol, and N-methylpymolidone(Wolkoff et al., 1996a).
Table 3.5 Varnish compositions and solvents
Note: Data are from Maslow, 1982 and k l a i r and Rousseau, 1993.
Varnish Type Alkyd Urethane vamisk Primer oils Polyester Phenolic varnish Water-based
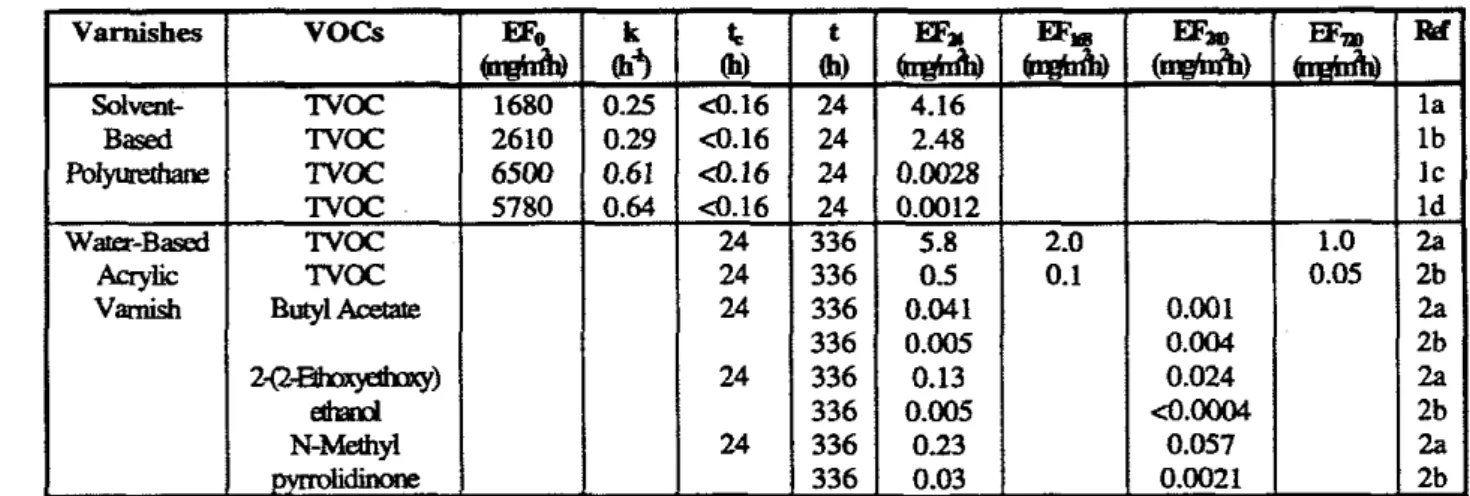
Published emission data of varnishes are summarized in Table 3.6. Like the emission of wood stains, the emission of varnishes is very high and diminishes quickly in the first few hours. For example, the emission factor of a polyurethane finish is about 9 mg/m2h within the first 10 hours and decreased to c 0.1 mglm2h afterwards (Tucker, 1991). Moreover, the emission of solvent-based varnishes are much higher than that of water-based varnishes. Tahtinen et al. (1996) reported that the emission factor of a solvent-based varnish after it was applied on a beech parquet and dried for one day was about 7 mg/m2h, while the emission factor of a water-based varnish tested under the same conditions was about 0.1 mg/m2h.
The emission profile of varnishes strongly depends on the chamber test conditions. It was reported that the TVOC emission factor of one varnish sample was significantly different
Composition
Polyacid polyalcohol, drying oil, coreacted Polyisocyanate, polyol, copolymerized Drying oil
Organic acid, polyalcohol, styrene,copolymerized
SuhstiMed pheml, fmnal&hy&&yhg oil, cavxied
Polyacr~lic urethane, or styrene butadiene
Solvent
M i n d !mpenbhe
Esters; ketones Mineral spirjt: Mpentine
Ketones
Mineral spirit; aromatics
Water DV '&re (h) 15-25 3-5 30-40 0.5-1 10-15 5-10
IRUNRC CMEIAQ: Report 4.1 (08197)
when it was tested in two different test chambers, i.e., a glass chamber (0.062 m3) and a
FLEC
(Tirkkonen et al., 1996). The difference was accounted by different air change rates and air velocities in the two chambers. It was also reported that the emission factors of a polyurethane finish measured in the same stainless steel chamber (0.166 m3) with differentair
change rates2 3 2 3
(between 0.5
h"
and 2 h-') and different loading factors (between 0.21 m Im to 0.42 m Im )were changed from 1680 mg/m2h to 6500 mg/m2h (Tichenor and Guo, 1991). These results indicted the effect of air change rate and air velocity on the VOC emissions of varnishes. However, Wolkoff et al. (1996b) reported that the emissions of but9 acetate and
N-
methylpyrrolidone, two of the major VOCs emitted from varnish, were not affected by air velocities ranged from 0.1 to 0.3 mls. The varnish sample used for their experiment was applied on wood parquet and preconditioned in an environmental chamber for 24 hours before moving to FLEC for testing. These results suggest that the effect of air velocity on the varnish emission is not important after the varnish is dried (i.e., after conditionedin
chamber for 24 hours).Schriever and co-worker (1990) measured the emission of a polyurethane coating material which was applied on the wood flooring (23 mZ) in a test mom (65 m3). The six major VOCs (ethyl acetate, i-butyl acetate, n-butyl acetate, n-butanol, toluene, and xylene) were all detectable on the 495th day, indicating the very long term emissions.
Table 3.6 Varnish emission data
Note: AU E@, values are estimated by the 6rst-order decay model: EF (or EQ) = Wo exp(-kt). Ref. 1.ZchemandGuq 1991;
Subnrate:Slainedwoodboards;
Chamber parametex 0.0166m3, 23OC. 5096, and a: OSACH and ~ . 2 l m ~ / m ~ ;
b: 1.OACH and L=0.42m2/m3; c: I .OACH and Ld.21m2/m3;
d: 2.OACI-I and ~ . 2 l m ~ / m ~ ; 2. Tukkonen et al., 1996,
Subamc Beechwood parqllet (78glm2k
Chamber parameters: a, 0.062m3, 23'~, 45% and IACH; b, lm3, 23'~. 45%. and 0.SACI-i.
IRcMRC CMEIAQ: Report 4.1 (08197)
As a summary, The TVOC emission factor of wet varnishes is as high as that of wet wood stains (i.e., >
ld
mg/m2h), whereas the emission factor of dried varnishes is much lower than the wet ones (i.e.,<
10 mg/m2h).3.3 Waxes
Commercial wax products are made of beeswax, linseed oil, resin oil, orange turpentine, and natural dryers. Mineral spirits and aromatics are the most popular solvent used in wax products. Major VOCs emitted from floor waxes were reported to be nonane, decane, undecane, dimethyloctanes, trirnethylcyclohexanes, ethylmethylbenzenes (Tichenor and Mason, 19881, methylethylcyclohexanes, trimethylbenzene, and pethyltoluene (Tichenor and Guo, 1991). Other compounds such as a-pinene, linalool, geraniol and a-cedrene, were also detected as major VOCs from liquid waxes (Wolkoff et
al.,
1993a and Colombo et al., 1993). It has been indicated that the VOCs identified from wax include about 80% - 90% (wlw) of alkanes (Person et al., 1990).The emission characteristics of floor waxes are a little different from that of wood stains and varnishes, as the air change rate and loading factor did not show significant impact on it (see Table 3.7). It was reported (Wolkoff et al., 1993a) that the k and EFo values measured in a
FLEC and a small chamber (0.345 m3) were similar, even though the air change rates in the two
apparatus were quite different (see Table 3.7). Further analysis revealed that under certain test conditions (i.e., different air change rates or different loading factors), the deviation of initial emission factor for floor wax was less than 33%, whereas the deviations for wood stain and polyurethane varnish were 85% and 59%. respectively (Tichenor and Guo, 1991). These results suggest that the emission factor of floor wax may be less dependent on air velocity above the test surface. Moreover, emission of floor wax indicated a very slow rate decay compared to that of wood stain and vanish. For example, one test showed that the emission factor of a wax sample decreased only 76% during six months (Tahtinen et al., 1996).
Table 3.7 TVOC emission data of floor wax
Note: All EQ, values are estimated by the first-order decay model: EF (or EQ) = EFo expf-kt). Ref. 1. Tichenor and Guo, 1991;
Subspate: Aluminum plates;
Chamber parameters: 0.0166m3, 2 3 ' ~ 50%:
IRCAXC CMEIAQ: Report 4.1 (08197)
a: Specimen: 4.68 ml of wax was read OW an area of 936 c d ;
"P
Chamber parameters: 0.234 m , 2 4 ' ~ , 50% RH;
b: Specimen: 0.891111 of wax was spread ova an area of 14.4 cm2 ;
Chamber parameters: 3.5x10-~m~, 24%. 50% RH; 3. Tahtinen et al., 1996;
s-Beechparquet:
Chamber parameters: 0.12m3, 23'~. 45%. and U=O.l-0.3m/s.
It should be noted that the k values shown in Table 3.7 are related to the drying period prior to testing. The k values from measured from the "wet" wax specimen (Tichenor and Guo, 1991) were much higher than those measured from "dried" wax specimen (Wolkoff et al., 1993a and Tahtinen et al., 1996). Also
the
k value measured after a 3-day drying period was much lower than those measured after a one-day drying period. This result indicated that the k value estimated by fmt-order model is in fact of a function of elapsed time. For instance, the k value corresponds to a specimen with an zero drying period would be greatly different from the k value with an one-day drying period. This phenomenon was also observed for wood stains and varnishes. If the k values are measured from fully dried coating materials, they can be used to estimate the VOC diffusion coefficients for the material film (Chang and Guo, 1992b). The change of k values with elapsed time indicated that the diffusion coefficients are not constant with the time.Table 3.8 present the wax emission data of in tenns of three VOCs and their physico- chemical parameters. The k values shown in the first column are estimated from data during a period of elapsed time between 0 hour and 23 hour. Those shown in the second column are estimated from data at and after the third hour (i.e., excluding the initial burst of VOCs). As shown in the table, the k values in the first column increased with the v.p. values of the corresponding compound. Recall that this phenomenon indicated an actual evaporation process (see section 3.1). The k values in the second column are not related to the v.p. values, but to the molecular weight (m.w.) of the corresponding compound, indicating a diffusion related process (Chang and Guo, 1992b). The k values for diffusion related emission increase with the m.w. values, indicating that the emission rate of the larger molecules decreases faster than that of the smaller molecules.
Table 3.8 Emission data of some VOCs emitted from waxes
Note: Emission data are from Wolkoff et al., 1993a:
V.P. values are estimated by the boiling points of the corresponding VOC.
Spimzn: 0.891111 of wax was yyioveranareaof 1 4 . 4 d ;
Chamber parameters: 3.5~10 m , 2 4 @ ~ , 50% RH, 181ACH, and -65 m2/m3;
vocs
a-Pinene Linalool Geraniol v-p. (mmHg) 3.69 0.11 0.02 law. (~Imol) 136 154 154Mh
Without pre-drying Pre-dried for 3 hrs
16.1 0.8 0.9 1 .O 1.5 1.5
-
IRC/NRC CMEIAQ: Report 4.1 (08197)
An international round robin study on the VOCs emissions from a water-based floor wax showed a very large deviation in the measured emission rates among the 20 participating laboratories. The measured initial emission factors of linallol (one of the major VOCs emitted from this wax) varied from 1.2 to 28.3 mg/m2h and the rate decay constants ranged from 0.46 to 13.0 h-' (Colombo et al., 1993). The discrepancy was attributed to the difference in chamber and the test conditions and data analysis techniques, such as sink effect, air velocity, analytical uncertainties (e.g., poor GC separations), and unsatisfactory curve fitting.
In summary, the initial emission factors of solvent-based waxes are generally greater than
lo3
mg/m2h, whereas the initial emission factors of water-based waxes are less thanid
m g / d h . The rate decay constant decreases with the time, i.e., the emission of waxes decreased quickly in the first few hours and slowed down afterwards. Once the rate decay constant become very small (a, < 10" h-'), the emission of waxes will gradually reach to a constant value.3.4 Paints
Like other coating materials, there are two types of paint, solvent-based paint and water-based (or waterborne) paint. The solvent-based paint is a b i d e r made from oils or resins dissolved in a solvent (usually petroleum spirits) with pigments added. Recently some alkylsiloxanes are developed to be used as solvent for alkyd paints. This type of solvent is in the low-volatile mode ( F i i l , 1996). The binders of water-based paints are resins such as latex, synthetic latex (styrene-butadiene), acrylics, or vinyls such as polyvinyl acetate. These binders are mixed in water with agents (called dispersants) to maintain them in suspension. A wide range of other agents is also added to water-based paints to give them various finishes ranging from matte to gloss. These add to the chemical complexity of the paint and usually also add to toxicity. Almost all of the materials used in conventional paint bases are derived from processed petroleum. One of the few exceptions is the use of some plant oils, such as linseed and soybean oil, as "drymg oils" for solvent-based, alkyd paints (Leclair and Rousseau, 1993). All those binders and agents as mentioned above contribute to the VOC compositions in paints. It has been measured (Fortrnann et al., 1993) that the VOC contents in alkyd (solvent-based) paint and in latex (waterborne) paint were 33.3% and 1.7% in mass ratio, respectively. The water contents in alkyd paint and latex paint are 0.2% and 48.6% in mass ratio, respectively.
The major VOCs emitted from waterborne acrylic paint are 2-(2-butoxyethoxy)ethanol (Wolkoff and Nielsen, 1996), texanol (22.4-trimethyl-1,3-pentanediol monoisobutyrate), 1,2- propanediol, and undecane (Wilkes et al., 1996). The major VOCs emitted from solvent-based alkyd paint are similar to those in the solvent (mostly petroleum spirits), i.e., nonane, decane, undecane, and trimethylbenzenes (Gehrig et al., 1993 and Brown et al., 1990). Besides, certain types of organic mercury were identified from latex paints (Tichenor et al., 1991). These organic mercury compounds were used as preservatives in waterborne paints. However, they have been banned for use in interior paints.
IRUNRC CMEIAQ: Report 4.1 (08197)
The emission processes of paints have been extensively studied. These studies include: investigating paint emissions under different test conditions such as type of substrate, temperature, humidity, air change rate, pollution concentration in the air, etc..; comparing the results of paint emissions obtained with different chambers or from different laboratories; and developing mathematical models which include both evaporation and film diffusion processes.
Gehrig and co-workers (1993) investigated the effects of different substrates on paint emissions. The paint was applied with a paint brush on a glass plate, paper covered gypsum plate and wood chip wall paper which was glued on a gypsum plate. The application area for each specimen was 0.25 m (about 70g of paint) corresponding to a loading factor of 0.17
2 3
m /m
.
The chamber tests were conducted starting from 30 minutes after application to about 95 hours. The experimental results were originally reported asVOC
concentration vs. elapsed time. The emission coefficients (EFo and k) estimated fromthe
experimental data bya
fmt- order decay model are shown in Table 3.9. It is noted thatthe
concentrations of 2(2- butoxyethoxy)ethanol and 2-(2-butoxyethoxy)ethanol acetate estimated by the fmt-order modelare lower than the experimental values after elapsed 24 hours. It may be explained by the strong sink effect of these two polar compounds. As shown in the table, the VOC emissions of the paint applied on the paper covered gypsum plate are much higher than those applied on the glass plate and wall paper, except that of 2-(2-butoxyethoxy)ethanol acetate. The result indicated the type of substrate should be concerned when emission data are reported.
Table 3.9 Comparison of VOC emissions of paint with different substrates
Note: Emission data are estimated by fmt-order model from experimental data (Gehrig, et alp 1993); Conditioning time (t): 30 minutes:
Chamber parameters: lm3, 23'~. 45%RH, IACH, and U=O9m/s. VOCs Nonane Decane Undecane 1.3,s-Trimethylbemne 12.4-Trimethylbenzene 1,2,2Trimethylbeazenc 2-(2-butoxyethoxy)ethanol 2 - ( 2 ~ ) & a m l a x t a t e TVOC
Bluyssen and co-workers (1996) tested the effect of temperature on paint emissions. 2 3
The experiment was conducted in a 15 m3 chamber, with 1 ACH, 45%
RH,
L = 6.25 m /m , and U = 0.1 m/s. The paint samples were applied on aluminum plates. The initial emission factor and rate decay constant of a solvent-based paint at 2 3 ' ~ were measured and estimated by a fmt-order model to be 19.2 mg/m2h and 26.9 h-', respectively, while at 30°C were 13.4 mg&h and 31.4 h-', respectively. It is a little surprise that the emission factor at 3 0 ' ~ was lower than that at 23'~. The authors stated that the emission during the first 24 hours was much higher atSubstrates Glass Plate
m
36.8 28.5 10.6 60.6 33.9 23.2 45.6 1.23 705 k 132 0.64 0.84 1.10 0.62 0.80 0.32 0.27 1.00Gypsum Plate Wall Pamr
a?
73.6 55.4 23.5 1152 42.2 35.2 23.2 0.77 1375 EE.9 38.9 325 7.42 53.1 22.5 18.4 14.2 0.33 592 k 323 2.12 3.12 7.77 0.87 1.54 0.41 0.23 2.92 k 124 0.87 0.55 1 .M 0.34 0.59 0.37 0.02 0.87IRCNRC CMEIAQ: Report 4.1 (08197)
3 0 ' ~ than at 2 3 ' ~ and
the
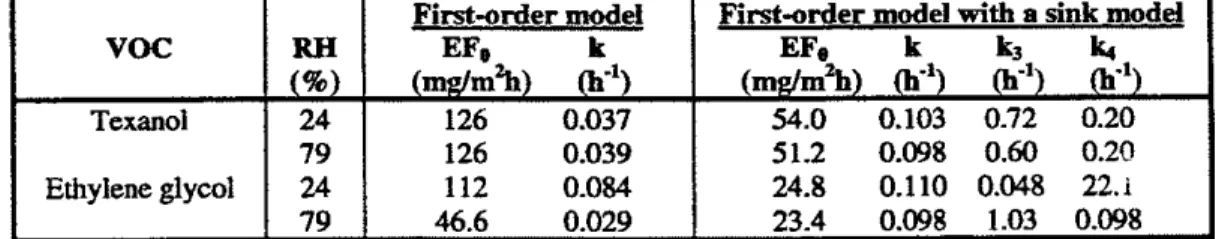
rate decay constant was also higher at 30'~. The relatively lower emission factor at 3 0 ' ~ after conditioning is reasonable. The initial emission factor and rate decay constant of a waterborne paint were 46 mg/m2h and 58.1 h-' at 2 3 ' ~ and were 66.7 mg/m2h and 69.9 h-' at 3o0c, respectively. These results suggest that a change in temperature would affect the emission profde of paints. A standard test method should specify not only the temperature, but also when should the air samples be taken for determination of emission rates.Humidity effect on the emission of a waterborne paint was studied by Roache et al. (1996a). Emissions of
the
paint samples were tested in FLECs at 24% RH and 79% RH,2 3
respectively. Other chamber parameters were: 0.053 m3, 23'~. 0.5 ACH, L = 0.48 m /m
.
The paint was applied on a gypsum board and immediately placed in the chamber. The tests were performed over 2 weeks. The emission coefficients shown in Table 3.10 are estimated from both a f i r s t - o r model and a fmt-order model with a sink component, respectively. The emission coefficients of texanol at 24% 40 and 79% RH from both models are almost identical. The initial emission factor and rate decay constant of ethylene glycol estimated by the fmt-order model are quite different as RH changed from 24% to 79%. while the values estimated by the first-order model with a sink component are very similaras
RH changed. The adsorption and desorption coefficients of ethylene glycol estimated by the model with a sink component at RH of 24% and 79% are significantly different. The results indicate that the adsorption of ethylene glycol increased with the surface humidity. As it contains two hydroxyl groups (-OH), ethylene glycol would display a high affiity towards water molecules which also contain hydroxyl group. This strongly suggests that the humidity effect on the VOC emissions is due to the presence of polar groups with a high affinity to water molecules.Table 3.10 Emission data of texanol and ethylene glycol at different relative humidity
Note: Emission data are estimated from experimental data (Roache, et al, 1996a);
Specimen: The paint was applied to the gypsum board and immediately placed in the cahmber; Chamber test time (t): 336 h;
Chamber paranetem: lm3. 23'~. 45%RH, IACH, and U=0.3ds; Fit-order decay model: EF = EFo exp(-kt);
Fit-order decay model with a sink model: EF = E F o exp(-kt)
-
k3UL + W, VOCTexan01 Ethylene glycol
Wolkoff et al. (1993b) studied the emission of a waterborne paint in FLECs under
different
air
change rates (171 h", 342 h-I, and 684 h-'). The 94-hour experimental data were analyzed by a first-order model incorporating a sink component, as shown in Table 3.1 1. It was found that the rate decay constant of texanol increased with the air change rate, indicating a somehow evaporation controlled process, which is consistent with that observed for woodFirst-order model EFD k -1 (mg/m%) (h ) 126 0.037 126 0.039 112 0.084 46.6 0.029 R H (%) 24 79 24 79
First-order model with a sink model EFo k 4 4 (mg/mzh)
m')
Q -1 ) (h -1 ) 54.0 0.103 0.72 0.20 51.2 0.098 0.M) 0.20 24.8 0.110 0.048 22.i 23.4 0.098 1.03 0.098IRCINRC CMEIAQ: Report 4.1 (08197)
stains and polyurethane varnish (Tichenor and Guo, 1991). The sink coeficents Og and kd, in Table 3.1 1) decreased as air change rate increased.
Table 3.1 1 Emission data of texanol at different air exchange rates
Note: Data are from Wolkoff et al., 1993b and estimated by the iirst-order mcdel with a sink model; Chamber parameters: 35x10-' m3, 22'~. SWRH. L = 505 m2h3;
First-order decay model: EF = EFo exp(-kt);
First-order decay model with a sink model: EF = EFo exp(-kt)
-
k,C+
kdM,The impact of air velocity on emissions of 1,2-propanediol and texanol was investigated in a small chamber (Wolkoff et al., 1996b). The paint specimen had been dried and preconditioned in the test chamber for 24 hours. The experimental results showed that the air velocity (0.1
-
0.3 mls) had no considerable influence ( 4 0 % of difference). This is similar to the emission of butyl acetate from varnish samples. These results indicatedthat
for a fully dried paint sample, the effect of air velocity on the paint emissions is insignificant.First-order model with a Sink model
EF. k 4
Ld
( d m % ) @I) (mh") (h -1) 0.1 18 0.0028 0.0058 0.8 0.048 0.0083 0.0018 0.4 N @I) 342 684Andersen et al. (1996) investigated the influence of the background VOC concentration in the chamber air on the emissions of waterborne acrylic paint and other materials (a lacquered beechwood and a carpet). They found
that
the emission factors of TVOC and five individual VOCs (1-butanol, 2ethyl-I-hexanol, undecane, 13-propanediol, and texanol) decreased as VOC concentration in the chamberair
increased. The result was rationalized as the involvement of evaporation process, since the VOC concentration in the chamber air is proportional to its vapor pressure, which is the key factor to control the VOC evaporation process. The background VOC concentration in the chamber was found no effect on the emission of lacquered beechwood, but a moderate effect on the emission of carpet.First-order model
EFa k
( d m % ) @I)
0.082 0.008 0.067 0.015
To investigate the effect of the film thickness on paint emissions, the waterborne paint samples were applied to steel sheets (250
mm
X 341 rnm) with thicknesses of 22, 28, and 56 urn, respectively (Clausen, 1993). The emission factors of three VOCs (l,2-propanediol, 2-(2- butoxyethoxy)ethanol, and texanol) were found increase with the film thickness, while the rate decay constants decrease as the film thickness increases from 28 pm to 56 pm.Table 3.12 VOC emission data of paint with different film thickness VOC 1,2-hpanediol t 13) 336 336 336 b.p.
to
187 Thickness (wm) 22 28 56 v . . (~mnHg) 0.11 EFe (mdm2h) 0.12 0.22 2.45 K @I) 0.025 0.057 0.036 t. (h) 24 24 24IRC/NRC CMEIAQ: Report 4.1 (08197)
Note: Data are from Clausen, 1993 b first-order decay model: EF = EFo ex$-kt).
2
Chamber parameters: 0.234 m ,23'~, 45% RH, 0.25 ACH, M . 3 6 m /m3; Specimen preparation: The paint was applied on tin plated steel sheets (250mm
x 341mm) with paint roller.
2-(2-Butoxyethoxy)ethanol
Texan01
Wikes et al(1996) developed a doubleexponential model to study the emission of latex paint applied on gypsum boards. The emission of the individual VOCs (12-propanediol, ethylene glycol, 2-(2-butoxyethoxy)ethanol, and texanol) was in general characterized by two components, fast emission and slow (diffusion-controlled) emission. It was found that the emission factor and rate decay constant in
the
fast emission stage were much higher (i.e., over10 times)
than
those in the slow emission stage. However, during the fast emission stage which is corresponding the early emission period, only 10% or less of the total VOC mass wasemitted. The emission factors and emission decay constants estimated by the double-
exponential model are shown in Table 3.13. The EFI, and
kl,
represent the emission factor and decay rate constant in the fast emission stage and theEF-
andkm
represent the emission factor and decay rate constant in the slow emission stage. A comparison between the emission data and the physicochemical data of the compounds in Table 3.13 suggests that the fast emission stage and the slow emission stage are related to the evaporation process and the filmdiffusion process, respectively. Furthermore, a comparison between the
km
values in Table 3.13 and thek w
values in Table 3.1 (wood stain emission estimated by the double-exponential model) suggests that the rate decay constants of individual VOCs in the diffusion process are in the same range for both paint and wood stain.Table 3.13 Emission data of paint estimated by a doubleexponential model 148
>280
Note: Data are from Wilkes et al., 1996;
Specimen: Paint sample was applied on gypsum board and immediately inserted into the chamber; Doubleexponential model: EF = EFI, exp(-kid
+
EF- e x N - k ~ ) .The existing emission data for paints are summarized in Table 3.14. Variations in the test results are probably due to differences in the test methods, procedures and environmental conditions. t 01) 240 240 240 240 VOC 1.2-Propanediol Ethylene glycol 2-(2- butoxyethoxy)ethanol Texanol 24 24 24 24 24 24 0.018 0.020 0.009 0.015 0.016 0.005 0.014 0.07 336 336 336 336 336 336 22 28 56 22 28 56 V.P. ( d g ) 0.2 0.05 0.02 0.0019 0.043 0.048 0.605 0.525 0.736 1.97 km -1 49.7 1.34 0.16 0.94 mw. W w l ) 76.1 62.1 162 216 E F a
(m)
0.0058 0.055 0.022 0.22 EFl, (4) 0.82 2.81 0.25 1.46 k~ -1 0.003 0.0026 0.0099 0.013IRUNRC CMEIAQ: Report 4.1 (08197)
Table 3.14 Paint emission data
Note: All EF, and Eat values are estimated by the first-order decay model: EF (or EQ) = EFo exp(-kt). Ref. 1. Tlddioceu et al.. 1993;
Subarate: Gypsum M,
Chamber parameters: lm3. 23% 45%, 0.5ACH and L=0.41mz/m3; 2. Clausen etal., 1991;
Subsltate: T i - p w & sheet;
Chamber parameters: 0.234m3, 23Oc, 45%, 0.25ACH and ~ = 1 . 4 6 m ~ / m ~ ; 3. Gumarsen ad, 1994;
Substrate: Aluminum p*,
Chamber parameten: a: 0.051m3, 22'~. 50%. SdlACH, U=O.I5m/s, L=3.1m21m3; b: 3.5~10-*m3. 22'~. 50%. 171ACH. U=O.O035mls: 12Js 1 1 1 2 2 2 2 2 3a 3a 3a 3b k M 3e 4a 4b
c: 28.5m3, 22%.
s&,
ZACH, u=o.imls; d: 1m3 (glass), 22'~. 50%. 3ACH. U=0.13ds;e: 0.003m3, 22%, 50%;
4. Tikkonen et al., 19%.
Substrate: Gypsum board;
Chamber parameters: a: 0.062m3 (glass), lACH, 23'~. 45%; b: 0.12m3, 23'~. 45%. O.5ACH. 1 Wa I -Paint Solvent-fReLat€x Paim AcrylareIatexPaint WataiaXmPaint WarabcmePaint waterbcmepaid WataiaXmPaint warabcme~aim W a r a b c m e m WaretrmeAPylic WarabcmeAcrytic
In an effort to reduce the variation in the emission test results and to develop a standard test method for paint, a comprehensive interlaboratory comparison study on the small chamber testing of latex paints has been conducted among 18 partners (De Bortoli et al., 1995). The
2 3
chamber conditions were T = 23'~, N = 1,
RH
= 45%. L = 0.5 m Im , and U = 10 c d s . The paint samples were applied on either a stainless steel plate or an aluminum plate. The average paint film thickness was about 66 pm. The test period was 312 hours. The measured concentration ranges for 2-(2-butoxyethoxy)ethanol were between 0.065 and 3.395 mg/m3, 0 and 0.415 mg/m3, and 0 and 0.05 mg/m3, at 3h, 78h and 240h, respectively. The results indicate that a large discrepancy, among these laboratory measurements still existed, even though it was1.86 0.04 0.01030 8473.7 0269.1 0.868.1 0112833 0.401.0 OM136 MOl4 0.024.16 0.04 0.22 0.18 0.29 VOCs lVOC TVOC TVOC TVOC WhiteSpirit 1~~ 2-Bidoqe&ad uodecane 1.2-Propaoediol Blrtand Tegml k (h3 O.iBMit57 0.014QOR a 0 1 2 m QWiO.089 am0.10 Texand WamtmceAnylic WaterbcmeAuyk W - F W a r a b c m e m t. 01) 48 48 48 24 24 24 24 24 672 6R 6R 672 6n 672 672 24 24 Texand TVOC TVOC t Q) da da da Sn 672 ~4 6n
m
da da a$ da IJa da da 3% 3%w
18.7 1.48 23.5 5.3 0.07 0.9 2.2 % (nghlP1) 0.16 0.0015 2.34 0.0056 6.9~10-~IRC/NRC CMEIAQ: Report 4.1 (08197)
much better than the previous interlaboratory comparison results (Colombo et al, 1993). The discrepancy was attributed to the factors, such as specimen preparation, chamber sink effects, surface air velocities, and chemical analysis methods.
In summary, tbe VOC emission from paints have been studied in detail. Substrates, specimen thickness, and chamber conditions, such as air flow rate,
air
speed, temperature and humidity, are the main factors affecting the emissions of wet paint samples. The TVOC initial emission factors of solvent-based paints are in the order ofid
mg/m2h, which are lower than those of other coating materials. The TVOC initial emission factors of waterborne paints ranged from 9 to 75 mg/m2h. The rate decay constants for solvent-base wet paints are in the order of 10.' - 10' h-', while for waterborne wet paint are in the order oflo-*
- lo-' h-'. In general, the emission factors for fully dried paints (i.e., 48 hours after the application) are below 0.1 m g l d h with the rate decay constant of less than 10'' h-'.3.5 Summary of coating material emissions
A comparison of the VOC emissions from individual coating materials indicates that two processes generally exist, i.e., drying (evaporation controlled) process and post-drying (diffusion controlled) process. The emission in
the
drying process, which usually takes about a few hours, varies greatly with the test conditions. The rate decay constants for this emission are generally higher than lo-' h". The emission in the post-drying process can be characterized by relatively lower emission factors (< 10 mg/m2h) and rate decay constants (S h").4. INSTALLATION MATERIALS
Installation materials include adhesives, caulks and sealants, joint patching and texturing compounds, and grout or mortar. The emission data of these wet installation materials were summarized in Appendix 2. Those emission data measured during installation process,
e.g., emission of seamed carpet will be discussed in the section of material systems. 4. I Adhesives
Adhesives, like paints and other wet materials, are either solvent based or water based. Solvent-based adhesives contain synthetic resins, and xylene, toluene, 1,l.l- trichloroethane, acetone, or other solvents. Water-based, latex adhesives contain smaller quantities of organic solvents, so they are also called "low-VOC' adhesives. It has been reported (Person et al., 1990) that the VOCs emitted from both solvent-based and water-based adhesives include aliphtic hydrocarbons, aromatic hydrocarbons, chlorinated hydrocarbons, esters, alcohols, ketones and aldehydes. While aliphatic and aromatic hydrocarbons are major VOCs, i.e., from 35% to 70%. in solvent-based adhesives, alcohols (mostly diols) represent 20 - 50% of
TVOC
in water-based adhesives. Aliphatic and aromatic hydrocarbons have been also reported to be the major VOCs in water-based adhesives when no alcohols are identified (Tichenor and Mason, 1988). The available emission data of adhesives are listed in Table 4.1.I R W C CMEIAQ: Report 4.1 (08197)
Tichenor and Mason (1988) reported that the adhesive TVOC emission factors (mg/m2h) of one adhesive sample at 0.5h, lh, and 5h were 1700, 700, and 100, respectively. The test was conducted in a small chamber at 1.84 ACH and 50%
RH.
The data indicated that the emission factors decrease about 95% within the first 5 hours. A long term study (Black et al., 1991) showed that theTVOC
emission factor of a solvent-based latex adhesive decreased about 90% during the fmt day of the test, while it required 16 days to decrease about 99%. The EFo, EF24, E F I ~ ~ . and EF7rn of this latex adhesive are shown in Table 4.1. The emission factors of water-based adhesives were much smaller than that of solvent-based adhesives. It was reported (Davidson et al., 1991) that the emission factor of a water-based adhesive decreased 99% within 6 days (see Table 4.1).Emission profiles of individual VOCs from adhesives are rarely studied.
The
only individual VOC, which was measured is toluene (Nagda et al., 1993). Unfortunately the reported emission rate is in mgh with no reported loading factor and application area. The data are, thus, not included in this review.The
emission rate of toluene, as reported decreased 99% within the first 10 hours of the test. This result is apparently comparable to previous TVOC emission data reported by Tichenor and Mason (1988).Table 4.1 Emission Data of Adhesives
Note: All EF, values are estimated by the fust-order decay model: EF = EFo exN-kt). Ref. 1. Black et al., 1991;
Chamber parameters: 0.05m3, 2 5 ' ~ . IACH, 50%RH, and M.41; 2. Davidson et al.. 1991:
Chamber parameters: same as above. 4.2 Caulks and sealants
Caulks and sealants are used to fill gaps or create seals where some flexibility is required. The difference between sealants and caulks is that sealants are load-bearing, elastic joint materials capable of expanding and contracting with the motion of joints, whereas caulks are not load-bearing materials (Maslow, 1982). Traditional caulking materials were linseed oil putties, tree resins, and asphalt. Modem caulkings for construction
are
made primarily from synthetic polymers, some of which are from the same chemical families as paints-
latex, acrylics, and urethanes. Others, such as those made from silicones, polychloroprenes, polysulfides, and butyls, are quite different from paint bases. The most common caulkings for indoor use are made from acrylic latex and silicones.The
solvent-based caulkings are formulated with hazardous solvents, such as acetone, 2-butanone, toluene, xylenes, andIRUNRC CMEIAQ: Report 4.1 (08197)
alcohols. The so called low-toxicity caulkings are also made of synthetic resins, but contain little or no hazardous solvents or fungicides.
The major VOCs identified from caulking materials are mostly representative of the solvent components. For instance, the reported major VOCs identifed by GClMS in a silicone caulk were 2-butanone, butylpropionate, 2-butoxyethanol, butanol, benzene, and toluene (Tichenor and Mason. 1988). in an oil-based acrylic sealant were acetone, hexane, methylcyclopentane, cyclohexane, dimethyloctanols and
BHT
(Wolkoff et al., 1996a), and in a waterborne acrylic sealant were butanol, 2-(2-butoxyethoxy)ethanol, and 2-(2- butoxyethoxy)ethanol acetate (Wolkoff and Nielsen, 1996).The published emission data of sealants and caulks are listed in Appendix 2b. Their emission values are shown in Table 4.2. Analysis of these data indicated that the caulking emissions are strongly dependent on the type of caulkings and the air change rate in the test chamber.
Different type of caulkings may present very different emission factors. For instance, the initial emission factor of TVOC measured from a silicone caulk was 476 mg/mzh and the major VOCs were 2-butanone, 2ethyIhexano1, and butylpropionate (Durn, 1987). The measured initial emission factor of a seam sealant was 2.96 mg/m2h and the major VOCs were toluene, 1,3-dioxalane, 2-butanol, l,l,l-trichlomthane, and tetrachloroethylene, (Davidson et al., 1991). Both experiments were conducted in small chambers with volume of 0.166 and 0.050 m3, respectively, and the air change rates of 1.84 h-I and 1.0 h-', respectively. This difference would be resulted from the different VOC contents in the two samples. Catananti et al. (1993) and Levin (1992) reported that the emission factor of silicone caulk was about 3
-
7 times higher than that of latex caulk. The high emission of silicone caulk is probably due to thehigh solvent requirement for its manufacturing. It is noted that the emission factors may be quite different even if the caulkings are the same
w.
As an example, the initial emission factors of 2-butanone, butylpropionate, and 2-ethylhexanol in one silicone caulk were approximately 75, 40, and 28 mg/m2h, respectively (Tichenor and Mason, 1988), whereas in another silicone caulk were approximately 416, 137, and 213 mg/m2h, respectively (Dunn, 1987). The two silicone caulks were measured in different laboratories and probably produced by different manufacturers. The results suggested that caution should be exercised when emission factors are used to characterize the individual materials. In general, water-based caulkings had relatively lower emission rates than silicone-based caulkings (see Table 4.2).Effect of air change rate on caulking emissions have been investigated by a number of groups, with no consistent conclusions. Some researchers (Tichenor and Mason, 1988, and Wolkoff et al., 1993b) reported that the emission factors increased with the air change rate while other (Durn, 1987) reported the opposite (i.e., the emission factors increased as the air change rate decreased, as shown in Table 4.2). It is noted that most emission factors presented in Table 4.2 are derived from diffusion models, so they are shown as
Fo.
A comparison between the Fo values and the EFo values derived from the first-order decay model indicates that thereIRUNRC CMEIAQ: Report 4.1 (08197)
experimental data which showed that the emission factors increased with the air change rate, were measured using a procedure which involved one week drying period before starting the chamber test. On the other hand, the experimental data which indicated the emission factors increased as the air change rate decreased, were measured using a procedure which included no drying period. Further experiments are needed to confvm the relationship between the sample preconditions and the effect of air change rate on caulking emissions. The emission factor values changed about 10% to 100% when air change rate changed about 4
-
5 times (see Table 4.2).Gunnarsen et al. (1994) tested the emission of a silicone sealant
in
6 different chambers. These chambers included aFLEC
(3.5x10-' m3), two stainless steel chambers (0.051 m3), two glass chambers (0.003 m3 and 1 m3), and a full-scale chamber (28.5 m3). The sealant samples had been preconditioned in the chambers for six days before starting the measurements. The results varied significantly (e.g., the emission factors of 3,7-dimethyloctanol changed fkom 1.1 mg/mzh to 7.2 mg/mzh).Table 4.2 Emission Data of Caulks and Sealants
Ref: 1. Davidson et al.. 1991;
Test conditions: 0.05m3 stainless steel chamber, 25'~. 1 ACH, 50% RH, M . 4 1 ;
Major VOCs: Toluene, 1.3-dioxalane, 2-butanol, l.l,l-trichloroethane, and tetrachloroethylene;
EQ, values are estimated by the fust-order decay model: EQ = EF,, exp(-kt). 2. Wolkoff et al., 1993b;
Test conditions: 3.5x10-~m~ FLEC, 22'~. 50% RH, L20.6; a) 171 ACH; b) 343 ACH; C) 684 ACH, Silicone- Based Acrylic Caulk Waterborne Acrylic Sealant 3,7-Dimethylocranol 3,7-Dimethylocranol Hexane 2-Ethylhexanol Dimethyloctanol Butanol 2-(2-Butoxyethoxy) ethanol 2-(2-Butoxyethoxy) ethanol acetate 13.7 18.4 14.3 18.9 12.9 0.51 5.92 6.% 100.5 28.4 O.MXX)9 0.00013 0.0006 0.027 0.00014 0.00066 0.00001 0.00008 168 168 24 24 24 24 24 24 168 168 5000 5000 5000 5000 5000 5000 13.4 1 7 5 11.9 13.1 2b 2c 3 3 3 3 3 3
IRUNRC CMEIAQ: Report 4.1 (08197)
EQt values are estimated by the diffusion model: EF (or EQ) = l/[kmtt
+
Fa];3. Wolkoff and Nielsen, 1996b;
Test conditions: 3.5x10"m3 FLEC, 23°~,51% RH, 514 ACH, L20.6.
E@, values are estimated by the diffusion model: EF (or E@) = 1/[ k&
+
Fa].As shown in Table 4.2, the emissions of caulks and sealants are characterized by a long enduring period, as illustrated by the high values of EF168. It is noted that some of the tested sealant samples had been dried for one week before starting the measurement (Wolkoff et al, 1993b). In a real life, this slow emission can take months to disappear (Leclair and Rousseau, 1993). %chenor and Mason have noticed that the emission enduring time is different from compound to compound. 2-Ethylhexanol endured much longer than 2-butanone and butylpropionate. This may be understood by the fact that 2ethylhexanol
(B.P.
184'~) is less volatile than 2-butanone (B.P. 80'~) and butylpropionate (B.P. 145'~). The less volatile compounds are likely reluctant to be released from the surface. In addition, the hydroxyl groups in alcohols may have special attraction towards the silicones (siloxane polymers). Nonetheless, hexane, a high volatile compound(B.P.
6g0c), displayed slow emission as well, indicating that a more complicated interaction may be involved in the material surface or within the material.To summarize, caulkings, in particular, silicone-based sealants and caulks, have been tested in small chambers for their short term emissions. The emission data indicated that the initial emissions (no preconditioning) of caulkings are very
high.
As shown in Table 4.2, EFo of TVOC was over 1000 mg/m2h. The VOC emission factors after drying for one week are much lower than those without drying. Approximately over 90% of VOCs were emitted during the one week drying process. The remaining VOCs (less than 10%) underwent a slow emission. The time period of this slow emission depends on the individual compound. There is apparently a lack of long term emission data (i.e., over a month or longer period of time).5. DRY INDIVIDUAL MATERIALS
Dry materials are those used as interior construction panels, flooring, wall covering, and carpeting, and furniture (e.g., office work station, kitchen cabinets). The individual materials
are wood board, gypsum board, linoleum, carpet, and vinyl coverings (including flooring and wall covering). Other dry materials such as concrete, ceramic covering, marble, and stoneware
are not included, since there have been no emission data available for these materials so far. VOC emissions from dry materials are generally characterized by nearly constant or very slow emission decay rate.
5.1 Wood boards
Wood boards include plywood, oriented strand board (OSB), particleboard, and fiberboard. The major VOCs emitted from these wood boards are formaldehyde and terpenes. It has been reported that the percentage of aldehyde and terpenes in total emissions of wood boards ranged from 25% to 100% (Sundin et al., 1992). To prevent formaldehyde emission, woodboards are usually sealed with oil-based coatings or with specially formulated sealers. The
IRUNRC CMEIAQ: Report 4.1 (08197)
emissions of these oiled woodboards are, therefore, characterized by the VOCs commonly observed from wood coatings.
Published emission data of wood boards are listed in detail in Table 5.1. Difference in manufacturing, duration of shipping and storing, sample preparation, and testing conditions, etc., may account for the variations.
Van der Wal(1990) measured the emissions of four different plywood boards in a small chamber. The emission factors of formaldehyde measured at 1 hour after the test ranged from 0.015 to 1.06 mg/m2h and those measured at 24 hour ranged from 0.005 to 0.72 mg/m2h. The measured emission factors for terpenes also varied in a wide range, i.e., from 0.3 to 2.4 mg/m2h at 1 hour and from 0.08 to 0.85 mg&h at 24 hour. Since the sample preparation and test wnditions were all the same for the four plywood samples,
the
variation in formaldehyde (or terpenes) emission is probably due to the different manufacturing process and different storage duration. The TVOC emission factor of plywood was aboutthe
same as that of formaldehyde and terpenes, 0.044 mg/m2h (Molhave, 1982, see Table 5.1). However, the emission factor of a factory-coated plywood sheet was 0.48 mg/m2h (Colombo et al., 1990), indicating that some VOCs were originated fromthe
coatings.Saarela and Sandell (1991) found that
the
TVOC
emission factors of several pinewood and birchwood manufactured differently were very similar, i.e., 0.15-
0.68 mg/m2h (Table 5.1). In addition, the age of these wood boards apparently had no impact on the emissions. A long term emission of a factory-coated parquet was investigated by Tahtinen et al (1996). The emission factors for this parquet were 0.1 1,0.09,0.07 mg/mZh when measured on the 3rd, 14th, and 28th days, respectively, after starting the test. The test was conducted in a 0.12-m3 stainless2 3
steel chamber with 23O~, 45%IW, 5096, and L = 0.4 m Im
.
The result indicated a slow emission decay after start of the test. Longer term test may be needed to trace this emission decay.The TVOC emissions of particleboards were reported to be 0.12
-
0.95 mg/m2h (Molhave, 1982 and Black et al., 1991). Slow emission decay was also observed for particleboard emissions. The TVOC emission factor of fiberboard, as shown in Table 5.1, was about the same as that of particleboard (0.12). This is understandable since both particleboard and fiberboard are made from wood dust and chips and pressed into sheets using glues. DifferentVOC
emissions are most likely resulted from different amount of glue used during the manufacturing process. The emission factor decreased about 12% duringa
six-day test, i.e., from 0.95 mg/m2h to 0.84 mg/m2h, as shown in Table 5.1 (Black et al., 1991).Gypsum boards which are made of gypsum and fibers contain barely organics, despite some chemicals may be added to make it water-proof or for other purposes. Hence, gypsum boards are characterized by their very low emissions, i.e., 0.003