Anatomical connectivity patterns predict
face selectivity in the fusiform gyrus
The MIT Faculty has made this article openly available.
Please share
how this access benefits you. Your story matters.
Citation
Saygin, Zeynep M, David E Osher, Kami Koldewyn, Gretchen
Reynolds, John D E Gabrieli, and Rebecca R Saxe. “Anatomical
Connectivity Patterns Predict Face Selectivity in the Fusiform
Gyrus.” Nat Neurosci 15, no. 2 (December 25, 2011): 321–327.
As Published
http://dx.doi.org/10.1038/nn.3001
Publisher
Nature Publishing Group
Version
Author's final manuscript
Citable link
http://hdl.handle.net/1721.1/88514
Terms of Use
Creative Commons Attribution-Noncommercial-Share Alike
Anatomical connectivity patterns predict face-selectivity in the
fusiform gyrus
Zeynep M. Saygin1,2,*, David E. Osher1,2,*, Kami Koldewyn1,2, Gretchen Reynolds1, John
D.E. Gabrieli1,2,3, and Rebecca R. Saxe1
1Department of Brain and Cognitive Sciences, Massachusetts Institute of Technology, 43 Vassar Street, Cambridge, MA 02139
2McGovern Institute for Brain Research, Massachusetts Institute of Technology, 43 Vassar Street, Cambridge, MA 02139
3Harvard-MIT Health Sciences and Technology, Massachusetts Institute of Technology, 43 Vassar Street, Cambridge, MA 02139
Abstract
A fundamental assumption in neuroscience is that brain structure determines function. Accordingly, functionally distinct regions of cortex should be structurally distinct in their connections to other areas. We tested this hypothesis in relation to face selectivity in the fusiform gyrus. By using only structural connectivity, as measured through diffusion weighted imaging, we are able to predict functional activation to faces in the fusiform gyrus. These predictions
outperformed two control models and a standard group-average benchmark. The structure-function relationship discovered from these participants was highly robust in predicting activation in a second group of participants, despite differences in acquisition parameters and stimuli. This approach can thus reliably estimate activation in participants who cannot perform functional imaging tasks, and is an alternative to group-activation maps. Additionally, we identified cortical regions whose connectivity is highly influential in predicting face-selectivity within the fusiform, suggesting a possible mechanistic architecture underlying face processing in humans.
Keywords
Diffusion imaging; DTI; DWI; tractography; fusiform; structural connectivity; FFA
A fundamental assumption in neuroscience is that function is deeply-rooted in anatomical structure, such as extrinsic connectivity. A region’s connectivity pattern determines both the information available as inputs from other regions, and its output and influence on other areas. Indeed, changes in connectivity have been shown to occur at the boundaries of functionally-defined regions that can be identified through cytoarchitectonics
(supplementary motor area (SMA) vs. pre-SMA)1. If anatomical connectivity is important for functional operations, then variation in connectivity should correspond with and predict
Corresponding authors:[email protected] (Z.M. Saygin), Phone: +1-401-9352405, Fax: +1 617-324-5311, Address: Dept. of Brain and Cognitive Sciences, Massachusetts Institute of Technology, 43 Vassar St., Room 46-4033E, Cambridge, MA 02139,
[email protected] (D.E. Osher), Phone: +1-617-324-4355, Fax: +1 617-324-5311, Address: Dept. of Brain and Cognitive Sciences, Massachusetts Institute of Technology, 43 Vassar St., Room 46-4033A, Cambridge, MA 02139.
*Z.M.S and D.E.O contributed equally to this work
Author Contributions
NIH Public Access
Author Manuscript
Nat Neurosci
. Author manuscript; available in PMC 2012 August 01. Published in final edited form as:Nat Neurosci. ; 15(2): 321–327. doi:10.1038/nn.3001.
NIH-PA Author Manuscript
NIH-PA Author Manuscript
variation in function, even in regions that are currently not anatomically definable or spatially consistent across the population. This intuitive claim has not yet been formally explored, though various frameworks for such an analysis have been suggested2.
In the absence of any additional information, can structural connectivity accurately predict the location and degree of the functional response in the brain? The extrinsic connectivity pattern of a structure may contain sufficient information to predict the extent to which each voxel will respond to a given functional contrast. This hypothesis could be tested using a functional contrast that consistently elicits robust responses, and constrained to an anatomical structure that reliably encapsulates such responses across participants, even if they vary spatially within the region.
Regions involved in face-processing may be well-suited for directly testing this conjecture, given their posited specificity of function and replicability across brain imaging techniques, participants, and species. A dedicated network of brain regions has been consistently reported to selectively respond to faces, as revealed by fMRI3, 4, single-unit recordings5, 6, and microstimulation7. The most robust and selective component of this network is within the fusiform gyrus8, in a functionally defined region that is selectively activated in response to faces relative to objects9 or scenes10. This region is typically larger and more reliably observed in the right fusiform, and is known as the fusiform face area (FFA). This is consistent with a wide range of evidence that most aspects of face perception are right-hemisphere dominant in the human brain8, 11, 12. Further, damage to the right fusiform disproportionately impairs face recognition, sometimes even without disturbing other stimulus categories13, 14. Given that it is the right fusiform that best responds to faces across participants (e.g.8, 15), we chose this region as a testing ground for modeling brain activity as a function of structural connectivity.
A purely structural substrate of face-selective cortices has not yet been established, possibly due to complications in relating classic approaches of connectivity (such as histological tract-tracing) with functional localization in the same individual. However, diffusion weighted imaging (DWI), an MRI technique that measures the propensity of water to travel along myelinated axons, can be used to estimate brain connectivity in vivo16, 17, which can
be analyzed alongside fMRI data in the same individual. Using a probabilistic tractography algorithm, we defined the connection probability of each right fusiform voxel (seeds) to all other anatomically parcellated regions (targets) (see Supplementary Fig. 1,2 for exemplar pathways18–20). For the same participants, the functional activation of faces relative to scenes for each voxel in the fusiform was calculated. We then analyzed the relationship between functional activation in the fusiform and its connection probabilities with the rest of the brain, through a multivariate, voxel-by-voxel approach. This approach allowed us to directly test the conjecture that while the locations of face-selective voxels are variable across the population, their extrinsic connections vary systematically with function in each individual, such that the connection patterns alone can predict functional activation. Specifically, a least-squares linear regression was used to model the relationship between each fusiform voxel’s connection probabilities and its functional activation by using a leave-one-subject-out cross-validation approach, or LOOCV (Fig. 1a). The resulting model was then applied to the remaining participants’ connectivity data, and prediction accuracies were tested against two control models and a benchmark model built from a functional group-average. The group-average is commonly used as a way to build face-selective ROIs in fMRI studies21, and thus provides a standard that a connectivity-based method should meet. The control models, designed from random permutations and Euclidian distance (see
Methods), were implemented to evaluate against potential confounds.
NIH-PA Author Manuscript
NIH-PA Author Manuscript
In order to assure that the model is not overly fit to the population it was built from, it is good practice to design a model built from all the participants in the LOOCV, and apply it to a separate pool of observations naïve to the model-building procedure22. We applied such a model to an independent group of participants from a separate study. This second group provided further examination of the generalizability of the models, since their data were acquired with different DWI scan parameters and a different functional task from the first group of participants.
Results
Comparisons between connectivity and control models
After an initial analysis determined that the data possessed sufficient structure for its use in prediction (Supplementary Table 1), we proceeded to build the connectivity models and their controls. A linear regression was trained on the connectivity and fMRI data (faces>scenes) for all participants but one, and the model was applied to the remaining participant’s connectivity data to make predictions of this participant’s fMRI data in the right fusiform gyrus; this was done iteratively across all participants. We calculated the absolute error (AE) per voxel as the difference between the predicted and actual fMRI images, and mean absolute error (MAE) as a measure of accuracy. Table 1 summarizes the MAE’s for each model.
Next, we performed random permutation tests23 to statistically assess the performance of the connectivity model. We built models designed from the same data but with shuffled pairings between connectivity and functional responses, and by repeating this process 5000 times, we generated a distribution of accuracies from random models for each individual. Relative to this distribution, the connectivity models successfully predicted functional selectivity across voxels in 22 out of 23 participants’ fusiform gyri at a threshold of P < 0.001.
The distance from a seed voxel to a target region may potentially bias the connection estimates, since local connections are believed to be more probable than distant ones24, 25. In addition, the lateral wall of the fusiform gyrus tends to be face-selective while the medial wall more scene-selective. The connectivity model could therefore rely on the relative distance of each voxel to each target, which is basically a high-dimensional spatial coordinate frame. To ensure that the results of the connectivity model were not driven by such unintended relationships, we generated distance control models using the same LOOCV method. These models were designed identically to the connectivity model, with the exception that they used Euclidian distance of the fusiform voxels to other brain regions’ center-of-mass, rather than their connectivity. The distance models thus use the same number of predictors as the connectivity models and serve as controls for possible overfitting.
We directly compared the performance of the connectivity and distance models, both across participants (based on MAE) and within participants (based on AE). Across participants, the connectivity model was significantly more accurate than the distance model (two-tailed t-test of connectivity MAE vs. distance MAE, T(22) = −6.44, P = 1.75×10⁻⁶). A direct comparison of the error per voxel at the individual-subject level revealed that the connectivity-based predictions were significantly different from distance in 21/23 participants at a threshold of P < 0.001, all of which were better predicted by connectivity (Fig. 2a).
Comparisons to group-average models
A group analysis was also performed on the whole-brain fMRI data in an iterative LOOCV fashion: a random effects test was performed on the contrast images for Faces>Scenes for all
NIH-PA Author Manuscript
NIH-PA Author Manuscript
but one participant (Fig. 1b). We registered the resulting group-average to the native anatomical coordinates of the participant left out of the group analysis, and calculated prediction errors for the right fusiform. Since group-analyses are standard in neuroimaging, they were chosen as benchmark models that connectivity-based predictions should meet or exceed in order to be considered useful.
We compared model performance and found that the connectivity-based predictions were statistically better than the group-average, across participants (two-tailed t-test of connectivity MAE vs. group-average MAE, T(22) = −4.01, P = 5.94×10⁻⁴). The connectivity model was significantly more accurate than the group-average for 17/23 participants at P < 0.001, whereas the converse was true for only 2 participants (Fig. 2b and Fig. 3). For the remaining 4 participants, the models were not significantly different. Final connectivity models
The connectivity and distance models generated by Group 1 were then applied to a separate group of twenty-one participants, whose connectivity and functional data were naïve to the models. These analyses were performed in a similar manner, except that the regressions were trained on all the participants in Group 1 (23/23), and applied to each participant in Group 2’s connectivity data to produce images of predicted activation. We compared these predictions to each participant’s observed fMRI image (Table 1; Fig. 3). The connectivity model was significantly more accurate across participants than the distance model (T(20) = −6.72, two-tailed t-test, P = 1.53×10⁻⁶). The connectivity-based predictions were
significantly better than distance-based predictions in 18/21 participants at P < 0.001 (Fig. 2c). The models were not significantly different for the remaining 3 participants.
A group-average was generated from all participants’ contrast images to Faces>Scenes in Group 1 and registered to each participant’s own anatomy in Group 2. Across participants, the group-average predictions were significantly less accurate than the connectivity-based predictions (T(20) = −4.80, two-tailed t-test, P = 1.08×10⁻⁴). Comparing the AE within each participant, we found that functional activation was better predicted by connectivity than by the group-average-based model in 16/21 participants at P < 0.001. Only one participant’s fusiform profile was more accurately predicted by the group-average than by the connectivity model, and the models were not significantly different for the remaining 4 participants (Fig. 2d). The analyses above were repeated for face and scene selectivity in the left fusiform with the same results (Supplementary Materials).
In order to investigate which targets made a significant contribution to the final model (Table 2), a model built from only those significant predictors (with all other targets’ beta weights set to 0) was applied to the structural connectivity data of Group 2. The MAE across participants was significantly better than the original connectivity model’s MAE (new model’s MAE = 0.683 ± 0.02; P = 0.038), demonstrating the predictive impact of these regions. Some of the highest positive-predicting regions were right inferotemporal, lateral occipital, and superior temporal, while right lingual and parahippocampal cortices were among the highest negative-predicting regions (Fig. 4).
Spatial relationship of function and connectivity
We calculated the center-of-mass to the best face (inferotemporal) and scene (lingual) predictors in each participant to visualize the spatial relationship between connectivity and function (Fig. 5a). More subject variability was observed in the medial-lateral dimension for the positive, and in the anterior-posterior dimension for the negative functional activation; we therefore calculated correlations between functional values and connectivity strengths along those dimensions respectively. Across participants, centroid locations for
face-NIH-PA Author Manuscript
NIH-PA Author Manuscript
responses significantly correlated with the centroid locations of connectivity to
inferotemporal cortex along the medial-lateral dimension (Fig. 5b, r = 0.46, P = 0.002). That is, individual participants who had a more medial center of functional activation to faces relative to other individuals, also had a more medial center of connectivity to the
inferotemporal target region. Similarly, lingual centroids significantly correlated with scene-centroids along the anterior-posterior dimension (Fig. 5c, r = 0.41, P = 0.005).
To better establish how individual subject variability in connectivity profiles can be sensitive to individual subject variability in functional responses, we tested whether connectivity patterns of one participant can do better at predicting that participant’s functional activation than another participant’s connectivity patterns. Unlike any of the analyses above, this relied on identifying the same voxel spatially across participants, so each participant in Group 2 was registered to MNI space, and subsequently onto each other participant’s native anatomical space. Functional predictions for each participant were then made based on each other participant’s connectivity pattern. A participant’s own
connectivity values were better at predicting their own functional activation than other participants’ connectivity values (T(419) = 11.67, paired t-test, P = 0). Thus, the connectivity model is picking up on relationships between functional responses and connectivity patterns that capture individual variation.
Discussion
The present study provides evidence of a direct relationship between structural connectivity and function in the human brain. Specifically, we demonstrate that the responses to faces within an individual’s right fusiform gyrus can be predicted from that individual’s patterns of structural connectivity alone. This approach further reveals which targets are most influential in predicting function. Voxels with higher responses to faces had characteristic patterns of connectivity to other brain regions that distinguished them from neighboring voxels with lower responses to faces, or higher responses to scenes.
The connectivity model outperformed the random permutation control, indicating that there exists a strong relationship between connectivity and function. Moreover, it outperformed the distance control, suggesting that spatial information alone is insufficient for predicting functional activity and that connectivity offers information above and beyond the
topographic information inherently embedded within it (due to the posited small-world organization of cortical connectivity24,25). The relationship between function and spatial information was highly variable across participants, while the connectivity data was consistent across participants in its relationship with the functional responses. When compared to the group-average benchmark, a standard method of defining face-selective ROIs in fMRI studies, connectivity was a significantly better predictor of the individual’s actual activation pattern in over seventy-percent of the participants. One reason that the group-average did not successfully predict the activation pattern could be due to the high variability of activation loci, relative to the standard template (e.g.26).
While we have treated spatial metrics as potential confounds and controlled for them by using distance and group activation models as controls, future studies may build other geometric models which do predict inter-subject variability in functional activation. For example, detailed models of cortical folding patterns27, myelination28, and/or cortical thickness29 may be detectable with MRI and predictive of functional regions. Connectivity can provide a complementary source of evidence in some cases, whereas in others it may be the only gross morphological marker available.
NIH-PA Author Manuscript
NIH-PA Author Manuscript
Despite spatial variability in functional responses, the connectivity model was highly accurate across participants. We found that the spatial distribution of face- and scene-selectivity varies in tandem with connection strength to their most predictive targets. A direct analysis of subject-to-subject variability revealed that while each participant’s connectivity profile does well at predicting their own functional response, it predicts another participant’s functional responses relatively poorly. Overall, the connectivity patterns appeared highly sensitive to individual variation in function.
While the results from Group 1 are noteworthy, they could be specific to one dataset22. The findings from Group 2 demonstrate that this is not the case: the connectivity model’s predictions from Group 1 were much more accurate than both the distance and group-average models in over seventy percent of the new group of participants. This result was especially remarkable, because the participants in Group 2 had been scanned while
performing a different functional task. The two tasks differed in the type of stimuli presented (1s static images versus 3s movie-clips), type of design (event-related versus block), number of runs (1 versus 3), and scan parameters (also see Methods for other differences). Further, the structural connectivity measures in this second group were acquired using a DWI sequence with half as many gradient directions (30 versus 60), indicating the generalizability of the connectivity model across functional tasks and diffusion sequences.
This analysis also reveals the target brain regions for which connectivity with the fusiform is most predictive of face- or scene-selective activity in the fusiform. Face-selective fusiform voxels were predicted by connectivity with regions that have been previously reported to have a role in face processing, such as the inferior and superior temporal cortices (e.g.30, 31). Scene-selective voxels, on the other hand, were best predicted by their connectivity to key brain areas involved with scene recognition, such as the isthmuscingulate (containing the retrosplenial cortex) and the parahippocampal cortex10, 32, 33. Unlike functional
connectivity, structural connectivity models are naïve to the functional responses of the target regions. Therefore, a region need not be category selective to be connected (and predictive of) selective voxels in the fusiform. For example, unexpected predictors of face selectivity were also discovered, such as the cerebellar cortices. Even though the cerebellum is not commonly considered as part of the “core” or “extended” face processing
network3, 30, 34, tracer35–37 studies have revealed disynaptic connections with extrastriate visual cortices via pons, which tractography is able to reconstruct (see Supplementary Fig. 1,2), and is corroborated by functional connectivity38. Future studies may explore these relationships to further expand on the role of functional responses in components of a structural network. Novel structure-function relationships could be investigated in macaques with functional and connectivity data, and subsequently validated more directly through more invasive techniques involving tracer injections (e.g.39 ,40).
The final connectivity model also provides a framework with which to evaluate the impact of the most predictive targets and their spatial distribution. The model built from only the significantly predictive targets resulted in more accurate predictions than the predictions based on all of the target regions. While some of the best predictors from this model were nearby regions, most of them were distant to the fusiform; additional analyses excluding the fusiform’s neighbors (Supplementary Materials) revealed that while proximal targets are part of the fusiform’s network, they do not fully account for the connectivity model’s performance. Altogether, a distributed network of brain regions characterizes category-specific visual processing in the fusiform gyrus.
The connectivity fingerprint has practical applications, both for defining ROIs independently of a task, and also for exploring group differences in structural connectivity signatures. Researchers or clinicians can apply the relationships discovered here to predict functional
NIH-PA Author Manuscript
NIH-PA Author Manuscript
activation at the single-subject level in populations who do not or cannot have a functional localizer, and should expect that this will be a more accurate prediction than group-based methods. The connectivity model provided here can also be directly compared to a
connectivity model built from participants with specific lesions or conditions. For instance, compromised structural connectivity in congenital prosopagnosics has previously been suggested to play a role in their deficits of face-recognition, in light of their surprisingly normal functional activation in the fusiform41. This type of analysis can shed light on which components (if any) of the fusiform connectional fingerprint are altered or compromised in individuals with congenital prosopagnosia. A similar analysis can be used to explore possible substrates of face-processing differences in autism, normal development, and aging. Future studies can also extend the present methods to other brain regions and contrasts that are commonly used as functional localizers, such as retinotopy in visual cortices, scene-selectivity in the parahippocampal place area10, or expression-specificity in the superior temporal sulcus. In some cases, more complex or nonlinear approaches might better capture the relationship of connectivity and function. We implemented a linear fit in order to provide more parsimonious interpretations and to establish the feasibility of modeling structure-function relationships. Since these relationships are probably not strictly linear in a complex system such as the brain (Supplementary Fig. 3), future work can expand these findings, creating better models, and elucidating a more detailed relationship between connectivity and function. Additionally, voxel-to-voxel tractography may help to more finely
characterize the structure-function relationships identified here.
These findings open a window into the coupling between structural and functional organization in the brain. The operations of a brain region are determined by both its intrinsic properties (i.e., cytoarchitecture) that likely determine the operations that it can perform, and the extrinsic connectivity that defines the input/output relations of that brain region. Neuroimaging can relate localized functions (via fMRI) to input/output patterns of cortical connectivity (via probabilistic tractography) in an individual. The present findings demonstrate that brain structure/function relations can be defined for category-selective functional activation.
Methods
Participants
For Group 1, twenty-three participants were recruited from the greater Boston area between the ages of 19 and 42 (mean age = 27.9 ± 1.06, 12 female). Group 2 included twenty-one participants between the ages of 19 and 44 (mean age = 26.9 ± 1.45, 13 female) and were similarly recruited. Both groups of participants were screened for history of mental illness and were compensated at $30/hr. The studies were approved by the Massachusetts Institute of Technology and Massachusetts General Hospital ethics committees.
Acquisition parameters for Group 1
DWI data were acquired using echo planar imaging (64 slices, voxel size 2×2×2mm, 128×128 base resolution, diffusion weighting isotropically distributed along 60 directions, b-value 700s/mm2) on a 3T Siemens scanner with a 32 channel head-coil42. A high resolution (1mm3) 3D magnetization-prepared rapid acquisition with gradient echo (MPRAGE) scan was acquired on these participants.
We acquired event-related fMRI data (gradient echo sequence TR/TE/flip/volumes/voxel size = 2000ms/30ms/90°/324/3.1×3.1×4mm) while the same participants viewed color images of faces or scenes while performing a 1-back task by responding each time a stimulus repeated. Face stimuli43 consisted of neutral and emotional faces (angry, disgusted,
NIH-PA Author Manuscript
NIH-PA Author Manuscript
and happy). Scene stimuli were all neutral outdoor and indoor scenes44
(http://cvcl.mit.edu/database.htm). Face and scene stimuli were ordered using optseq245 (http://surfer.nmr.mgh.harvard.edu/optseq), an optimization program for jittering trials in event-related experiments.
Acquisition parameters for Group 2
DWI acquisition parameters for Group 2 were different, with 30 directions of diffusion, 64 slices, voxel size 2×2×2mm, 128×128 base resolution, b-value 700s/mm2, but were acquired on the same scanner with the same 32 channel head-coil as Group 1. A high-resolution (1mm3) 3D magnetization-prepared rapid acquisition with gradient echo (MPRAGE) scan was also acquired on these participants.
Stimuli for the functional MRI consisted of 3-second movie clips of faces, bodies, scenes, objects, and scrambled objects. Movies of faces and bodies were filmed against a black background, and framed to reveal just the faces or bodies of seven children, shown one at a time. Scenes consisted primarily of pastoral scenes filmed through a car window while driving slowly through the countryside or suburb. Objects were selected specifically to minimize any suggestion of animacy of the object itself or of an invisible actor pushing the object. Scrambled object clips were constructed by dividing each object movie clip into a 15×15 box grid and spatially rearranging the location of each of the resulting boxes. Pilot testing indicated that a contrast of the response for moving faces versus moving objects identified the same FFA as that identified in a standard static localizer. Further studies in adults show that the FFA responds similarly to movies of faces as to static snapshots of faces46.
Functional data were acquired over four block-design functional runs (gradient echo sequence TR/TE/flip/volumes/voxel size = 2000ms/30ms/90°/234/3×3×3mm). Each functional run contained three 18-second fixation blocks at the beginning, middle, and end of the run. During these blocks, a series of six uniform color fields were presented for three seconds each. Each run additionally contained two sets of five consecutive stimulus blocks (faces, bodies, scenes, objects, or scrambled objects) sandwiched between these rest blocks, resulting in two blocks per stimulus category per run. Each block lasted 18 seconds and contained six 3-second movies clips from each of the five stimulus categories. The order of stimulus category blocks in each run was palindromic and specific movie clips were chosen randomly to be presented during the block. Participants were asked to passively view the stimuli.
fMRI analysis
For Group 1, functional neuroimaging data were analyzed using Statistical Parametric Mapping software (SPM8, Wellcome Department of Cognitive Neurology, London, UK). Preprocessing included slice timing correction, motion correction and linear trend, and temporal filtering with a 128s cutoff. The images were not spatially normalized. Statistical parametric maps (SPMs) of BOLD activation were created using a multiple regression analysis, with regressors defined for the five stimulus categories (neutral, angry, disgusted, happy faces, and scenes). Boxcar functions for each trial type were convolved with a canonical double-γ hemodynamic function (SPM8, www.fil.ion.ucl.ac.uk/spm) to generate each regressor. The resulting maps were spatially smoothed with a 6-mm Gaussian kernel (FWHM), and the t-statistic image was generated per participant for the contrast of Faces>Scenes.
Group 2‘s data were analyzed with FSL software (www.fmrib.ox.ac.uk/fsl/). Image preprocessing was similar to Group 1: images were motion corrected, smoothed (5mm
NIH-PA Author Manuscript
NIH-PA Author Manuscript
FWHM Gaussian kernel), detrended, and were fit using a γ function (δ = 2.25 and τ = 1.25). Data were not spatially normalized. Statistical modeling was then performed using a GLM on the preprocessed functional images. Next, t-maps corresponding to the contrast of interest for Faces>Scenes was overlaid on each participant’s high-resolution anatomical image. For both groups, each participant’s functional image for the Faces>Scenes contrast was registered to his/her diffusion-weighted image. Because we were interested in predicting relative activation values which were independent of task-specific parameters such as the degrees of freedom, we standardized the T-statistic values (x) across the fusiform gyrus per participant. This detrending was performed for each participant j, such that the mean value in the fusiform was subtracted from each voxel’s fMRI value (xij) and divided by the
standard deviation. The standardized value per fusiform voxel (xzij) of participant j was then
used for the subsequent regression models. Tractography
Automated cortical and subcortical parcellation was performed with FreeSurfer47, 48 to define specific cortical and subcortical regions in each individual’s T1 scan, based on the Desikan-Killiany atlas49. Automated segmentation results were reviewed for quality control, and were then registered to each individual’s diffusion images, and used as the seed and target regions for fiber tracking. The resulting cortical and subcortical targets were then checked, and corrected for automatic parcellation/segmentation errors if necessary. There was one seed region per participant, and the 85 target regions were defined as all other automatic parcels, not including the seed. The principal diffusion directions were calculated per voxel, and probabilistic diffusion tractography was carried out using FSL-FDT17, 50 with 25,000 streamline samples in each seed voxel to create a connectivity distribution to each of the target regions, while avoiding a mask consisting of the ventricles.
Regressions
All analyses were performed on subject-specific anatomy, rather than extrapolation from a template brain, except for the group-average models. It is important to note that for the regression models, each observation was an individual voxel in native-space and there was no identifying or matching of spatial location of voxels across participants. Further, the model was blind to the participant each voxel belonged to.
On Group 1, we built a regression model using a leave-one-subject-out cross-validation (LOOCV): the model was trained to predict the standardized fMRI value for each native-space fusiform voxel based on connectivity data concatenated across 22/23 participants, and tested using the remaining participant’s data (Fig. 1a). This was performed iteratively for all participants. For Group 2, the analyses were performed in a similar manner, except that the regressions were performed on all the participants in Group 1 (23/23), and simply applied to each participant in Group 2’s connectivity data to produce an fMRI image of predicted activation. This was then compared to the participants’ own observed fMRI images, and MAE’s were calculated.
Using the same LOOCV method, we trained a regression model to predict T-values of fusiform voxels based on each voxels’ physical Euclidian distance to each other target region’s center-of-mass, rather than each voxel’s connection probability to each target region. In this way, both the connectivity and distance models had the same number of dimensions, and were generated identically except for the information present in each model. We also considered other 85-dimensional spatial metrics, such as distance to the nearest voxel of each target, and found that these measures were highly similar to the present one. We applied the regression coefficients from the distance model generated from
NIH-PA Author Manuscript
NIH-PA Author Manuscript
all Group 1 participants to each participant in Group 2, as described for the connectivity model.
We created random distributions by training models using the observed fMRI images and connection probabilities, but by randomizing the voxel data. We permuted across 5000 random combinations of connection probability to fMRI activation values per participant, and thus obtained a distribution of random MAE per participant. We then performed a one-tailed t-test to determine if the mean of the participant’s random distribution was
significantly greater than the same participant’s MAE for connectivity-based predictions. Each participant’s functional data were spatially normalized into MNI space with FSL and FreeSurfer, checked and corrected for registration errors, and superimposed to create composite maps. For Group 1 cross-validation, we performed LOOCV: a random effects test on whole-brain fMRI data was performed with SPM8 on the contrast images for
Faces>Scenes from all but one participant. The resulting t-statistic image, which was based on all the other participants in normalized space, was applied to the participant left out of the group analysis, and registered back into his/her native-space. We analyzed only the right fusiform gyrus in comparing what the group-average predicted to that participant’s actual fMRI image using measures of MAE (Fig. 1b).
For Group 2, we created the group-average fMRI image using the same method above, but from all Group 1 participants’ observed (actual) fMRI images. This fMRI image was mapped on to each participant in Group 2’s native-space coordinates, and compared to that participant’s observed fMRI pattern.
Accuracy and benchmark comparisons
As a measure of accuracy, we measured the absolute error per voxel (AE, reported in standardized units, s.u.) per participant, by calculating the absolute difference between the predicted and actual values. To statistically compare the performance of the connectivity model to the random and benchmark models, we performed a pairwise t-test per participant across all their fusiform voxels. A criterion threshold of P < 0.001 was used to report the number of participants whose activation pattern was better predicted by one model versus another. Mean absolute error (MAE) was also calculated per participant for each model by averaging the AE across the fusiform voxels. A two-tailed Student’s t-test of the MAE’s per participant was then used to compare models, with the same threshold (P < 0.001) to decide which model’s predictions were significantly better.
Spatial relationship of function and connectivity
We registered the connectivity data for the right inferotemporal and lingual targets to the native-space anatomical image of each participant in Groups 1 and 2, and projected these data to each participant’s native surface vertices using FreeSurfer. The functional data were similarly projected to the surface. We calculated the center-of-mass for the targets with respect to a reference frame fixed at the center-of-mass for each participant’s fusiform gyrus (also on the surface). After partitioning the functionals into positive and negative values, we similarly calculated their centers of mass with respect to the fusiform. We observed more subject variability in the medial-lateral dimension for the positive, and anterior-posterior variability for the negative functionals, and therefore calculated correlations between functional values and connectivity strengths along those dimensions respectively. Since both functional and connectivity centers of mass were calculated with respect to the subject’s own fusiform, the correlations were not biased by cross-subject variability in the boundaries between the seed region and the predictive regions.
NIH-PA Author Manuscript
NIH-PA Author Manuscript
For the direct analyses of individual subject variation, we registered each Group 2
participant’s connectivity data to MNI space, and subsequently onto each other participant’s brain, using FreeSurfer and FSL registration tools. We then applied the final model designed from Group 1 to both the original participant’s and registered participant’s connectivity values. This was done for all combinations of participant pairs (420). We then compared the MAE’s from predictions built from each participant’s own connectivity with those built from another participant’s connectivity across all participants in Group 2. All of the above predictions were restricted to those voxels that overlapped between the original and registered participants.
Supplementary Material
Refer to Web version on PubMed Central for supplementary material.
Acknowledgments
We thank N. Kanwisher, S.Ghosh, F. Polli and the Athinoula A. Martinos Imaging Center at McGovern Institute for Brain Research, MIT. This work was supported by PHS DA023427, NIMH F32 MH084488, NEI T32 EY013935, Poitras Center for Affective Disorders Research, the Simons Foundation, and the Ellison Medical Foundation.
References
1. Johansen-Berg H, et al. Changes in connectivity profiles define functionally distinct regions in human medial frontal cortex. Proceedings of the National Academy of Sciences of the United States of America. 2004; 101:13335. [PubMed: 15340158]
2. Passingham RE, Stephan KE, Kotter R. The anatomical basis of functional localization in the cortex. Nat Rev Neurosci. 2002; 3:606–616. [PubMed: 12154362]
3. Haxby JV, et al. The effect of face inversion on activity in human neural systems for face and object perception. Neuron. 1999; 22:189–199. [PubMed: 10027301]
4. Tsao DY, Schweers N, Moeller S, Freiwald WA. Patches of face-selective cortex in the macaque frontal lobe. Nat Neurosci. 2008; 11:877–879. [PubMed: 18622399]
5. Perrett DI, Hietanen JK, Oram MW, Benson PJ. Organization and functions of cells responsive to faces in the temporal cortex. Philos Trans R Soc Lond B Biol Sci. 1992; 335:23–30. [PubMed: 1348133]
6. Tsao DY, Freiwald WA, Tootell RB, Livingstone MS. A cortical region consisting entirely of face-selective cells. Science. 2006; 311:670–674. [PubMed: 16456083]
7. Moeller S, Freiwald WA, Tsao DY. Patches with links: a unified system for processing faces in the macaque temporal lobe. Science. 2008; 320:1355–1359. [PubMed: 18535247]
8. Kanwisher N, McDermott J, Chun MM. The fusiform face area: a module in human extrastriate cortex specialized for face perception. J Neurosci. 1997; 17:4302–4311. [PubMed: 9151747] 9. Kanwisher N, Stanley D, Harris A. The fusiform face area is selective for faces not animals.
Neuroreport. 1999; 10:183–187. [PubMed: 10094159]
10. Epstein R, Kanwisher N. A cortical representation of the local visual environment. Nature. 1998; 392:598–601. [PubMed: 9560155]
11. Barton JJ, Press DZ, Keenan JP, O'Connor M. Lesions of the fusiform face area impair perception of facial configuration in prosopagnosia. Neurology. 2002; 58:71–78. [PubMed: 11781408] 12. Pitcher D, Walsh V, Yovel G, Duchaine B. TMS evidence for the involvement of the right
occipital face area in early face processing. Curr Biol. 2007; 17:1568–1573. [PubMed: 17764942] 13. McNeil JE, Warrington EK. Prosopagnosia: a face-specific disorder. Q J Exp Psychol A. 1993;
46:1–10. [PubMed: 8446761]
14. Landis T, Cummings JL, Christen L, Bogen JE, Imhof HG. Are unilateral right posterior cerebral lesions sufficient to cause prosopagnosia? Clinical and radiological findings in six additional patients. Cortex. 1986; 22:243–252. [PubMed: 3731794]
NIH-PA Author Manuscript
NIH-PA Author Manuscript
15. McCarthy G, Puce A, Gore JC, Allison T. Face-specific processing in the human fusiform gyrus. Journal of Cognitive Neuroscience. 1997; 9:605–610.
16. Behrens TE, et al. Non-invasive mapping of connections between human thalamus and cortex using diffusion imaging. Nat Neurosci. 2003; 6:750–757. [PubMed: 12808459]
17. Behrens TE, et al. Characterization and propagation of uncertainty in diffusion-weighted MR imaging. Magn Reson Med. 2003; 50:1077–1088. [PubMed: 14587019]
18. Catani M, Jones DK, Donato R, Ffytche DH. Occipito-temporal connections in the human brain. Brain. 2003; 126:2093–2107. [PubMed: 12821517]
19. Seltzer B, Pandya DN. Parietal, temporal, and occipital projections to cortex of the superior temporal sulcus in the rhesus monkey: a retrograde tracer study. J Comp Neurol. 1994; 343:445– 463. [PubMed: 8027452]
20. Gloor, P. The Temporal Lobe and Limbic System. New York: Oxford University Press, Inc., New York; 1997.
21. Gholipour A, Kehtarnavaz N, Briggs R, Devous M, Gopinath K. Brain functional localization: a survey of image registration techniques. IEEE Trans Med Imaging. 2007; 26:427–451. [PubMed: 17427731]
22. Hastie, T.; Tibshirani, R.; Friedman, JH. The elements of statistical learning : data mining, inference, and prediction. New York: Springer; 2009.
23. Golland P, Fischl B. Permutation tests for classification: towards statistical significance in image-based studies. Inf Process Med Imaging. 2003; 18:330–341. [PubMed: 15344469]
24. Hilgetag CC, Kaiser M. Clustered organization of cortical connectivity. Neuroinformatics. 2004; 2:353–360. [PubMed: 15365196]
25. Sporns O, Zwi JD. The small world of the cerebral cortex. Neuroinformatics. 2004; 2:145–162. [PubMed: 15319512]
26. Saxe R, Moran JM, Scholz J, Gabrieli J. Overlapping and non-overlapping brain regions for theory of mind and self reflection in individual subjects. Soc Cogn Affect Neurosci. 2006; 1:229–234. [PubMed: 18985110]
27. Hinds OP, et al. Accurate prediction of V1 location from cortical folds in a surface coordinate system. Neuroimage. 2008; 39:1585–1599. [PubMed: 18055222]
28. Annese J, Gazzaniga M, Toga A. Localization of the human cortical visual area MT based on computer aided histological analysis. Cerebral Cortex. 2005; 15:1044. [PubMed: 15590914] 29. Dickerson B, et al. Detection of cortical thickness correlates of cognitive performance: reliability
across MRI scan sessions, scanners, and field strengths. Neuroimage. 2008; 39:10–18. [PubMed: 17942325]
30. Ishai A. Let's face it: it's a cortical network. Neuroimage. 2008; 40:415–419. [PubMed: 18063389] 31. Kanwisher N, Yovel G. The fusiform face area: a cortical region specialized for the perception of
faces. Philos Trans R Soc Lond B Biol Sci. 2006; 361:2109–2128. [PubMed: 17118927] 32. Epstein RA. Parahippocampal and retrosplenial contributions to human spatial navigation. Trends
Cogn Sci. 2008; 12:388–396. [PubMed: 18760955]
33. Sewards TV. Neural structures and mechanisms involved in scene recognition: a review and interpretation. Neuropsychologia. 2011; 49:277–298. [PubMed: 21095199]
34. Haxby JV, Hoffman EA, Gobbini MI. The distributed human neural system for face perception. Trends Cogn Sci. 2000; 4:223–233. [PubMed: 10827445]
35. Schmahmann JD, Pandya DN. Course of the fiber pathways to pons from parasensory association areas in the rhesus monkey. J Comp Neurol. 1992; 326:159–179. [PubMed: 1479073]
36. Schmahmann JD, Pandya DN. Prelunate, occipitotemporal, and parahippocampal projections to the basis pontis in rhesus monkey. J Comp Neurol. 1993; 337:94–112. [PubMed: 8276995]
37. Glickstein M, et al. Visual pontocerebellar projections in the macaque. J Comp Neurol. 1994; 349:51–72. [PubMed: 7852626]
38. O'Reilly JX, Beckmann CF, Tomassini V, Ramnani N, Johansen-Berg H. Distinct and overlapping functional zones in the cerebellum defined by resting state functional connectivity. Cereb Cortex. 2009; 20:953–965. [PubMed: 19684249]
NIH-PA Author Manuscript
NIH-PA Author Manuscript
39. Dauguet J, et al. Comparison of fiber tracts derived from in-vivo DTI tractography with 3D histological neural tract tracer reconstruction on a macaque brain. Neuroimage. 2007; 37:530–538. [PubMed: 17604650]
40. Peled S, Berezovskii V, Hendrickson P, Born R, Westin C. Histological validation of DTI using WGA-HRP in a macaque. 2005; 1323
41. Thomas C, et al. Reduced structural connectivity in ventral visual cortex in congenital prosopagnosia. Nat Neurosci. 2009; 12:29–31. [PubMed: 19029889]
42. Reese TG, Heid O, Weisskoff RM, Wedeen VJ. Reduction of eddy-current-induced distortion in diffusion MRI using a twice-refocused spin echo. Magn Reson Med. 2003; 49:177–182. [PubMed: 12509835]
43. IASLab. Development of the Interdisciplinary Affective Science Laboratory (IASLab) Face Set was supported by the National Institutes of Health Director’s Pioneer Award (DP1OD003312) to Lisa Feldman Barrett. Available on-line at www.affective-science.org
44. Oliva A, Torralba A. Modeling the Shape of the Scene: A Holistic Representation of the Spatial Envelope. International Journal of Computer Vision. 2001; 42:145–175.
45. Dale AM. Optimal experimental design for event-related fMRI. Hum Brain Mapp. 1999; 8:109– 114. [PubMed: 10524601]
46. Pitcher D, Dilks DD, Saxe RR, Triantafyllou C, Kanwisher N. Differential selectivity for dynamic versus static information in face-selective cortical regions. Neuroimage. 2011
47. Fischl B, et al. Automatically parcellating the human cerebral cortex. Cereb Cortex. 2004; 14:11– 22. [PubMed: 14654453]
48. Fischl B, et al. Whole brain segmentation: automated labeling of neuroanatomical structures in the human brain. Neuron. 2002; 33:341–355. [PubMed: 11832223]
49. Desikan RS, et al. An automated labeling system for subdividing the human cerebral cortex on MRI scans into gyral based regions of interest. Neuroimage. 2006; 31:968–980. [PubMed: 16530430]
50. Behrens TE, Berg HJ, Jbabdi S, Rushworth MF, Woolrich MW. Probabilistic diffusion
tractography with multiple fibre orientations: What can we gain? Neuroimage. 2007; 34:144–155. [PubMed: 17070705]
NIH-PA Author Manuscript
NIH-PA Author Manuscript
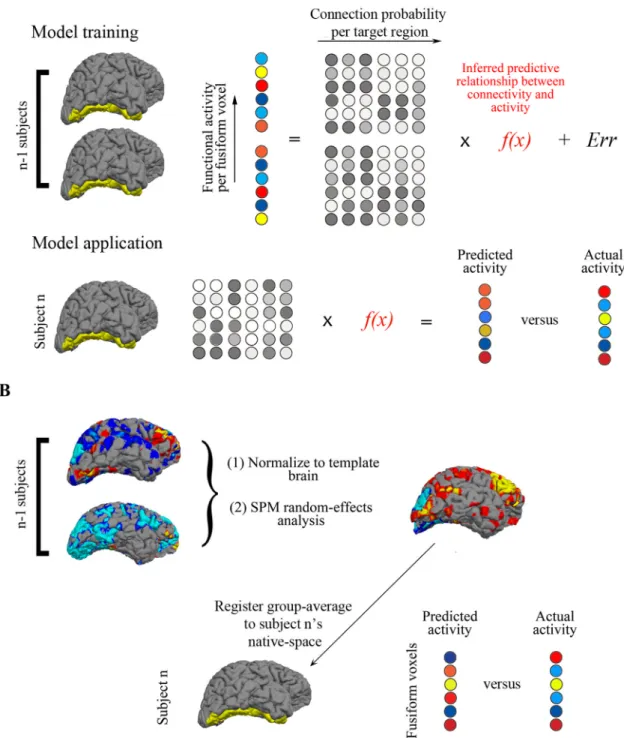
Figure 1. Schematic model design
(a) Linear regression models were trained on all but one participant’s data in Group 1. The 22 participants’ fMRI data for each voxel in the fusiform gyrus are depicted by circles that are color-coded from red to blue, representing their responses to the contrast of Faces >Scenes). Each voxel’s corresponding connection probabilities (for the connectivity model) or Euclidian distances (for the distance model) to each target brain region are depicted by the grayscale circles. The fMRI data and connectivity or distance data from each fusiform voxel for the 22 participants are used to train the model, and the resulting model, f(x), is applied to the remaining participant’s connectivity or distance data, resulting in predicted
NIH-PA Author Manuscript
NIH-PA Author Manuscript
fMRI values for each fusiform voxel. The predicted values are then compared to that participant’s observed fMRI values and the mean absolute error (MAE) is calculated for each participant. The LOOCV is done iteratively through all the participants, such that each participant has a predicted fMRI image based on a regression from all the other participants. (b) Similarly, a LOOCV procedure was also performed for the group-average model, but rather than training a linear regression, each participant’s whole-brain fMRI data was spatially normalized into MNI space, superimposed to create composite maps, and a t-static image was generated for the random-effects analysis. This image was registered to the remaining participant’s native-space, and only the fusiform gyrus was extracted. This predicted activation based on a group analysis was then compared to that participant’s observed activation, and an MAE was computed per voxel.
NIH-PA Author Manuscript
NIH-PA Author Manuscript
Figure 2.
Benchmark comparisons per participant. MAE’s from the connectivity-based predictions are plotted against distance or group-average MAE’s for each participant. Participants above the unity line thus have higher (worse) MAE’s for the benchmark than for the connectivity-based model. Colors reflect the difference between the connectivity-connectivity-based model and the benchmark; hotter colors indicate better performance of the connectivity-based model. (a) For 21/23 participants in group 1, the distance-based predictions had higher (worse) MAE’s than connectivity-based predictions, and no participants’ functional activation was better predicted by distance than by connectivity. (b) The connectivity-based model predicted actual fMRI activation with fewer errors than the group-average for 17/23 participants, while 2 participants’ functional activation was better predicted by the group-average than by connectivity. (c) For 18/21 participants in group 2, connectivity-based predictions better predicted actual activations than distance-based predictions, while no participants’ functional activation was better predicted by distance than by connectivity. (d) 16/21
NIH-PA Author Manuscript
NIH-PA Author Manuscript
participants from group 2 had lower MAE’s with the connectivity model, while 1 participant had lower MAE’s with the group-average model.
NIH-PA Author Manuscript
NIH-PA Author Manuscript
Figure 3.
Actual and predicted fMRI activation to Faces>Scenes in the fusiform gyrus of five example participants. For each participant, actual and predicted activation images (t-statistic values for Faces>Scenes) were up-sampled from the DWI structural image (where all the analyses were performed) to the same participant’s structural scan, and projected onto the
participant’s inflated brain surface. Each row is a single participant; the leftmost column displays the actual fMRI activation pattern in the right fusiform gyrus. The remaining columns illustrate, from left to right, predicted fMRI images from: connectivity, group-average, and distance.
NIH-PA Author Manuscript
NIH-PA Author Manuscript
Figure 4.
Beta weights for each target region from the final connectivity model. Target regions are color-coded from hot-to-cold to reflect positive or negative beta weight values, and projected to the pial surface of an example participant, with the lateral view on the top row, medial view on the second row, and ventral view on the bottom. The highest predictors of face-selective voxels are regions labeled from red-to-yellow, while the highest predictors of scene-selective voxels are those labeled from blue-to-light blue. The seed region is
highlighted in purple. See Results for the anatomical nomenclature of the target regions.
NIH-PA Author Manuscript
NIH-PA Author Manuscript
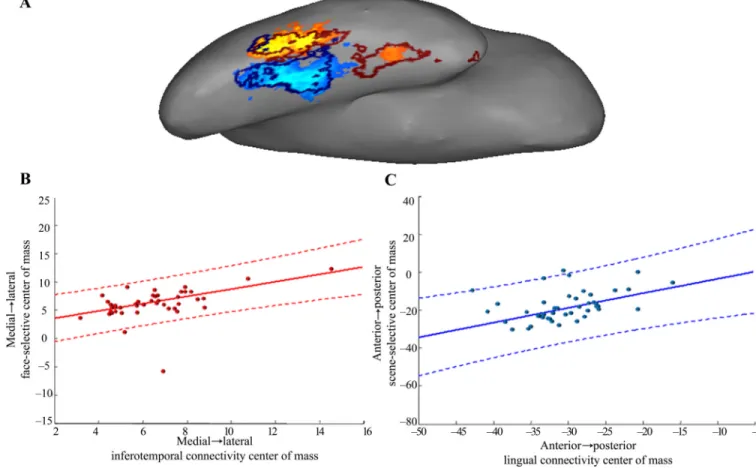
Figure 5. Spatial relationship of function with connection strength to the highest predictors
(a) Functional activation of an example participant, with the thresholded boundaries of inferotemporal connectivity overlaid in dark red, and boundaries of lingual connectivity overlaid in dark blue. (b) Each participant’s center-of-mass of connectivity to
inferotemporal is plotted against their center-of-mass of positively-responding voxels, along the medial-lateral dimension, along which each participant’s connectivity varies alongside face-selectivity. (c) Centroids of lingual connectivity, plotted against centroids of
negatively-responding voxels, along the anterior-posterior dimension. Solid lines in b and c are the least-square fits of these data, and dashed lines are their 99% confidence intervals.
NIH-PA Author Manuscript
NIH-PA Author Manuscript
NIH-PA Author Manuscript
NIH-PA Author Manuscript
NIH-PA Author Manuscript
Table 1
Mean absolute error ± s.e. in standard units for voxels in the fusiform gyrus across subjects for models based on connectivity, distance, their mean permutations, and group-average.
Group 1 Group 2 Connectivity 0.65 ± 0.013 0.68 ± 0.019 Permutation 0.77 ± 0.008 N/A
Distance 1.06 ± 0.066 1.05 ± 0.051
NIH-PA Author Manuscript
NIH-PA Author Manuscript
NIH-PA Author Manuscript
Table 2
List of target regions, along with their coefficients and confidence intervals, which make a statistically significant contribution to the final connectivity model. Positive predictors are listed on the left, negative predictors on the right.
Target Coefficient C.I. Target Coefficient C.I. R inferior temporal 0.1490 0.137 0.161 R lingual −0.3868 −0.399 −0.375 R lateral occipital 0.0978 0.085 0.111 R parahippocampal −0.1373 −0.149 −0.125 R cerebellum 0.0883 0.076 0.100 L fusiform −0.0638 −0.086 −0.041 R superior temporal 0.0809 0.062 0.100 R inferior parietal −0.0636 −0.081 −0.046 L cerebellum 0.0714 0.05 0.093 L lingual −0.0634 −0.077 −0.05 L inferior temporal 0.0635 0.049 0.078 L parahippocampal −0.0425 −0.058 −0.027 R entorhinal 0.0466 0.036 0.058 L isthmus cingulate −0.0417 −0.055 −0.028 R middle temporal 0.0293 0.015 0.043 R post central −0.0396 −0.059 −0.02 R pars opercularis 0.0271 0.007 0.048 R isthmus cingulate −0.0378 −0.051 −0.025 R thalamus 0.0249 0.007 0.043 R lateral orbitofrontal −0.034 −0.052 −0.016 L pericalcarine 0.0215 0.002 0.041 R pars triangularis −0.0289 −0.055 −0.002 L middle temporal 0.0199 0.003 0.036 R hippocampus −0.0266 −0.041 −0.012 L temporal pole 0.0145 0.002 0.027 L hippocampus −0.024 −0.039 −0.009 L lateral orbitofrontal 0.0130 0.001 0.025
R caudal anterior cingulate
−0.0234 −0.043 −0.004 L superior temporal −0.0232 −0.042 −0.004 R amygdala −0.0219 −0.033 −0.010 L paracentral −0.0206 −0.033 −0.008 Brain stem −0.020 −0.035 −0.005 L amygdala −0.0152 −0.027 −0.004