Ambient Displays:
Information Visualization through Physical Interfaces
Sandia Ren
Submitted to the Department of Electrical Engineering and Computer Science in Partial Fulfillment of the Requirements for the Degrees of
Bachelor of Science in Computer Science and Engineering
and Master of Engineering in Electrical Engineering and Computer Science at the Massachusetts Institute of Technology
May 19, 2000
C
2000 Sandia Ren. All rights reserved.The author hereby grants to M.I.T. permission to reproduce and distribute publicly paper and electronic copies of this thesis
and to grant others the right to do so.
MASSACHUSE OF TECH
JUL
2
LIBRJ
Department of Elec6fcal Engineering and Computer Science May 19, 2000 d by Hiroshi Ishii Thesis Supervisor Accepted by Arthur C. Smith Chairman, Department Committee on Graduate Theses
Va
T INSTITUTE NOLOGY7
2000
ARIES
Author CertifieAmbient Displays:
Information Visualization through Physical Interfaces
Sandia Ren
Submitted to the
Department of Electrical Engineering and Computer Science
May 19, 2000
In Partial Fulfillment of the Requirements for the Degrees of Bachelor of Science in Computer Science and Engineering
and Master of Engineering in Electrical Engineering and Computer Science
Abstract
Ambient Displays are a means of interfacing humans with digital information in our peripheral perception. They present information through subtle changes in movement, light, and sound that can be processed in the periphery of our attention. This thesis documents the various steps taken
towards making some headway into the potential use of these informative physical interfaces. The first was a creation of a toolkit with which ambient displays can be quickly developed and configured. Displays were then designed, implemented, and evaluated for four application domains: stock market activity, website visitor tracking, natural wind movement, and network activity. The process of creating the displays led to a number of initial conclusions about the design of ambient displays. The work described here is meant to be a starting point for user evaluations that will complete the
evolution of ambient displays.
Thesis Supervisor: Hiroshi Ishii
Acknowledgements
This thesis would not have come together without the help of many to whom I owe my deepest thanks and appreciation.
Hiroshi Ishii
For giving me the chance to venture into this unfamiliar area and for his strong guidance, support, and belief in me along the way.
Phil Frei, Jay Lee, Ali Mazalek, James Patten, Brygg Ulmer
For the ideas, the brilliance, and the friendship that have made them a wonderful group of people I am blessed with the chance to work with.
Phil Frei
For all his work in bringing the pinwheels to life, for his creativity and good sense of design, and for being tall enough to reach the pinwheels for me.
Brygg Ulmer
For providing me with many of the resources I needed to create the displays and for the long discussions that have shone much light on my research.
Jay Lee
For his sketches that are in this document and for bringing me into TMG.
Victor Su
For opening the door to this opportunity for me, for his unending patience to my equally unending list of questions, and for his friendship and all his "yes sandia?"s over the past two years.
Rujira Hongladaromp
For picking up where Victor left off, for his diligence and good work in all of my projects, and for his sense of humor.
Seye Ojumu
For doing the mundane job of assembling all the pinwheels without complaint.
Ali Pearlman
For her work in creating the pinwheel and various display structures.
Muriel Waldvogel, Jeffrey Huang
For their enthusiasm in bringing the pinwheels into the Swisshouse and their renderings and documents that are in this thesis.
Rob Poor
For all his help and suggestions in the creation of the pinwheels. The pinwheels would not have come about so successfully without him.
Andy Wheeler
For helping a frustrated Sandia put together the first pinwheel board and for teaching me to solder.
Laurie Qian, Matt Debski, Duncan Bryce, Charatpong Chotigavanich, Tim Lu, Greg Bollrud, Andy Wheeler, John Gavenonis, Tim Shiau, and all my friends
For their unconditional friendship, care, and encouragement that has gotten me through this hectic year.
Charles Lee, Lawrence Wang, Jeff Hsing, Alex Shing, and all of Eyeshake For putting up with my schedule and for being such a fun group of people.
Dad, Mom, and Abraham
For creating a warm nest of love, strength, trust, and understanding, and giving me a happy and loving home.
Table of Contents
Title Abstract Acknowledgements Table of Contents Table of Figures 1 Introduction 2 Background3 Pinwheel Development Toolkit
3.1 Hardware & Structure 3.2 Software API
4 Applications
4.1 Interface Design Criteria 4.2 Graphical User Interface
4.3 Application I: Stock Market Activity 4.4 Application II: Website Visitor Activity 4.5 Application III: Natural Wind Movement 4.6 Application IV: Network Activity
5 Discussion 6 Future Work 7 Conclusion Appendices A B C D References Circuit Schematics
Pinwheel Structure Components Pinwheel API Swisshouse Floorplan
1
2 3 5 6 8 10 15 15 24 30 30 31 32 43 55 65 73 83 88 89 89 91 96 111 112Table of Figures
2 Background2.1 ambientROOM media 10
2.2 WaterLamp 12
2.3 Pinwheels 12
3 Pinwheel Development Toolkit
3.1 Overall System Architecture 16
3.2 Block Diagram of Pinwheel Circuitry 18
3.3 Motor Driver Truth Table 19
3.4 Sample Motor Behavior 19
3.5 Pinwheel Assembly Process 21
3.6 Modular Dependency Diagram of API classes 25
4 Applications
4.1 Stock Price Fluctuations in a day 33
4.2 Possible Stock Portfolio Ambient Display 33
4.3 Volume Activity in a day 34
4.4 Possible Timeline Arrangements 35
4.5 Mapping volume changes to pinwheel speeds 37
4.6 Initial Stock Tracker GUI 38
4.7 Individual Stock Tracker GUI 39
4.8 Close up of Single Array 40
4.9 Stock Market Ambient Display 41
4.10 Directionally Arranged Pinwheels 44
4.11 Time Zone Arrangement 45
4.12 Tree Structure Arrangement 47
4.13 Website Tracker System Architecture 48
4.14 Mapping number of visitors to pinwheel speeds 50
4.15 Initial Website Tracker GUI 51
4.16 GUI for Configuring Website Tracker 51
4.17 GUI Displaying Visitor Information 52
4.18 Rendering of Ambient Display in Swisshouse 53
4.19 Ambient display showing wind direction at various time points 56 4.20 Vector Calculations for Wave Effect Algorithm 58 4.21 Counter Increment Time vs. Natural Wind Speed 59
4.22 Numerical Angles of Directions 60
4.23 Conversions for Area Rotations 61
4.24 Horizontally Oriented Matrix Display 62
4.25 Vertically Oriented Matrix Display 62
4.26 Scattered Clusters Display 63
4.27 'Daily' Router Activity 66
4.28 Initial Network Activity GUI 69
4.29 Tracking Router Activity 70
4.30 Ambient Display for Network Activity 71
5 Discussion
A Circuit Schematics
A.1 Pinwheel Board 89
A.2 Serial Port Interface Circuit Board 90
B Pinwheel Structure Components
B.1 Pinwheel Structure Components 91
B.2 Finished pinwheel circuit board 92
B.3 Front view of Pinwheel Container 92
B.4 Side view of Pinwheel Container 92
B.5 Back view of Pinwheel Container 93
B.6 Front view of container with motor 93
B.7 Back view of container with motor 93
B.8 Fully stuffed pinwheel container 94
B.9 Front view of pinwheel 94
B.10 Side view of pinwheel 95
D Swisshouse Floorplan
1
Introduction
Technology these days presents most of its digital information as "painted bits" on rectangular flat screens. This is restrictive in two ways; it confines the user's focus to a certain space and is only informative if given a significant amount of attention. In this thesis, we present ambient displays, physical interfaces that overcome these restrictions by presenting information in our architectural
space through subtle changes in movement, light, and sound that do not require as much focused attention. They are derived from natural ambient displays that awaken our senses and make us aware of events occurring that we are not directly involved in. For example, the sound of rain informs us of the weather; it does so without requiring us to focus our attention on it; rather it is in the periphery of our attention and subconsciously makes us aware of the rain. Whether or not we want to act upon this awareness is then up to us.
Ambient displays function in a similar manner. They were designed to take advantage of the human ability to process events in the background of our awareness [2]. With ambient displays, users can be aware of states of things that are important to them without having to devote constant attention to them. While they normally reside in the background of a user's attention, ambient displays also have the ability to move to the foreground of attention when the information they are presenting is in some extreme state, thereby alerting the users when these extremes occur.
Ambient displays are made up of kinetic physical objects called ambient fixtures, which can be used either individually or as a group. One such ambient fixture is the pinwheel, which, metaphorically speaking, spins in a "bit wind". This is the fixture currently being used in our ambient displays. By laying out pinwheels in various arrangements, we create displays that use the entire physical
environment as an interface between humans and online digital information. With ambient displays, the various sources of information that normally compete for space on a small screen can present themselves throughout one's architectural space. The space can then convey information that smoothly moves into the user's center of attention when needed and fades into the periphery when not in use [3].
Ambient displays can be all around us and are suited for many different environments. They fit well in a home environment where people feel the need to be connected to loved ones that are
geographically distant from them. They are also suitable for environments where many streams of information need to be constantly monitored. Because of their ability to move to the foreground of a
user's attention, they can be used, for example, in aviation cockpits or power plant control rooms, to signal when something is wrong [1].
Using these ambient physical interfaces to visualize information is a largely unexplored area. The general direction of this thesis was to make some headway into this area by studying how these displays may be used. Three specific research goals were identified. The first was to create a technically sound infrastructure for the pinwheels, to allow for quick and flexible development of robust ambient displays. The second was to study what kinds of contents were appropriate for these displays, i.e. which application domains it would make sense to use them for. The last goal was to study how the pinwheels may be used to map information in these different domains. This involves looking at how the combination of the kinetic motion and layout of the pinwheels may create interfaces that are meaningful and informative. To accomplish these goals, a number of displays were designed, implemented and evaluated. A toolkit was first created that can be used to quickly develop and configure ambient displays. This toolkit was then used to develop ambient displays for four specific application domains: 1) Stock Market Activity, 2) Website Visitor Activity, 3) Natural Wind Movement, and 4) Network Activity. Through the process of creating these displays, we were able to draw some conclusions about the use of ambient displays.
This thesis will explain the steps taken to achieve the three goals and discuss the lessons learned in the process. Section 2 discusses the background research and ideas among which ambient displays were born. Section 3 describes the different components of the toolkit and how they fit together.
Section 4 looks at each of the ambient displays that were built and discusses both the design
considerations behind each of them and their implementations. Section 5 presents some conclusions drawn based on the building of the displays. Section 6 presents a next step for research in ambient displays. Section 7 concludes the thesis by summarizing the findings.
2
Background
Ambient displays grew out of the research being done at the Tangible Media Group at the MIT Media Lab. This next section will discuss this research and the projects that eventually led to the current ambient displays. This section will also look at the research that has been done in the area of peripheral awareness and information visualization for both are important characteristics of the displays.
2.1
Tangible Bits
The idea of using physical objects to convey information evolves from a "Tangible Bits" vision where tangible interfaces are used for human computer interaction [4]. They bridge the digital world with the physical world by coupling bits with everyday physical objects. In this way, information can be brought off the flat rectangular screens and into our physical environments. With tangible user interfaces, it is expected that people can use the skills that they have developed and that feel natural to them to physically manipulate digital information. The other key idea of tangible bits is to make users aware of information at the periphery of their perception. Ambient Displays were born out of these two key concepts [1].
2.2
ambientROOM
The ambientROOM developed previously by the Tangible water -natural Media Group explored the ideas behind the Tangible Bits ripples concept. It was developed as a platform for expressing
digital information with ambient media. Ambient media patcles includes environmental light, sound, and movement that can
be processed in the background of a person's peripheral bottles awareness [1]. It can be used to inform people of events and
to give people a sense of community. People have a need to
Figure 2.1: ambientROOM media feel connected to loved ones especially when they are apart;
ambient media can be used to create a persistent yet non-intrusive connection with others. The following are some of the ambient media that were a part of the original ambientROOM [1].
Water Ripples
The actions of another can be manifested as the motion of a solenoid in a shallow water tank. This motion causes water ripples whose shadows are then reflected onto the ceiling with a lamp. A constant rippling gives people the feeling that another is active and around them.
Active Wallpaper
Movement of illuminated spots on the wallpaper can represent activity in a remote work area. The motion of the spots is directly correlated to the level of activity in the work area, providing a display of remote activity. This sort of ambient media unobtrusively makes people aware of things that are going on outside the confines of the ambientROOM.
Ambient Sound
When sounds of dry-erase pens rubbing against a whiteboard are heard, people become
subconsciously aware that there is activity in a work area. This is a common sound in a workplace, so transmitting it into the room at a low volume does not disturb the inhabitant and also conveys remote activity.
2.3
Ambient Fixtures
Ambient fixtures are an extension to the ambient media of the ambientROOM. They are standalone kinetic ambient media. While the ones in the ambientROOM were restricted to being inside, ambient fixtures allowed the externalization of the media into open space, thereby allowing many people to benefit from them at once [2].
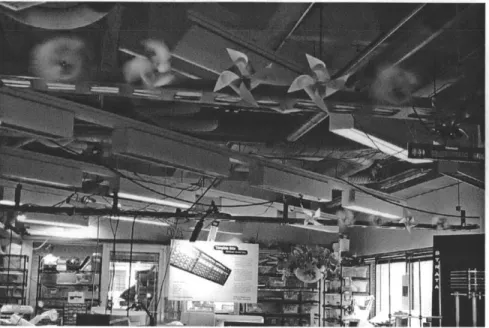
The Water Lamp (Figure 2.2) is an extension of the water ripples of the ambientROOM. It consists of a light that shines up through a pan of water, which is set in motion by changing information. As the water moves, different patterns of light are projected onto the ceiling above the lamp. The pinwheels (Figure 2.3) evolved from the idea of using airflow in the ambientROOM. The flow of air itself is difficult to control, but visualizing the airflow turned out to be something that could be used to convey information. Thus, the pinwheels are spun by a "bit wind" of digital information that controls the rate and direction of the pinwheels. Compared to something like the WaterLamp, the pinwheels are good fixtures to build large displays out of because of their size and the wide range of possibilities for interfaces of multiple pinwheels. The "bit wind" is also representative of information; the wind flows through the pinwheels similar to the way digital information does. The displays built for this thesis were all made up of pinwheels.
Figure 2.2 Figure 2.3
WaterLamp Pinwheels
photo by photo by
Andrew Dahley Webb Chapell
Through the design of ambient fixtures, three main lessons were learned that can be applied to ambient displays as well [1,2]. One was that ambient displays must translate digital information into a pattern that successfully presents the information. Secondly, location of ambient fixtures is important because of their persistency. People learn to look for them in a certain place so placing them well in the architectural space is essential. Lastly, the threshold at which attention transitions from
background to foreground is an open design issue that should be looked into. This thesis continues the research in these three areas.
2.4 Information Visualization
Information visualization is defined as the use of computer-supported, interactive, visual
representation of abstract data to amplify cognition [8]. Quite a bit of research has been done in the area of graphical information visualization. All sorts of frameworks have been developed for visualizing data. COOL, for example, translates textual objects and relations into pictorial
representations [9]. With the advent of the Internet, much research has been done in visualizing vast amounts of data for the web [11]. Evaluations have been done on the effectiveness of text, 2D, and 3D visualizations [10].
Not as much research has been done in regards to physical interfaces for information visualization. However, some of the ideas for graphical interfaces can be applied to physical interfaces as well. For example, metaphors are essential in both types of interface design [6]. Awareness of the use of metaphors can make displays more effective in communicating information to a diverse group of users because they make data easily recognizable, understood, and remembered. They achieve
Research in the area of architectural spaces as information spaces has shown that the placement of "information objects" in relation to other physical objects depends on many factors [5]. One is the size and area needed to display all the information. A second is the need for persistency and visual accessibility to the objects in the space. A third is the various ways to convey relationships between multiple objects. One last factor is the ambient information in the space that can provide background and context cues.
2.5
Awareness Studies
An essential characteristic of ambient displays is their reliance on people's peripheral awareness. Awareness is essential in coordinating collaboration in shared workspaces; people need to know
events and activities of other people in the workspace. Our concept of ambient media was motivated by the Fields and Thresholds work of Dunne and Raby (1994) and the Live Wire of Jeremijenko [1]. With our ambient displays, awareness is not limited to other people's activities but also extends into
awareness of events that are happening at a more global level - for example, stock market activity and wind movement.
The AROMA project (Pederson & Sokoler, 1997) researches ideas around peripheral awareness [13]. They believe that people have developed skills in reading their environment, especially those for
everyday needs. For example, the urban citizen maintains awareness of the neighbors by the soundscape of the apartment building and neighborhood. People in office spaces make good use peripheral awareness - we are aware of the comings and goings and activities of our colleagues without paying focused attention on them.
There are also various cognitive science theories related to ambient displays. Many were studied during the development of these displays [1]. One is the ecological perspective of psychologists like
J.J.
Gibson[15] and Ulric Neisser [16]. They describe perception as an active task that humans participate in inside their environment [1]. Our design of ambient displays has also been heavily influenced by attention studies on notions like the "cocktail party effect" [14]. This is a person'sability to selectively move his or her attention around a busy environment. Ambient displays aim to take advantage of this ability. Other attention studies include those by Treisman [18] and Rensink [17]. Treisman showed that information does not necessarily have to be in the foreground of a person's attention in order to be processed. Rensink and others have performed experiments to show how perception is influenced by attention. They have been successful in showing how attention works at a basic level but not with more complex surroundings [1].
2.6
Related Work
There have been a few related works in the area of ambient media. Perhaps one of the most noted ones is Natalie Jeremijenko's "Live Wire" that she created when she was an artist in residence at Xerox PARC. It consists of a single string that moves in response to network activity. Thus, it alternately waves calmly or shakes violently throughout the day, depending on the traffic load on the local computer network. The Live Wire has many of the same characteristics as our ambient displays.
The AROMA project by Elin Pedersen and Tomas Sokoler attempts to mediate the same awareness that people who are located physically close are effortlessly able to maintain among people who are geographically distant [13]. They explore people's ability to peripherally update a sense of our social and physical context. Towards their goal, they have developed a set of technologies that they call "an augmentation of existing technologies" [13]. They explore the use of abstract representations to peripherally convey a sense of remote presence. Their initial findings suggest that it is possible to make sense of remote activity even with primitive activity displays and that symbolic representations can be processed peripherally to convey a sense of remote presence [13, 19]. This project also explores many of the same ideas behind our ambient displays and its results are encouraging for the use of ambient media.
Audio Aura is a project whose goal is to provide serendipitous information via background auditory cues that are tied to people's physical actions in the workplace [7]. A project by Elizabeth Mynatt, Maribeth Back, and Roy Want at Xerox PARC, it explores the usage of audio cues to connect a person's activity in the physical world to information from the virtual world. It aims to leverage the human ability to peripherally process audio to be aware of the state of things around us and thus aimed to develop periphery displays that are not physically distracting. Towards this goal, a number of sonic landscapes were prototyped in VRML worlds. Three different scenarios were explored: 1) entering a bistro gives audio cues about new email, 2) an audio cue for visitors to indicate how long the person they intended to visit has been out of the office, and 3) a group pulse that represents the collective activity of individuals in a group. Initial user reactions were positive. Users found the sound choice to be good in general and that the sounds generally remained nicely in the periphery [7]. Again, this project ties in nicely with the goals of our ambient displays, the main difference being that its focus is more on audio effects while ours is more on visual ones.
3
Pinwheel Development Toolkit
We envision having ambient displays everywhere and used by everyone. Thus, it would be ideal if users could create displays easily and quickly without having to understand the low-level workings of the pinwheels. To that end, we created a toolkit with which users can develop ambient displays. The toolkit comprises a hardware component that consists of the circuitry needed to run the pinwheels, a structure that is used to hold all the pinwheel components, and a software API that abstracts away the low-level implementation of the pinwheels and allows developers to work at a higher and more understandable level. This section describes the different components of the toolkit, discusses how well they work, and suggests some possible future additions to them.
3.1
Hardware & Structure
The hardware and structure component of the toolkit involves circuitry that gives the pinwheels the ability to spin at different speeds and a container and mechanism for assembling the pinwheels and connecting them to the data. Two circuit boards were implemented, one to run an individual pinwheel and another to interface between the computer serial port and the pinwheels. A container was created that snugly fit the motor and circuit board. The hardware and pinwheels structure were designed with fellow Tangible Media Group grad student Phil Frei with the help of Rob Poor of the Personal Information Architecture (PIA) Group at the Media Lab.
3.1.1 Design Considerations
To create ambient displays that serve their purpose well, the following were design criteria that were felt to be necessary for the hardware and structure to fulfill.
0 Robustness
An important aspect of ambient displays is their persistency. Thus, the circuitry behind the pinwheels needed to most importantly be robust. The usefulness of a display is quite dependent on its accuracy - a constantly failing circuit board would defeat the purposes of the display.
* Small and Contained
Regular pinwheels are attached to a thin rod that is almost invisible, so what one mostly sees is the spinning pinwheel. It was important that adding a motor and a circuit board did not change this
effect by adding too much bulk to the pinwheel. This required the board to be small and for the pinwheel container to hold the parts compactly.
* Flexible
Many interfaces are possible with pinwheels, so it was necessary for the overall system to be flexible enough to allow the pinwheels to be arranged in any manner. The most form-limiting factor of an ambient display is how the pinwheels are connected to the data. Thus, an unrestrictive method for doing so was needed.
9 General
To allow for future development of other ambient fixtures, we aimed to design the board and structure to be general enough so other ambient fixtures could be implemented with the same electrical and mechanical base.
3.1.2 Implementation
3.1.2.1 System Overview
Given the design criteria listed above, the following system structure was chosen:
Serial Data
6 6 6
Serial Port / Pinwheels interface circuitry Serial Power Pinwheel Ground Circuit Ground Board Power LSerial
Figure 3.1: Overall System Architecture
The pinwheels are driven by instructions that are generated by the Java program and sent through the serial port. The first circuit board takes in the serial data and bundles it with power and ground signals to create a six-signal bus that serves as the data source for the pinwheels. The pinwheel circuit boards are connected to the bus via telephone cables that connect them to each other and connect
the interfacing circuit board to the first pinwheel. Each pinwheel listens to the bus and acts only when an instruction specific to itself passes by on the bus. All other instructions are ignored.
As can be seen from figure 3.1, the bus consists of six signals but only has three distinct signals. Since this bus is the only source of signals for each pinwheel board, doubling each signal gives each board a stronger signal, increasing the robustness and stability of each pinwheel. Making the bus
symmetrical prevents human errors such as plugging cables in incorrectly that may cause damage to the boards.
With this set up, numerous pinwheels can be daisy chained together to form a large ambient display since a pinwheel merely has to be connected to one other pinwheel to receive data. This set up also allows for flexibility in design because it imposes little restriction on the way pinwheels are laid out.
3.1.2.2 Serial Port Interface Circuitry
The serial port interface circuitry is the board that resides between the computer and the first pinwheel. Its main function is to convert the +/-10V serial signals from the computer to the
0-5V
signals used by the microcontroller on the pinwheel circuit board. After doing so, it bundles the serial signal with power and ground to create the six signal bus described in the previous section.All communication with the pinwheel boards is done using the RS-232C standard for serial
communication. The most common data format of the RS-232C standard, known as 8N1, is the one used in this system. It has a start bit, then has 8 bits of data, and ends with a stop bit. There is also no parity checking. The start bit is a transition from a logical HIGH to a logical LOW while the stop bit is the opposite, with a transition from a logical LOW to a logical HIGH. Other data formats have a
different number of data bits and more than one stop bit. The other parameter for serial communication is the baud rate. The pinwheels use a baud rate of 2400, meaning that the time needed to send one bit is approximately 417gsec. With 8N1, 10 bits are sent for one byte of data so one byte would take 4.17msec to transmit.
On the microcontroller side, all serial communication signals are in the range of 0-5V. On the RS-232 side, the signals range from -10 to 1OV. To perform the conversion between +/-10V and 0-5V, a MAXIM Max233 chip is used. Usually, a charge pump is used to produce the +/-10V for the RS-232 specs. The Max233 includes the whole charge pump in the chip, so no external capacitors are needed, making it a good solution for converting between the two voltage levels. The reason the
RS-232 standard has increased voltages is because of the amount of noise which may result from having long cables. They are not necessarily needed in all applications, but since it is quite possible that the pinwheels may be situated quite a ways away from its source computer, having the Max233 will help reduce the chance of noise causing any problems.
The amount of power used by a display is dependent on the number of pinwheels being driven by the power source. A minimum of 9V is needed to drive one pinwheel, 10V have successfully run 10 pinwheels, and 12V was required for 20. The original plan was to use a 9V battery for power but that did not work well because the battery drained out quite quickly. A DC power supply is currently being used, so the amount of power being fed to a display can easily be adjusted.
3.1.2.3 Pinwheel Circuitry
The pinwheel circuit board is 3.8cmx2.2cm in size and contains three main components. One is a microcontroller pic chip that reads, interprets, and acts on data from the bus. The second is a bi-directional motor driver that controls the pinwheel motor. Its last component is a voltage regulator that converts the power signal from the bus, which is of at least 9V, into the appropriate 5V signal needed by the pic chip and motor driver. The following is a block diagram of the board. The schematic can be found in appendix A. A picture of the finished board can be found in appendix B.
6/ 5V
VsrC-/Bus0 Data 05V5VM
Rj2Vsrc Voltage INlout-
-: IN1 ouT I Motor 6/ Gnd Re ulator Gn IN20u :IN2 OUT2
/Bus PIC12C672 Gn-MLB1638M
RJ12 5L
Figure 3.2: Block Diagram of Pinwheel Circuitry
The telephone cable ends plug into the RJ12 connectors, giving the board the necessary bus signals.
Motor Driver
The motor driver we are using is an LB1638 saturation bi-directional motor driver for low-voltage applications. This driver is a good choice in many ways. It is small and its bi-directionality allows the pinwheel to be spun in both directions, giving an extra dimension that can be used for representing information. It also has low saturation voltage and drains little current when in standby mode, which is advantageous since the pinwheels are often not moving.
The motor driver takes in two digital input signals and outputs two signals that set the motor in the mode determined by the following table:
IN 1 IN 2 OUT 1 OUT 2 Mode
H L H L Forward
L H L H Reverse
H H L L Brake
L L OFF OFF Standby
Figure 3.3: Motor Driver Truth Table
A method called pulse width modulation (PWM) is used on the inputs to vary the motor speeds. It creates pulses in the input signals. The pulse widths, also known as the duty cycle, can vary from zero to 100 percent of the waveform period of the signal. The following figure shows IN1 with a 50% duty cycle and IN2 with a 0% duty cycle.
IN 1
IN 2
Mode Forw Stdby Forw Stdby Forw Stdby Forw Stdby
Figure 3.4: Sample Motor Behavior
With these inputs, the motor would appear to be spinning at half speed because it is only spinning intermittently, in this case, only half the time. If IN1 had a 100% duty cycle instead, the motor would spin forward at full speed. By varying the duty cycle, the motor can be made to spin at different speeds.
12C672 Microcontroller Pic Chip
The function of the pic is to read in the serial data, determine if it is an instruction for the particular pinwheel it resides on and if so, output signals to the motor driver according to the instruction. If the instruction does not pertain to its pinwheel, the pic takes no action. The pic code was based on the code Rob Poor wrote for Nami, a project of the PIA group.
Instructions are in the form "**pffbb" where
* leader character for start of instruction (there may be more than one) p unique character id of the pinwheel which this instruction is for
ff two hex chars representing the speed to associate with IN1 to the motor driver bb two hex chars representing the speed to associate with IN2 to the motor driver
To distinguish between the pinwheels, each one is given a unique id, which is used to indicate instructions that are for it. Speed is represented with two hex characters, making the minimum speed '00' and the maximum speed 'ff'. Setting the speed to be a number x, where 0 x 5 256, will give the signal a duty cycle of (x/256)(100)%. In other words, the length of the input pulse is directly
proportional to the speed specified in the instruction. This form of instruction does not perform any error checking, thus it is possible that an instruction will be sent that causes both IN1 and IN2 to be high, sending the motor into lock mode. It is important that no such instruction is ever sent by the computer. The software API created as the other half of the pinwheel development toolkit prevents this from happening by layering the API so that developers do not have to deal with low-level instructions.
The pinwheels receive instructions through serial communication. Specific details about the serial communication are described in the serial port interface circuitry section. Here, the method the pic uses to read in the data will be discussed. This particular microcontroller does not possess serial hardware so the serial data is read in bit by bit. The code first looks for a start bit, which signifies that there is data on the serial port. Once a start bit is detected, the data characters are pieced together bit by bit (8 bits/character). Once a character has been assembled, the pic either checks to see if it is a leader character '*' or, if it is already in the middle of an instruction, stores the character in its relevant variable. This serial sampling code is called once every 69.444 gsec.
Once the id part of an instruction has been assembled, the pic immediately checks to see if it is the same as its own id. If it is, instruction assembly continues and variables are set to the new values specified by the instruction. If not, the pic goes back to waiting for a start bit.
To create pulsed outputs that become inputs to the motor driver, two counters are kept, one for IN1 and another for IN2. If the counter is greater than zero, then the output is high, otherwise it is low. The initial values of the counters are the speeds specified by the instructions. They are decremented every 34.7 psec (if the current value is greater than zero) and reset every (34.7gsec)(256) = 8.89msec. For example, if the instruction were **A2fOO, INicount would start at 32 and IN2count would start at 0. INlout is high for (32)(34.7) = 1.11msec, at which time it reaches zero and remains low for the next (256-32)(34.7) = 7.78msec. INicount is reset to 32 at that time and the whole cycle occurs again. The resulting INlout is a pulsed signal with a (32/256)(100) = 12.5% duty cycle. IN2count is always zero, making IN2out always low. INlout and IN2out are fed directly into the motor driver's IN1 and IN2 inputs, which spin the motor at, in this case, a relatively low speed.
Through the combined methods of sampling the serial line, assembling the instructions, setting, decrementing, and resetting the counters, the microcontroller can successfully read in data from the serial port and produce outputs to the motor driver that spin the motor at speeds specified by the instructions.
Voltage Regulator
The components on the board require power signals of two different voltages, one of at least 9V to run the motor (used by the motor driver) and another of 5V to power the pic and the motor driver. If both signals were passed in through the bus, then either the bus size would have to increase or the symmetry of the bus would be lost. Since neither of these should happen, a voltage regulator was added which converts the power signal from the bus to a 5V signal.
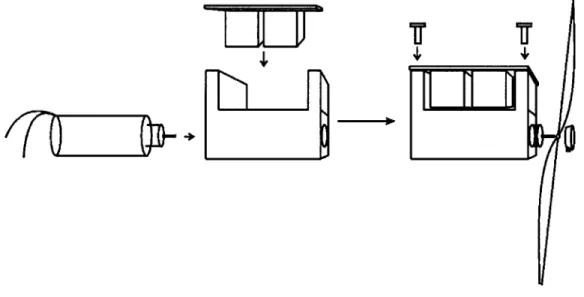
3.1.3 Pinwheel Structure & Assembly
As mentioned above, a small and contained method of assembling the pinwheels was needed. Phil Frei, with the help of Ali Pearlman designed a 4.28cm x 3.35cm x 2.29cm rectangular container which compactly holds the motor and the pinwheel circuit board and provides a mechanism for fastening the paper pinwheel onto the shaft of the motor.
Figure 3.5: Pinwheel Assembly Process
The motor slides into a cylindrical hole in the bottom half of the container and the board fits in on the top. The wires of the motor fit into a ridge in the back of container and are soldered into two holes at the back edge of the board. Two plastic screws hold the board in place. When the motor is inside the container, its shaft protrudes out of a hole in the front of the container. The paper
pinwheel slides onto the shaft and is fastened with a shaft collar. Pictures of the pinwheel components can be found in appendix B.
Given the rectangular shape of the container, the pinwheels can easily be mounted in many
orientations. Other ambient displays can use this same structure because different shapes of different types of material can be mounted onto the motor shaft.
3.1.4 Evaluation
Overall, a robust and flexible hardware system was built for creating ambient displays. The pinwheel circuitry has shown to be pretty robust, some pinwheels have been running for over seven months now and only one breakdown has occurred. The structure for the pinwheels holds all its components compactly and does not aesthetically add any weight to the pinwheel.
The only non-trivial problem has to do with varying the speed of the motor. Setting the pulse width to be directly proportional to the speed specified in the instruction does not give 256 distinct speeds. There are cluster of speeds that seem to make the pinwheel spin at the same speed. There is a clear
distinction between one speed and the one after it up to approximately speed 16, after which the numbers of speeds in a cluster gradually increase. After speed 128, there is no noticeable difference between the speeds anymore. One solution to this would be to not map speeds directly to pulse width, but to map more speeds to shorter pulse widths since those are more distinct from each other.
Spinning generated by longer pulse widths all appear to be the same, so fewer speeds should be mapped to it. Adding a function in the pic code that maps instruction speeds to an appropriate counter value, rather than setting the counter value directly to the specified speed, would be a way to implement this solution.
3.1.5 Future Work
Using the telephone cable as a bus between the pinwheels still imposes some restrictions to the displays. It requires the pinwheels to be fixed to one position. This will probably be true of most displays built, but if, for some reason, there was a need to spin the whole pinwheel on its vertical axis, the telephone cable would eventually get tangled around that axis. The telephone cable also requires the pinwheels to be relatively near each other so they can be connected together. This would prevent displays from, for example, being on different floors.
A possible replacement for the telephone cables would be to have no cables at all. A wireless ambient display would not only allow the pinwheels to be placed anywhere but make them even more like the regular undigitized pinwheels. This solution could be implemented by having the base component (the serial port interface circuit board) communicate with the pinwheels through RF communication. Each pinwheel would again listen for instructions for itself and act accordingly.
3.2
Software API
The software component of the toolkit is an API for pinwheel development. It presents the pinwheel as a black box to the developer so he/she will not need to have low-level knowledge of how the pinwheels work. At the simplest level, a developer can control a pinwheel by simply specifying the speed. The API developed allows users to develop the system at a high level, without having to worry about the underlying details. It also allows developers to work with sets of pinwheels, giving them yet an even higher level of abstraction to work with. Additionally, it prevents human error from causing hardware errors because it keeps developers from working at the level where software bugs could cause hardware failure.
3.2.1 Design Considerations
To be a truly useful part of the toolkit, the following were design criteria the API needed to fulfill:
0 Reliable
A standard requirement for APIs, reliability means that developers should be able to trust that the API does what it claims to do. In other words, it should be bug free, or bugs should be clearly pointed out to users.
* Configurable
The API should be easy to use and should allow developers to build applications quickly. Having a hard to use API defeats the purposes of having an API, developers would probably rather work with low-level details than figure out how to use the API.
0 Platform-independent
Its is very likely that ambient displays will be developed on a range of operating system platforms, not just on Windows, or on Unix, or on any other specific platform. The API should be usable on any platform the developer chooses to use.
0 Layered
Developers should be able to work at different levels of implementation. They should be able to work with a single pinwheel at a time or with a whole set of pinwheels. They should be able to use the predefined speeds of the pinwheels or create their own set of speeds that is more fitting for their particular application. The API should allow for working at these various levels.
0 Open
There should be no limit on adding functionality. The API should keep users from dealing with low-level instructions to the pinwheels but should not impose any restrictions on adding functionality on top of the already existing API.
* Flexible
The API should not restrict developers to certain ambient display configurations. In fact, it should not be dependent on any configuration and should give users full creativity in that aspect.
* Thread-safe
Threads are now a common occurrence in many applications. Thus, the API should actively support threads and not cause any threading issues if used in a program that is thread dependent.
3.2.2 The Pinwheel API
Java was used to develop the API. It is platform independent and has a familiar API structure that the Pinwheel API easily fits into. The Pinwheel API consists of three main classes: 1) SpeedMapping, 2) Pinwheel, and 3) PinwheelSet. This section will discuss the functionality of and motivation behind each one in turn. The following is a modular dependency diagram of the classes in the API.
Documentation for the API can be found in appendix C.
PinwheelSet b, Pinwheel
SpeedMapping
3.2.2.1 SpeedMapping
As described in the hardware section, the pinwheel can be set to spin at 256 different speeds. These will be referred to as basic pinwheel speeds. A SpeedMapping allows developers to map speeds to basic speeds. In other words, a SpeedMapping object acts as a function, f(x), where x = (1.. .s} and
f(x)
=
basic pinwheel speed user would like to map to x. For example, a user may want a pinwheel to spin at speeds 5, 10, 15, and 20 only. A SpeedMapping could then be created that maps speed 1 to basic speed 5, speed 2 to basic speed 10, 3 to 15, and 4 to 20. Giving a pinwheel this SpeedMapping allows the user to use incSpeed and decSpeed functions on the pinwheel. Instead of incrementing by one, it increments up to the basic speed the next speed is mapped to. Having this class also adds modularity since the developer can easily change the basic speeds the pinwheels spin at without going into the rest of the code.The SpeedMapping class is implemented with a java.util.Vector that holds the speeds in increasing order. It has functions to add and remove speeds, get mapped speeds, and get the mapped speeds before and after a certain speed.
To cut out complications, speeds must map to basic pinwheel speeds in increasing order, i.e. Vi,j where i<j and f is the SpeedMapping function, f(i) f(j). The class takes care of sorting of the speeds, so users only have to decide which speeds they would like to use. At creation, the set of basic pinwheel speeds that is passed in is first sorted with an insertion sort algorithm. Inserted speeds are inserted in the correct position. This may pose to be a limitation but it makes things easier for developers - they need only to worry about choosing which speeds they'd like to use. The class currently does not allow users to set a certain speed to be mapped to a certain basic speed because it might cause the mapped speeds to be out of order. This is not necessarily a bad thing, but in the interest of simplicity, this functionality was not added to the class. If users wish to create an unordered SpeedMapping, something that probably will not happen often, there are definitely ways for them to do it.
3.2.2.2 Pinwheel
The Pinwheel class represents one pinwheel. Each Pinwheel object has to have a unique id, a speed, a direction, and a java.io.OutputStream that is a handle to the serial port. Additionally, it may have a SpeedMapping and a name.
At the simplest level, a pinwheel object can be created with just a unique char id and an OutputStream. The pinwheel starts with speed zero, no speed mapping, and default direction forward. Three other constructors exist with which a Pinwheel can be created with more
information. Get methods exist for getting the id, current speed, SpeedMapping, direction, and name. Set methods exist for the speed, SpeedMapping, direction and name. In setting the speed, the argument is an unmapped speed. If a SpeedMapping exists, the argument is mapped to a basic pinwheel speed that the pinwheel is then set to spin at. If no SpeedMapping exists, the pinwheel is set directly to spin at the specified speed. If no new direction is specified in setSpeedO, the pinwheel continues to spin in the same direction. The class also contains incSpeedQ and decSpeedO methods. Similar to the setSpeedO methods, if a SpeedMapping exists, the speed is incremented or
decremented to the next or previous mapped speed. If no SpeedMapping exists, the speed is incremented or decremented by one.
The Pinwheel class is a level above direct serial communication with the pinwheels. It was created mainly to keep the users from having to follow the instruction format for communicating with the pinwheels. As mentioned in the hardware section, if an instruction was sent that caused both lines for the motor to be high, the motor would lock and the pinwheel would have to be reset. Since
pinwheels are often situated in a space that is not easily accessible, resetting them is not an easy task. Encapsulating everything in a Pinwheel object prevents this sort of error.
3.2.2.3 PinwheelSet
A PinwheelSet holds a set of pinwheels. It may optionally have a name and a SpeedMapping which all pinwheels in the set use, unless a particular Pinwheel's SpeedMapping is set to something else afterwards. All Pinwheel objects in a set must have an id different from the rest of the Pinwheels in the set.
A PinwheelSet can be created from a Vector of Pinwheel objects or from none at all. It can also be created with a start char id, an end char id, and an OutputStream. This constructor creates Pinwheel objects with ids from the start char to the end char and creates the PinwheelSet with those new objects. The class acts very much like the Vector class. It has methods to add and remove Pinwheel objects from a set. As in a Vector, Pinwheels are added one after another to a PinwheelSet, giving the set an order. They may be removed by id, name, or by object. They may be retrieved from a set by those three attributes as well. Because the PinwheelSet is ordered, there are methods for retrieving its first and last Pinwheels and a method to retrieve the next Pinwheel after a given one. The
PinwheelSet also provides an easy way for manipulating multiple Pinwheel objects, i.e. they can all be started and stopped at the same time with one command. The start method can be used to set all Pinwheels to a certain speed.
In building ambient displays, grouping pinwheels together or having them relate to each other in some way is a common occurrence. The PinwheelSet class gives developers the ability to work at this higher level of abstraction. For example, in the stock market application, five pinwheels are allocated to one stock. Every five seconds, the speed of a pinwheel changes to the speed of the pinwheel before it. Having the PinwheelSet makes performing that sort of transition much easier.
3.2.3 Evaluation
The goal of the Pinwheel API was to provide developers with an easy way to program contents for and control ambient displays. It was designed with the criteria listed previously in mind. Standard verification methods, black box and white box testing, were used to test each class of the API. As applications were built, the API continued to go through development as more functionality, such as different methods for retrieving Pinwheels from a PinwheelSet and replacing a Pinwheel in a set, was added to each class. Regression testing was used to ensure that the additions did not break already existing functionality. Through the applications that were built, the resulting API has shown to be reliable and easy to use. The use of Java makes it platform independent and it allows developers to work at different levels of implementation. Additionally, it places no restrictions on the displays, either in form or functionality. Developers can build on top of the existing API to create classes for, for example, arrays or matrices of pinwheels. It has also been used in conjunction with Threads and has not caused any problems. To conclude, all the criteria set for creating a software toolkit to aid in the development of ambient displays have been met.
3.2.4 Future Work
The use of Java makes it possible to port this API onto devices other than the computer. If these devices also support serial communication, running of the ambient displays can be moved entirely off the computer and onto a much smaller device. An example of such a device is the TINI board. TINI stands for Tiny Internet Interface and allows one to web-enable just about any piece of electrical equipment. With the TINI board, all control of the pinwheels can reside on just this board, adding to the portability of the system. The TINI board has not yet been used because it does not have an easily visible graphical interface that is needed for the GUI portion of an ambient display. Another example of a smaller device that can be used and also has a visual interface is the Palm. It supports
Java and can also perform serial communication, so ambient displays could be run off of this small handheld device. A simple GUI component could easily fit onto the Palm interface, completing the display.
4
Applications
The core of this thesis was to study possible application domains for the ambient displays and investigate the kind of contents and interfaces appropriate for the pinwheels. Several possible application domains were discussed and ambient displays were built for four of them: 1) Stock Market Activity, 2) Website Visitor Activity, 3) Natural Wind Movement, and 4) Network Activity. The following section will first describe the design criteria for an interface of an ambient display. Then for each application, it will discuss possible contents and interfaces for that domain, the specific contents that were chosen, the interface that was built, and the implementation and evaluation of that display.
4.1
Interface Design Criteria
There are many ways pinwheels can be situated in a display. For example, one could use a single pinwheel to display one bit of information. The pinwheels could also be set up in an array where
each pinwheel represents a point in time, making the whole array a timeline. They could also be set up as a matrix, where movement in the x and y directions together portray movement over a certain
area. Other possible arrangements include concentric circles or tree structures. Arrangements vary depending on the application domain. However, all the interfaces of the displays should have the following characteristics:
0 Representative
The interfaces should most importantly be representative of the data. Since they give information through subtle changes in movement, sound, and light, there should be a clear difference in its motions if its data is different. For example, a sudden large difference in data could be reflected as a
sudden large change in the speed of a pinwheel.
0 Understandable
By just looking at a display, most people cannot tell what information is being presented. The interfaces need to be put in context; given this context, users need to be able to make some
conclusions about the information being portrayed with little explanation. They might not necessarily get the full picture but the display should at least intuitively make sense to them.
* Aggregately Informative
Each individual ambient fixture represents one bit of information. All together, the interface should show how each of these bits relates to each other. Thus, each display should not only give disjointed information but also tie together all the bits and portray the aggregate information as well. An example of such a display is one that portrays trends in a certain domain.
* Aesthetically Pleasing
One of the most attractive characteristics of ambient displays is that they are aesthetically pleasing. If they were not, there would be less of an argument to use them as an alternative to onscreen
interfaces. The pinwheels themselves are simple and elegant and the displays should not destroy this effect. A bulky display is rather obtrusive, going against the definition of an ambient display.
* Believable
Perhaps the biggest danger with ambient displays is that they are not believable. Users need to be convinced that the pinwheels are truly and accurately portraying the data they claim to be mapped to.
4.2
Graphical User Interface
Ambient displays subconsciously give users a sense of events happening outside or away from them. If users wish to act upon their new awareness, they should have the choice to turn to a graphical interface that will give them more precise information about the events. Having a graphical interface as part of an ambient display is beneficial in many ways. Besides giving more specific data, it can also be used to make the displays more understandable because it can tell users what information is being presented. It can also convince the user that the physical interface is correctly mapping the data being monitored. The physical and graphical interfaces coupled should give users a sense of causality. This is key in making the displays believable.
The graphical interfaces should be designed so that they are easily associated with the physical interfaces they are complementing. Doing so will make the correlation between the graphical and the physical interfaces more convincing and will also make it easier for people to understand the displays and remember their contents.
4.3
Application I: Stock Market Activity
The stock market is very dynamic. Stock prices go up and down and large volumes of transactions occur every second. Additionally, it is something that many people care about. They would all like to know immediately when the market is crashing or going up tremendously. However, it is difficult for most to be constantly watching the market because in order to do so, a significant amount of foreground attention has to be paid to a stock ticker. An ambient display could "watch" the market for them. For these reasons, stock market activity looked to be a good candidate for using an ambient display.
Having a display that presents what is happening on the market can peripherally give people a sense of the information they want about the market without them having to give any foreground attention to it. If activities on the market were normal, then the pinwheels would probably spin normally, sometimes on, sometimes off, sometimes fast, sometimes slow. The display could give people a sense of activity on the market without causing them any disruption. If, however, there were remarkable activity on the market (i.e. stock prices falling or rising rapidly) and the display reflected this activity by either having all the pinwheels stop or spin rapidly, the user would very likely notice this and, if he chooses to, turn his attention to the market. Ambient displays are well suited for this application domain because displays can be ignored when activity is normal but will call for attention when it is not. Additionally, if people do want a sense of what is happening on the market, they can find out quickly by taking a glance at the display.
4.3.1 Possible Contents and Interfaces
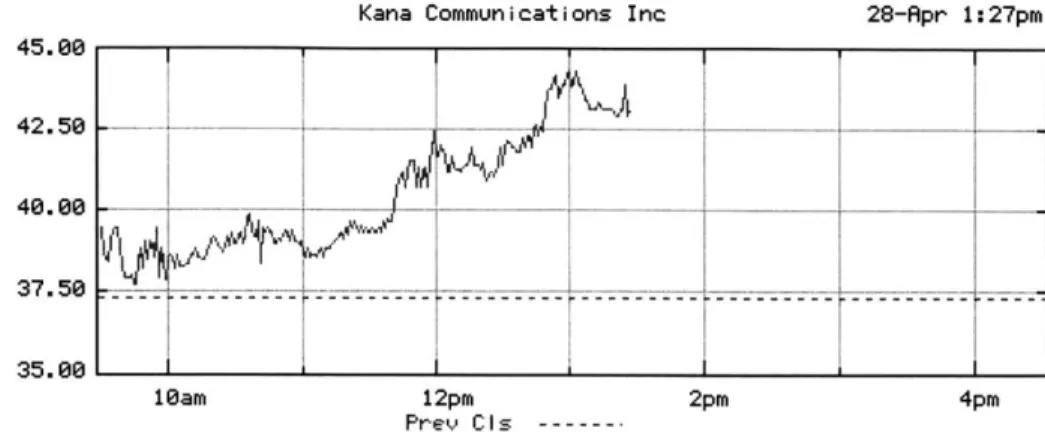
4.3.1.1 Stock Price
One possible component of the stock market that could be tracked by the pinwheels is stock prices. They can go through quite a bit of fluctuation just in the period of a day, as can be seen in the following chart from the Yahoo! Finance pages.
K u2A -- --- --- - -- -- -- --- -- --- __ _ ---- ----- -45.00 42.50 40.00 37.50 35.00 10am
Copyright 2000 Yahoo! Inc.
12pm
Prev CIs
---2pm 4pm
http: //f i nance. yahoo. com/
Figure 4.1: Stock Price Fluctuations in a day
One pinwheel could be used to track the changes in price of one stock. Forward spinning would represent a positive change while backwards spinning would mean a fall in price. The rate of spin would be proportional to the amount of change. With this mapping, it would be very easy for users
to take a quick glance at the pinwheel to see how the stock is doing. Constant rapid spinning in the forward or backward direction would be noticeable and make users aware that the price is going through a dramatic change. An ambient display could comprise a number of these pinwheels, one for each stock in one's portfolio. This display would help a user keep track of how all of his investments in the market are doing.
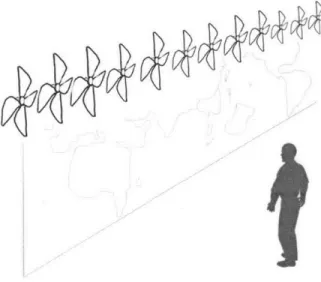
The arrangement of the pinwheels in this type of display needs to be one that facilitates the user remembering which pinwheel corresponds to which stock. One possibility is to situate the pinwheels in an array, with a complementary graphical interface that shows which stock is being tracked by each pinwheel. The following figure shows such a setup.
Figure 4.2: Possible Stock Portfolio Ambient Display
Positioning the pinwheels in an array also calls more attention to the display when one pinwheel starts to spin much faster than the others. The faster pinwheel stands out, making the change more noticeable than when there is only one pinwheel in a display.
Another possibility is to give the user the freedom to situate the pinwheels. Since there is no strict spatial relationship between the stocks, there is no need to keep the pinwheels that represent them in a certain arrangement. Leaving the design to the users allows them to situate the pinwheels in a way that would help them remember which pinwheels are mapped to which stocks. For example, they could group stocks by company type, color code them, or order them by importance, placing the more important ones closer by. This assumes that the display is primarily being used by only one user, making it possible for him to personalize the display.
4.3.1.2 Volume of Activity
Another value of the stock market that can be tracked is the volume of activity for a stock, i.e. the number of shares that are bought and sold for that stock. Again, this value is constantly changing because both large and small transactions are happening all the time. The following figure shows the variation in volume over a period of four hours.
Kana Communications Inc 28-Apr 1:27pm
60000 50000 40000 30000 t- - - -- -- L - _ 20000 - - ---10000
hi-Copyright 2000 Yahoo! Inc. Volume http://finance. yahoo.com/
Figure 4.3: Volume Activity in a day
One pinwheel can again be used to map volume. However, volume is never negative, so the pinwheel would only spin in one direction. The speed of the spin would depend on the volume of activity.
Slow or no spinning would indicate little or no activity; rapid spinning would mean the opposite.
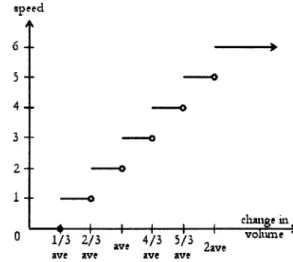
Arrangements similar to the ones described in the previous section could also be used with this content. However, given just one pinwheel, mapping volume is not as meaningful as mapping price because people care more about the price than about the volume of activity for a stock. A more interesting statistic that can be mapped with multiple pinwheels is how the volume of activity
fluctuates over time. If a number of pinwheels are each used to map the change in volume over contiguous intervals of time, a timeline can be created that gives users information about activity over an extended amount of time.