Publisher’s version / Version de l'éditeur:
ASHRAE Transactions, 99, 1, pp. 632-642, 1993
READ THESE TERMS AND CONDITIONS CAREFULLY BEFORE USING THIS WEBSITE.
https://nrc-publications.canada.ca/eng/copyright
Vous avez des questions? Nous pouvons vous aider. Pour communiquer directement avec un auteur, consultez la première page de la revue dans laquelle son article a été publié afin de trouver ses coordonnées. Si vous n’arrivez pas à les repérer, communiquez avec nous à PublicationsArchive-ArchivesPublications@nrc-cnrc.gc.ca.
Questions? Contact the NRC Publications Archive team at
PublicationsArchive-ArchivesPublications@nrc-cnrc.gc.ca. If you wish to email the authors directly, please see the first page of the publication for their contact information.
NRC Publications Archive
Archives des publications du CNRC
This publication could be one of several versions: author’s original, accepted manuscript or the publisher’s version. / La version de cette publication peut être l’une des suivantes : la version prépublication de l’auteur, la version acceptée du manuscrit ou la version de l’éditeur.
Access and use of this website and the material on it are subject to the Terms and Conditions set forth at
A guarded hot box procedure for determining the dynamic response of
full-scale wall specimens - Part I
Brown, W. C.; Stephenson, D. G.
https://publications-cnrc.canada.ca/fra/droits
L’accès à ce site Web et l’utilisation de son contenu sont assujettis aux conditions présentées dans le site LISEZ CES CONDITIONS ATTENTIVEMENT AVANT D’UTILISER CE SITE WEB.
NRC Publications Record / Notice d'Archives des publications de CNRC:
https://nrc-publications.canada.ca/eng/view/object/?id=43772b59-1fb6-4bc4-bd58-df0106bde486 https://publications-cnrc.canada.ca/fra/voir/objet/?id=43772b59-1fb6-4bc4-bd58-df0106bde486
A gua rde d hot box proc e dure for de t e rm ining t he dyna m ic re sponse
of full-sc a le w a ll spe c im e ns - Pa rt I
N R C C - 3 4 0 0 2
B r o w n , W . C . ; S t e p h e n s o n , D . G .
J a n u a r y 1 9 9 3
A version of this document is published in / Une version de ce document se trouve dans:
ASHRAE Transactions, 99, (1), ASHRAE Winter Meeting, Chicago, IL, USA,
January-23-93), pp. 632-642, 93 (Paper presented at the ASHRAE Winter
Meeting held in Chicago, IL, USA, January 23-27, 1993)
http://www.nrc-cnrc.gc.ca/irc
The material in this document is covered by the provisions of the Copyright Act, by Canadian laws, policies, regulations and international agreements. Such provisions serve to identify the information source and, in specific instances, to prohibit reproduction of materials without written permission. For more information visit http://laws.justice.gc.ca/en/showtdm/cs/C-42
Les renseignements dans ce document sont protégés par la Loi sur le droit d'auteur, par les lois, les politiques et les règlements du Canada et des accords internationaux. Ces dispositions permettent d'identifier la source de l'information et, dans certains cas, d'interdire la copie de documents sans permission écrite. Pour obtenir de plus amples renseignements : http://lois.justice.gc.ca/fr/showtdm/cs/C-42
3683 (RP-515)
A GUARDED HOT BOX PROCEDURE
' .. FOR DETERMINING THE DYNAMIC
7 .,_ . • •セ@
RESPONSE OF FULL-SCALE WALL
SPECIMENS-PART I
·,
W.C. Brown
ABSTRACT
ASHRAE Research Project 515 had the goal of produc-ing measured values of the dynamic heat transmission characteristics of walls. The characteristics were measured
·- in a guarded hot boxfacility. The facility, which conforms
in general to that standardized by ASTM C236, measures
heat transfer through a 2440 mm X 2440 mm (8ft X 8ft)
test area. Calorimeter temperatures are controllable between l6°C and 26°C (60°F and 80°F), and cold-side
temperatures are controllable between
ooc
and -40°C(32 °F and -40°F). Data acquisition and control are provided through a laboratory computer system.
Dynamic calibration of the guarded hot box facility was required before it could be used to measure dynamic heat transmission characteristics. This calibration was developed from first principles and supported by measurements of a 102 mm (4 in.) thick expanded polystyrene specimen whose thennal characteristics had been determined from measure-ments of material properties. To measure the dynamic heat transmission characteristics of wall specimens, a test and data reduction procedure was also developed from first principles. The validity of this procedure was confirmed with measurements of the dynamic heat transmission
.:. characteristics of a 203 mm (8 in.) thick cement mortar
-Mセ MM ·: --- specimen whose thennal characteristics were detennined
- · from measurements of セ。エ@ erial properties.
INTRODUCTION
The z-transfer function data and procedure published in the 1989 ASHRAE Handbook-Fundamentals (ASHRAE 1989) are the basis of most methods for calculating dynamic beat transmission through walls. These data and procedures pertain to walls made up of layers of homogeneous materi-als and have no allowance for thermal bridges, such as framing members or brackets that support cladding. Hot box facilities as standardized by ASTM (1991a, 1991c) are limited to measuring the steady-state heat transmission
セィ。イ。」エ・イゥウエゥ」ウL@ including R-value, of walls. However,
D.G. Stephenson, Ph.D.
recent work by Burch et al. (1987) and Stephenson et al. (1988) has proposed procedures to use these same facilities to measure the dynamic heat transmission characteristics of walls.
ASHRAE Technical Committee 4.1, Load Calculations, Data, and Procedures, initiated Research Project 515 to address the issue of measured versus calculated dynamic thermal performance characteristics. The project had two objectives:
1. to measure the dynamic heat transmission characteris-tics of seven generic types of walls in order to deter-mine the coefficients of the two transfer functions that incorporate these characteristics, and
2. to confirm the testing and data reduction procedures used in RP-515 by using these procedures to measure the dynamic heat transmission characteristics of a homogeneous wall specimen of "known" characteris-tics.
The first objective was designed to determine whether the dynamic heat transmission characteristics of nonhomo-geneous walls differ significantly from the response that would be predicted using Fundamentals (ASHRAE 1989) methods. It is documented in a companion paper (Brown and Stephenson 1993). The second objective, which was designed to demonstrate that the measurement procedure used with the seven generic walls produced accurate data, is documented in this paper. It presents a description of the guarded hot box facility and the dynamic calibration of the facility. It also confirms the validity of the testing and data reduction procedure for measuring dynamic heat transmis-sion characteristics by demonstrating that the procedure can measure the characteristics of a homogeneous cement mortar test specimen. Both objectives are documented in the final contract report (Brown 1991).
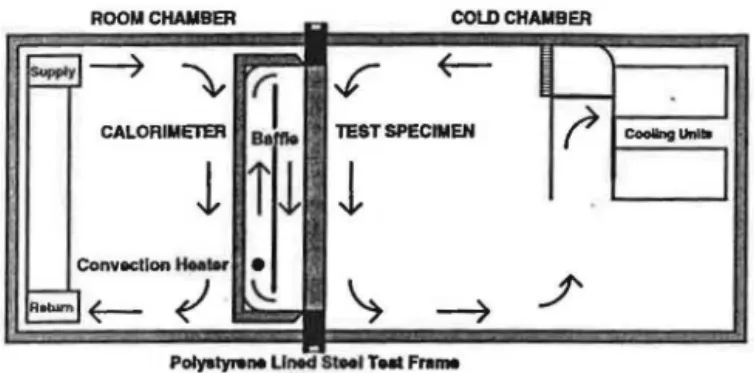
GUARDED HOT BOX FACILITY
The guarded hot box facility (Figure 1) conforms, in
William C. Brown is a senior researcher at the Institute for Research in Construction, National Research Council Canada, Ottawa , Ontario. Donald G. Stephenson is a private consultant who was formerly with the Institute for Research in Construction.
ROOM CHAMBER COLD CHAMBER
S---7
セ@
r.
.r
セ@I
I
セMイ@
TEST SPECIMEN7
Cooling ""''"MセLセセ@
セャ@
l
I
bセ@
セ@
セ@
\
---7-"
Figure 1 Section through guarded hot box facility.
general, to that standardized by ASTM C236 (199la). It consists of a cold chamber with test temperatures between
ooc
and -40°C (32°F and -40°F), a metering box or calorimeter with test temperatures between l6°C and 26°C (60°F and 80°F), and a room chamber that serves as the thermal guard for the calorimeter. The calorimeter, with a 2440 mm X 2440 rom (8 ft X 8 ft) test area, measures the heat flow through a test specimen of similar size. The test specimen is mounted in an extruded polystyrene lined steel test frame. In this arrangement, the polystyrene performs as the perimeter thermal guard for the test specimen.The calorimeter is constructed of 76 mm (3 in.) thick isocyanurate foam board stock that was assembled without thermal bridges. It is finished with fiberglass and polyester resin for physical protection. An equal-area, 64-junction thermopile is built into the top, bottom, sides, and back of the calorimeter to sense the temperature difference across the walls of the calorimeter. A baffle of fiberglass-surfaced, isocyanurate foam, 40 mm thick by 2440 mm wide by 2015 mm high (1.5 in. X 96 in. X 79 in.), is centered vertically in the calorimeter and 230 rom (9 in.) from the back wall. The calorimeter air temperature is sensed with an RTD and is maintained at setpoint through a three-mode analog millivolt controller. The controller regulates a DC power supply that feeds an electric· convection heater located between the back wall セ@ the baffle. The heaters are raised above the bottom of the baffle so that the baffle shields the test specimen from direct radiation from the heaters. Heated air flows up between the back of the calorimeter and the baffle, through the gap at the top, down the 405-mm (16-in .) space between the baffle and the test specimen, and back through the gap at the bottom.
The cold chamber is constructed of 102 mm (4 in.) thick, aluminum-skinned, polyurethane-filled panels. Air in the cold chamber is circulated by a fan so as to fall parallel to the cold face of the specimen. The temperature is sensed with anRTD and is maintained at setpoint through a three-mode analog millivolt controller that regulates high-voltage AC power to an electric heater. The air is precooled below setpoint by passing it over a cooling coil fed from a central chiller plant.
The room chamber is also constructed of 102 mm (4 in.) thick, aluminum-skinned, polyurethane-filled panels.
ASH RAE Transactions: Research
The room air temperature can be controlled in one of two modes. For steady-state tests, the room chamber acts as a thermal guard for the calorimeter. The air temperature is coP. trolled through a three--mode analog null voltage control-ler so that zero temperature difference is maintained across the walls of the calorimeter. This temperature difference is sensed by the equal-area thermopile that
is
built into the calorimeter walls. For dynamic tests, the temperature is controlled at a fixed value. The temperature is sensed with an RTD and is maintained at setpoint through a three-mode analog nilllivolt controller. For both steady-state and dynamic tests, the controllers regulate AC power to an electric heater that heats air that bas been precooled below setpoint by passing over a process chilled-water cooling coil.A computer-based data acquisition and control system provides remote setpoints for the controllers and data collection and processing services for the facility. Calorim-eter heater power is measured by a precision current shunt and voltage divider with an accuracy of better than 1 %. Test temperatures are sensed with 30-gauge copper-constan-tan thermocouples with an accuracy of ±0.1 °C. All sensors are measured continuously, and space and time average data for sensors of interest are recorded every 15 minutes. Analysis of the test data occurs off-line on another comput-er:
Remote setpoints for the relevant temperature control-lers are supplied by the laboratory computer for both steady-state and dynamic tests. The setpoint can be pro-grammed to follow a constant, a ramp, or a sinusoidal waveform. The practical limits on the sinusoidal period are 3 to 48 hours. During dynamic testing, the computer updates the setpoint every minute, and the controller regulates the air temperature to match the new setpoint. The option to control calorimeter heater power rather than calorimeter temperature is also available. With this option, the heater power can be programmed to follow a constant, a ramp, or a sinusoidal waveform.
I
DYNAMIC RESPONSE OF THE GUARDED HOT BOX FACILITY
Dynamic calibration of the hot box facility requires that the response of the facility to dynamic excitation be deter-mined. The heat transfer processes in the hot box facility can be represented by the thermal circuit illustrated in Figure 2.
Heat is transferred to the warm surface of the specimen from two different sources: by convection, through resis-tance Re, from the air that circulates in the calorimeter (T,) iuid by radiation, through resistance R,, from the baffle
(TsJ. Given the hot box thermal circuit, the baffle surface
temperature, T 82, will always be lower than the air temper-ature,
Th.
It is necessary that a single equivalent environ-mental temperature be determined that would represent the combined driving potential from the calorimeter to the 633_
..
CALORIMETERFigure 2 Guarded hot box facility thermal circuit.
specimen. The film resistance or heat transfer coefficient between the environmental temperature and the specimen must also be determined.
When the calorimeter and specimen are excited dynami-. cally, heat is transferred into and out of the specimen, Q5
(see Figure 2). Heat is also transferred into and out of the ·' inner surface of the calorimeter, Qc, and both surfaces of the baffle in the center of the calorimeter, Q81 and Q82• The
- calorimeter and baffle are each excited by measurable . temperatures and have unique transfer functions relating the measured excitation temperatures to the heat transfer to/from the element. Determination of the dynamic response ·of the hot box facility, therefore, requires determination of - the transfer functions for the calorimeter, C, and the baffle,
. B, that relate the heat transfer to/from the element to the . temperatures on the surfaces of the element.
The transfer functions were determined using a 101-. mm-thick expanded polystyrene test specimen101-. It was
chosen because it was homogeneous, with a high R-value and a fast response,. so that the response of the calorimeter would be the prominent response of the
calorimeter/speci-ᄋ N LNNNZM B セM [@ men system. The thermal characteristics of the specimen were determined by independent procedures. Thermal - ·. ·'- · conductivity was determined from a series of heat flow meter tests (ASTM 1991b) at different mean temperatures; it was found to be well represented by a linear function of mean temperature. Vohimetric heat capacity was determined by the method described by Stephenson (1987); it was also found to have a slight dependence on mean temperature. Heat Transfer between Calorimeter
and Test Specimen .,
As a first step in determining an equivalent environ-"mental temperature, the delta resistance network, represent-ing the heat transfer cireuit between the air, the baffle, and エセ・@ warm surface of the specimen, can be replaced by a star network (Figure 3). (Note that the delta circuit assumes that the conveetive heat transfer coefficient is the same at the face of the baffle and at the face of the specimen.)
In the star network; TE is the equivalent environmental temperature and R1 is the thermal resistance for combined
-634
Figure 3
DELTA
Delta to star substitution for calorimeter thermal circuit.
radiation and convection from TE to the warm surface of the specimen at temperature T1• Steady-state analysis of the
revised thermal circuit for the hot box facility yields the following relationships:
(1)
(2)
(3)
A series of steady-state tests on the expanded polysty-rene calibration specimen were used to determine values of
R1• The test results and the values derived from them (Table
1) indicate that the value of R1 is essentially independent of
the heat flow through the specimen, Q5 , for heat flows
between 50 W and 100 W. The mean value of 0.079 m2• KfW applies when the surface of the test specimen has
an emissivity that is close to 1. If the surface of the specimen has a much lower emissivity, the value of R1
would be somewhat larger. Equations 2 and 3 can be used to calculate an equivalent environmental temperature TE for all tests, since Rl and Rn are known and TBl and TB2 can be measured.
Calorimeter Transfer Function, C
The cyclic component of the heat flows into the calorimeter walls, Qcr and QC2, are related to the cyclic component of the temperatures at these surfaces, Tc1 and
Te2, by
(4)
The square matrix is called the transmission matrix for the walls, and the matrix elements Xc, Yc. and Zc are functions of the thermal properties and dimensions of the materials in the walls and the frequency of the cyclic component (Carslaw and Jaeger 1959). Ac is the area of the calorimeter shell.
TABLE 1
Determination of R, from Steady-State Thermal Tests on the Expanded Polystyrene
Calibration Specimen
Variable
TestA
TestB
Teste
Tc
(°C)
-35.1
-20.4
-5.3
TBl
(°C)
20.9
21.0
21.1
TB2
(°C)
19.3
19.6
20.1
T
1(°C)
17.9
18.6
19.4
T2
(°C)
-34.1
-19.6
-4.9
Qs
(W)
100.6
76.1
49.7
Tm
(°C)
-8.1
-0.5
7.2
R1 (m2·KfW)
0.078
0.079
0.079
Rs --(m2·KfW)
3.07
2.98
2.91
R2
(m2·KfW)
0.060
0.060
0.048
The heat flow through the outside surface of the calorimeter, QC2, is related to the temperature in the room chamber or guard, Ta, and the outside surface, TC2, by
Q
C2-_TC2-TG A
.
R
.c
G
(5)
Hence, when the temperature of the guard is kept constant, i.e.,
T
0 = 0,(6)
and
(7)
Combining E quation 6 with Equation 7 produces an expression relating the heat flow through the inner surface of the calorimeter, Qc (= Qc1), to the temperature
differ-ence across the 」。ャッイゥュセエ・イ@ walls, (Tc1 - To):
Q _ ( Zc
+
Xc IRa . )
(
c -
Xc
+
Yc IRa
-1 .
Ac . Tel - T
C2 )(8)
The temperature di fference across the calorimeter walls, (Tet - To), is related to the voltage from the thermopile across the calorimeter walls, E, and the sensitiv-ity of the thermopile, k, by (TCl - To) = k·E. Hence, the total heat flow into the inner surface of the calorimeter,
ac.
is(9)
ASH RAE Transactions: Research
ᄋMMセM M Mセ セ@
where
C=(
Zc +XciRa
)·A ·k
Xc +YciRa
-1
c
(10)
Under steady-state conditions the heat flow through the calorimeter is
k·E
Qa =--·Ac
Rc
(11)
The value of k·AdRc was determined to be 1. 79 W/mV from a series of steady-state tests on the expanded polysty-rene specimen. In these tests the temperatures inside the calorimeter and in the cold chamber were kept constant, and the temperature in the guard was held constant at several values above and below the calorimeter temperature. Thus the calorimeter transfer function C is
(12)
Values of C have been calculated for various frequencies using the thermal properties and thickness of the calorimeter walls. These values are given in Table 2.
Baffie Transfer Function, B
The cyclic component of the heat flow into the surfaces of the baffle is related to the temperatures at the surfaces by
(13)
where X8 and Y8 are elements of the transmission matrix for
the baffle.
Thus the total heat flow into the baffle
p
(h)48
--24
12
6
3
QB
=
QBl +Qsz
=(
x;.-
1
}(r ..
+T
82)·A
8=
B · ( T
81+
T
82 )(14)
TABLE 2Values of the Calorimeter Transfer Function C for Various Frequencies
co
c
(rad/s)
(W/mV)
3.64x1o-s
2.145L-327.0°
7.27x1o-s
2.962L-308.0°
1.45x1()-4
5.033L-292.4°
2.91x10⁻⁴
9.460L-283.9°
5.82x10 ....
17.998L-280.4°
635where
(15)
Values of b have been calculated for various frequencies using the thermal properties and dimensions of the baffle. These values are given in Table 3.
, Confirmation of the Transfer Functions
The values of C and B given in Tables 2 and 3 have been confirmed by a series of dynamic tests with the 101- . mm-thick polystyrene calibration specimen. The power . fuput to the calorimeter, P, and the エ・ュー・イ。エオイセ@ of the room
· c • . • • chamber, TG, were kept constant, while the temperature in
ithe cold chamber,
Tc,
varied sinusoidally. Tests were run for periods of 24, 12, 6, and 3 hours. The variation in cold chamber temperature produced a cyclic component of heat flow into the warm surface of the specimen, Qs, which, in _ tum, generated a cyclic variation in heat flow into the calorimeter, Q 0 and into the baffle, QB. However, the net heat balance of the calorimeter is zero, i.e., QB+
.. Qc = -Qs.
Measured surface temperatures of the specimen from the tests were used together with the independently deter-mined thermal properties to calculate the cyclic component of heat flow ゥョセッ@ the warm surface of the specimen, Qs,
. during the tests. As the thermal properties were functions , of mean temperature, Qs had to be calculated by a numeri-.. cal method that allowed for the effect of the temperature
dependence of the properties. The basis for this method is • ··given in Appendix A.
The fundamental components of the Fourier series that .. ,_were derived from the temperatures recorded during the 'steady periodic portion of each test were used with B and
C to calculate Q8 and Qc. Values of the sum of the cyclic
components of Q8 and Qc are given in Table 4 along with
" · セ NZNM the cyclic component of Qs derived from the surface temperatures and thermal properties of the test specimen. The close agreement between the predicted and measured values confirms that the values of B and C yield accurate yalues for the heat flow to/from the baffle and the calorime-ter during dynamic testing.
\
p
(h)
48
24
12
l6
•
3
636 TABLE 3Values of the Baffle Transfer Function B for Various Frequencies
co
B
(rad/s)
· (W/ocr
3.64xlo-
50.966L-270.1 °
7.27xlo-
51.931L-270.2°
-1.45x1D-'
3.862L-270.4°
2.91xlo-'
7.718L-270.7°
5.82x1Q-4
15.391L-271.4°
DETERMINING DYNAMIC HEAT TRANSMISSION CHARACTERISTICS
The z-transfer function data and procedure published in
Fundamentals Haセ@ HRAE 1989) only include z-transfer function coefficients that relate the heat flux component through the interior surface of the wall to the sol-air temperature on the exterior. This is sufficient to calculate the rate of heat transfer at the interior due to a change in exterior conditions, but another set of coefficients is needed when calculating the component of heat transfer at the interior due to a change in interior temperature. The latter is required for the calculation of room thermal response. Test and data reduction procedures for obtaining both sets of z-transfer function coefficients for a wall specimen were developed in support of RP-515. These procedures were presented in the final contract report (BroWn 1991) and are reproduced in Appendix B.
Homogeneous Specimen
A 2440 mm X 2440 mm X 208 mm thick (8 ft X 8 ft
X 8 in.) sand-cement mortar slab was cast as the "homoge-neous wall specimen" to meet the second objective of the project. The slab contained no aggregate or reinforcing steel. Four 610 mm X 610 mm X 51 mm thick (24 in. X
24 in. X 2 in.) material test specimens were cast at the same time from the same material. These specimens were used to measure the thermal properties of the wall speci-men. The wall and material specimens were left to cure in the laboratory for two months prior to testing.
Material Properties
The density, thermal conductivity, thermal diffusivity, and specific heat of the material test specimens were measured in our material test laboratory. These data are listed in Table 5. All data agree closely with Fundamentals values for. this material. Density was determined from the dimensions of the test specimens and from their mass. The latter was measured with a precision balance having a
TABLE 4
Comparison of Predicted and Measured Values of Heat Flow into the Warm Surface
of the Expanded Polystyrene Test Specimen (Referenced to tセャ@
Period
Q11+Qr
Q.('
I Diffl
(h)
(W/oC)
(W/oC)
(W/oC)
48
--
---24
1.47L 1°
1.48L 0°
0.03
12
1.52L -8°
1.54L-l0°
0.06
6
1.53L-22°
l.SOL-25°
0.10
3
1.39L-45°
1.34L-52°
0.16
TABLE 5
Physical Properties Determined for the Cement Mortar Homogeneous Test Specimen
,.
mm
[in.]
resolution of 1 g (0.0022 lb).
Two material test specimens with similar density and thickness were selected for thermal properties measure-ments. Four copper-constantan thermocouples were potted ' with epoxy flush with the face of each specimen. The specimens were then mounted together between the plates of an ASTM C-518 heat flowmeter apparatus (ASTM 1991 b). This apparatus consists of two liquid bath tempera-ture-controlled plates to which calibrated heat flux transduc-ers are mounted. Heat flux through the combined material specimens was measured at two temperature conditions. The first was with an average temperature of about 23 o C (7 4 °F)
and the second was with an average temperature of about 3°C (3rF). The temperature difference across each specimen was measured with the thermocouples embedded in each face. Thermal conductivity for each specimen was calculated from the respective temperature difference and thickness and the overall heat flux. The measured values of thermal conductivity did not vary with mean temperature.
The specific heat of the material specimens was deter-mined from the thermal diffusivity of the specimens, which was, in tum, determined using a procedure developed by Stephenson (1987). For this procedure, a single bath was used to control the temperature of both plates; the test specimen/heat flow meter apparatus configuration was undisturbed. Thermal diffusivity was determined from measurements of the respons.e of the paired specimens to a temperature ramp of approximately -4.7°C/h ( -8.5°F/h) from an initial steady · temperature condition at 35°C (95°F).
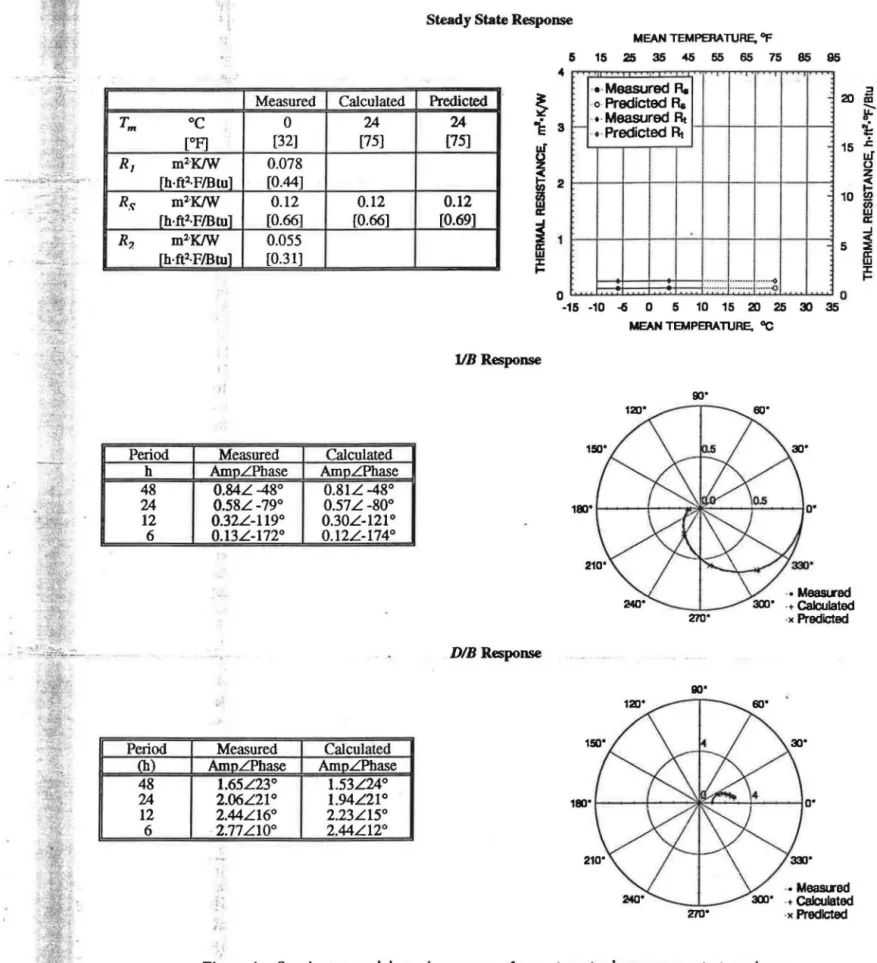
Test Results
Steps 3 and 4 of the test procedure (see Appendix B), which would normally have been conducted at an exterior temperature of -35°C ( -31 °F), were conducted at an exterior temperature of -20°C (-4°F), i.e., the same as that of steps 1 and 2. This was required because, given the low thermal resistance of the specimen, the heat flux at -35 o C (- 31 °F) would have been beyond the capacity of
the guarded hot box apparatus.
The steady-state and dynamic responses determined for the specimen are presented in Figure 4. The thermal resis-tance, Rs, determined at
Tm
= 24 °C (75°F) was 97% of that predicted from the material thermal conductivity and the thickness of the specimen. The frequency response wasASHRAE Transactions: Research
measured at periods of 48, 24, 12 and 6 hours, and the values of liB and DIB were determined from these mea-surements. The response calculated from the b. and d.
coefficients compares very well with that measured for the specimen and with that predicted from the material speci-men properties. The c. coefficients were determined from a fit to the data measured at the 12-hour period. The DIB
response of the homogeneous specimen compared reason-ably well with that predicted from the material specimen properties.
CONCLUSIONS
ASHRAE Research Project 515 had as a goal the measurement of the dynamic heat transmission characteris-tics of walls. While ASTM standardizes the guarded hot box as a method for measuring the steady-state heat transmission characteristics of walls, there is no standard-ized method of measuring the dynamic heat transmission characteristics of walls. An analysis of the guarded hot box facility used for this project provided a theoretical basis for determining the dynamic response of the facility. Measure-ment of the dynamic response of a 101-mm-thick polysty-rene specimen and a 208-mm (8-in.) homogeneous cement mortar slab demonstrated that the guarded hot box can be used· to determine the frequency response of full-scale wall specimens.
The series of tests on the cement mortar specimen demonstrated that the test and data analysis procedures used in ASHRAE Research Project 515 are capable of determin-ing b. and d. coefficients that reproduce the 1/B frequency response very well and
c.
(and d,J coefficients that repro-duce the DIB frequency response reasonably well. These results serve to validate the accuracy of the coefficients determined for the seven generic wall specimens (Brown and Stephenson 1993).ACKNOWLEDGMENTS
John Richardson was responsible for the construction, instrumentation, and testing of the calibration specimens. Dr. Kunze Ouyang, China Academy of Building Research, 'People's Republic of China, provided many of the original ideas for the testing and analysis procedure and contributed immeasurably to their development.
REFERENCES
ASHRAE. 1989.1989ASHRAE handbook-Fundamentals.
"Atlanta: American Society of Heating, Refrigerating and Air-Conditioning Engineers, Inc.
ASTM. 1991a. C 236-89: Standard test method for steady-state thermal performance of building assemblies by means of a guarded hot box. Annual Book of ASTM
Standards, Vol. 04.06. Philadelphia: American Society
for Testing and Materials.
·.
-Measured Calculated Tmoc
0 24 [OF] [32] [75]R,
m2·KJW
0.078 fh·ft2·F/Btul [0.44]R,,.
m2·KJW
0.12 0.12 _[h·ft2·F/Btu] [0.66] [0.66]R,
m2·KJW
0.055 [h·ft2
·F/Btu] [0.31]Period Measured Calculated h AmoLPhase AmoLPhase
48 0.84L -48° 0.81L -48°
24 0.58L-79° 0.51L -80°
12 0.32L-l19° 0.30L-121° 6 0.13L-172° 0.12L-174°
Period Measured Calculated (h) AmoLPhase AmoLPhase 48 1.65L23° 1.53L24° 24 2.06L21° 1.94L21° 12 2.44L16° 2.23Ll5° 6 2.77Ll0° 2.44L12° i
Steady State Response
MEAN TEMPERATURE, "F 5 15 25 35 45 55 65 75 85 95 4 Predicted 24 [75]
セ@
i:
31-w
セ@
2 0.12 [0.69]I
i
a: w ::z::...
D -15 liB ResponseDIB
Response ·•· Measured R. o Predicted R. 20 . •. Measured At -o-PredictedRt
15 10 5··· ...
ᄋ M ᄋᄋᄋ セ@ ......
·-···-<) 0 -10 セ@ 0 5 10 15 20 25 3) 35 MEAN TEMPERATURE, "Cso·
270"so·
270" ·• Me&Sll'ed ·+Calculated ·)( Predicted ·• MeasLred ·+Calculated ·)(PredictedFigure 4
Steady-state
anddynamic response of cement mortar homogeneous test specimen.
·I·
ASH RAE Transactions: Research
::J iii
...
u.;;
.i:. ui u zセ@
en
w a: ...J < :::::Effi
::z::....
セ MM MMMM MMMMセセセセ@_.,. _
-___
.._____
ᄋM MMM ᄋMセM M - ...-..- -- -
-ASTM. 1991b. C 518-85: Standard test method for steady-state heat flux measurements and thermal transmission properties by means of the heat flow meter apparatus.
Annual Book of ASTM Standards, Vol. 04.06.
Philadel-phia: American Society for_ Testing and Materials. ASTM. 1991c. C 976-90: Standard test method for thermal
performance of building assemblies by means of a calibrated hot box. Annual Book of ASTM Standards, Vol. 04.06. Philadelphia: American Society for Testing and Materials.
Brown, W.C. 1991. Final Report-ASHRAE Research Project 515-RP: Dynamic heat transmission character-istics of seven generic wall types and dynamic heat transmission characteristics of a homogeneous wall specimen. Ottawa, ON: National Research Council Canada.
Brown, W.C., and D.G. Stephenson. 1993. Guarded hot box measurements of the dynamic heat transmission characteristics of seven wall specimens, part ll. ASH-RAE Transactions 99(2).
Burch, D.M., R.R. Zarr, and B.A. Licitra. 1987. A dynamic test method for determining transfer function coefficients for a wall specimen using a calibrated hot box. ASIM Symposium on Insulation Materials, Testing
and Applications, Bal Harbour, FL, December 6-9.
ASTM Special Technical Publication 1030.
Carslaw, H.S., and J.C. Iaeger. 1959. Conduction of heat
in solids, 2d ed. London: Oxford University Press.
Stephenson, D.G. 1987. A procedure for determining the thermal diffusivity of materials. Journal of Thermal
Insulation, Vol. 10, April, pp. 236-242. Reprinted as
NRCC 28337. Ottawa, ON: National Research Council Canada.
Stephenson, D.G., K. Ouyang, and W.C. Brown. 1988. A procedure for deriving thermal transfer functions for walls from hot-box test results. Internal Report No. 568. Ottawa, ON: National Research Council Canada.
APPENDIX A Numerical Algorithm for Calculating Heat Flux into a Homogeneous Slab
The temperature distribution through a slab d
}lomogeneous material, whose thermal 」ッョ、オ」エゥセゥエケ@ and heat capacity are functions of the temperature, satisfies the differential equation
(tiT)
o
2T(oA)(oT)
2pC
dt
=A
ox2
+
oT ox
(A1) and the heat flux isア]MaHセセI@
(A2)As this equation is not linear when
A
is a function of T, it is difficult to solve analytically and a numerical procedu_re ASH RAE Transactions: Researchwas used. The calculation can be simplified by using the potential function This leads to and T 11
=
fA·dT
0 q=-dr! dx (A3) (A4) (A5) The thermal conductivity of polystyrene can be represented by a linear function of temperature,A=a+bT (A6)
..
11 =aT +bT2/2
(A7) and TM。Kセ。
R@+2lnl
(A8) bValues of 11 are calculated iteratively at a set of equally spaced values of
x
and 1 using the usual fmite difference approximations for the derivatives and values ofA..
and pC that correspond to the value ofT at each x and t.(
d
2
11)-
QQクKセ@
-211x
KQQクMセ@
(AlO)
dx2 ll.2
where
o
and L1 are the increments in the time and space coordinates respectively.A good approximation for
-(dr!/dx)x=O
(i.e., for qx=0 ) can be derived from the Maclaurin series expansion about11o:
(
dr!)
41l.
2(d211) 8A
3(d
311)
112.1 =11o +2/l. -
+ - - - -
+ - - - -
+···
dx 0 2! dx2 0 3! dx3 0 (A12) The usual practice is to combine these two equations so as to eliminate the(tfortttJ.il)
0 term and then neglect the(tf311tttx3)
0 and all higher order derivatives.- --It
is better, howevez, to combine them so as to eliminate the(tf.3rt/ttx3)
0 term and retain the(tfort/dx
2)0 term, which can be replaced by (drlfdJ)0 by using Equation A4. This means that the flfSt neglected term is the fourth derivative rather than the third, and, consequently, this approximation for the (dr!ldx)0 has the 639--same order of セ@ as the approximation that is used for
tf21JttJx2
at the'Positions within the material:qo,t
=
111o,t -811A,t +112A,t +_!(
pC)(
drJ) _
J!!.J d41l
64 3 A dt O,t 18 dx4
(Al3)
uセゥョァ@ Equation A8 to approximate
(drJ/dx)
0,, and neglecting the fourth and all higher space derivatives gives(
1!.2
pC) (
1'1o,t -811A.t +112A.t +
TT
3'1o.tMTQQッLセ@
+'lo,t-23)qo.,
=
0,16ll
-. (A14)
This approximation bas been found to yield accurate values when 8 is about 1% of the period of the highest frequency component of
TIOt
and when the Fourier number2 '
(4 /8)(pC/A.), is not more than about 1. The test for this
accuracy
is to repeat calculations with progressively smaller values of8
and4
until there is no significant change in the values of q0,, from one calculation to the nextAPPENDIXB
Procedure to Measure Dynamic Heat Transfer Characteristics of Full Scale Specimens (from Brown 1991)
THEORY
·tr.
The
Laplace
"iiansforms of the interior temperature,T;.
and exterior temperature,L
for a wall aree.
ande
,.. 1 e•
respectively, and the transforms of the beat fluxes through the wall
surfaces,
Q; and Qe, are <1»; and ct»e respectively. Thesecan
be related (Carslaw and Jaeger 1959) by a matrix . expression, namely,(B1)
The square matrix is called the transmission matrix of the wall. Matrix elements A, B, C, and D are functions of the thermal properties and dimensions of the materials in the wall and the surface beat transfer coefficients. Equation B 1 can be recast as
(B2)
. The element
C
bas been eliminated by using the fact thatAD-BC= I. The functions DIB, liB and AlB are referred to
, as the Laplace transfer functions of the wall. The transfer function VB can be represented as
640
-
-
-
セ@ セMMᄋ@-
- - ----u
(B3)
where
U
=
the thermal transmittance of the wall;1,
=
the time constants of the wall, i.e., the poles of VBare at
s=-
Vt,;
s
=
the Laplace transform variable.Note that all of the transfer functions of Equation B2 have their poles at
s=-
Vt,,
since B is the common denominator.When predicting the response of a wall or roof to environmental temperature variations, it is more convenient to use z-transforms of the temperatures and fluxes rather than the Laplace transforms. (The z-transforms are sometimes referred to as the time-series representations of these quantities.) An equation similar to Equation B2 relates the z-transform of interior
beat"
flux,Z{QJ,
to thez-transforms of temperature, Z{T
J
and ZfTel• as follows:{ } D(z) 1
Z
Q;=
B(z) ·Z{T; }-
B(z) ·Z{Te}
(B4)The poles of D(zYJJ(z) and 1/B(z) are identical because they have the same denominator and are the same as the poles of
VB. Thus, determination of the frequency response of the
specimen permits determination of the principal poles of
D(zYIJ(z) and VB(z).
The z-transfer functions can be expressed by
where
z
4
NeD{z}
,"f:ocn. ,-n
- - =
u
ᄋセGMMMMB{z}
'l!d,
.,-n
(B5) n=O (B6)=
e'.d;=
interval between successive terms in the time series for temperature and beat flux=
the number of terms in the various sums=
z-transfer function coefficients.The d, coefficients can be detecmined from the poles of
liB. The
c,
andb,
coefficients can then be detennined bymatch.ing the calculated response to the measured response. Equation B4 can be written in the time domain as
where
Q .
=
interior heat flow per unit area at timetセ@ . t
T-
=
interior environmental temperature at ume1,1 • '
イセL@
=
exterior eovirorunental temperature at ume t.This form of the equation is equivalent to Equation 33 in Chapter 26 of Fundillnefllals (ASHRAE 1989). One significant 、ゥヲヲ・イセ」・@ between the two equations is that this form does oot assume that the interior environmental
temperature, T·,.
is constant. Hence, with this セオ。エゥッョL@ it is necessary to., know the individualc,.
coeffiCtents rather than just the sum. as is required with the fオョ、。ュ・ヲャャ。セ@version. A second minor difference is that U-value .tS
incorporated in the values of b,. and
c,.
tabulated mFundamefllals; it is not incorporated in the b,. and c,.
coefficients of Equation B7. .
Values of D/B for a test specimen can be determmed
by measuring the heat flux through the セセュ@ side (interior) of the specimen in response to an exCttation on the room side of the specimen. Similarly, values of VB can be determined for a test specimen by measuring the beat flux through the room side of the specimen in respo?se to an excitation on the outside (exterior) of the spectmen. It should be noted that different values of DIB and VB will be
detennined depending on whether the surface to surface or environment-to-environment response is measured. i.e., whether the interior and exterior fJJ.m coefficients are included or not. The z-transfer function coefficients values listed in Fundamefllals include fixed interior and exterior
ftlm coefficients. . de
rmioed
A finite number of time constants can be te . from the experimental results that best match the response calculated with Equation B3 to the measured val.ues of VB.
This finite series of time constants approximates the infinite series of time constants that theoretically
セーイ・セョエ@
the response of the specimen. V aloes of dn for a ァャセ・ョ@ ume . terval 11, can then be determined by equaung the
セョ・ョッュゥセ。エッイウ@
of liB( z) (Equation B6) and . VB(Equation B3). The number of significant dn coeffiCteots determined by this procedure is dependent .on the ma nitudes of the time constants. These dn coeffiCteots are glicable to
both
D(zYB(z) (Equation B5) and VB(z)セオ。エゥッョ@
B6), and these equations can beオセ@
todetermine values of b,. and
en
appropriate to the specunenunder consideration. . . .
A fmal point to be noted in a discusslon of dynamic thermal performance is that the steady-state chermal
...H of
terials
are to a greater or lesser extent. aprope,ues ma ' rial One
function of the mean temperature of the mau: · consequence of this sensitivity is that the dynauuc セーッョウ・@
ill be sensitive to mean temperature. Thermal reststance
:r
most insulation materials is especially、・ー・セセエ@
ッセ@
:e
mean temperature of the material. The sensttiVlty':aUU:
them:W resistance of an insulated wall to mean セー・@
.
·u
depend not only on bow sensitive the insulation ts to[セ@
temperature but also on the ratio of beatヲャセ@
through the insulation to beat flux through the thermal bndge. 1beASH RAE Transactions: Research
latter point is important because the thermal resistance ot thermal bridges is not usually a function of mean temperature.
TEST PROCEDURE
The test procedure for measuring the dynamic heat transfer characteristics of full-scale wall specimens
was
executed in a guarded hot box facility that had been calibrated using the procedure described in the body of this paper. The procedure consisted of a series of measurements of the response of the test specimen, and facility, to
sinusoidal variations of exterior temperature and of interior power. The steps in the procedure, which were all conducted with a mean interior temperature of approximately 21
oc
[70°F], are as follows:1. Measure thermal resistance of the specimen with exterior tempernture of -20°C ( -4 °F].
2. With guarded hot box calorimeter (interior) power flXed at that determined in Step 1 and mean exterior temperature flxed at -20°C [-4°F], measure response of the specimen to sinusoidal variations in exterior temperature of amplitude 15K [27°F] at periods of 24, 12, and 6 hours, plus 48 hours for heavier specimens. 3. . Measure thermal resistance of the specimen with
exterior temperature of -35°C [-31 °F].
4. With mean calorimeter power fixed at that determined in Step 3 and exterior temperature flXed at -35°C [-31°F], measure response of the specimen to
sinusoidal variations in calorimeter power of amplitude 60 W at periods of 24, 12, and 6 hours, plus 48 hours for the heavier specimens.
5.
Thermal resistance was monitored throughout the test procedure by determining it from the mean values of temperature and heat flux that were measured for each test period in Steps 2 and 4 and also by repeating Step 1 at the end of the procedure. This latter test was oonducted to ensure that no' significant change had occurred to the specimen during the test series. For the pwposes of this research project, thermal resistance was also measured at an exterior temperature of -5°C (23"F]. This measurement provided a measuredthermal resistance value at a third mean temperature and was used, with the values measured in Steps 1 and 3, to determined the mean temperature dependency of the
thermal resistance.
Values of
DIB
for the specimen were determined at the test periods from the data measured in Step 4 and from the test apparatus dynamic calibration. Values ofliB
for the specimen were determined at the test periods from the data measured in Step2.
from the test apparatus dynamic calibration, and from the values ofDIB
detennioed above.Data
fa- both transfer functions were normalized to the thermal resistance measured for the specimen. Thus..
varialions in thennal resistance due to mean temperature were
accommodated
in the normalized transfer funclions.A minimi7.ation procedure was used to determine time constants that best matched the response calculated with Equalion B3 to the measured values of VB. Values of d,. were then detennined by equating the denominator of
1/B(z) (Equation B6) with a time interval, A, of 1 hour to the denominator of VB (Equation B3).
Values of b,. were determined in three steps:
1. Equation B3 was used to calculate the response at 1 hour time intervals to a unit ramp temperature
change.
· ,.
2.
The response to a unit triangular pulse was determined from the calculated ramp response; notethat this produced the response factors for the specimen.
3. Equation B6 was used to generate b,. coefficients that matched the unit triangular pulse response.
Values of
c,.
were determined for most specimens byfitting Equation B5 to the frequency イ・ウーッョウセ@ measured at two periods, typically 24 and 6 hour. This gave an exact fit to the data at the fitted periods and produced a series of five coefficients that gave a good fit to the frequency response measured at 12 hour, and to 48 hour if it had also been measured. However, for the lighter specimens, a fit at only 12 hour gave a series of three coefficients that adequately represented the measured frequency response.