B
ULK
G
LASS
F
ORMATION
in
E
UTECTIC
of
La-Cu-Ni-Al
M
ETALLIC
A
LLOYS
Yong Zhang, Hao Tan, and Yi Li
Abstract—A eutectic in La-rich La-Cu0.5Ni0.5-Al alloys was
determined by studying the melting behaviors and the microstructure observations. The microstructures of the La-Cu-Ni-Al alloys prepared by Bridgman Solidification and copper mould casting were studied by using scanning electron microscope (SEM). The results show that La66[Cu0.5Ni0.5]20Al14
alloy is very near to a pseudo-ternary eutectic. When the cooling rate is higher than 450 K/s, fully amorphous can be formed; when the cooling rate is within 15 K/s to 450 K/s, the alloy has a microstructure of dendrite plus amorphous, when the cooling rate is within 12 K/s to 1.5 K/s, the microstructures of the alloy are dendrite plus eutectic, and when the cooling rate is lower than 0.12 K/s, the morphology of the alloy is eutectic microstructure. The off eutectic alloy has better glass forming ability, the best glass forming alloy obtained at La62[Cu0.5Ni0.5]24Al14 along the
composition line of La86-x[Cu0.5Ni0.5]xAl14. It has a potential to
form bulk metallic glassy rod samples with diameter larger than 12 mm.
Index Terms—amorphous materials, Lanthanum alloys,
cooling, metallic glasses.
I. INTRODUCTION
I
n recent years there has been increasing interests in the exploring of bulk metallic glass (BMG) formers which can be produced with lower cooling rates, e.g. by metal mould casting[1, 2, 3], because the BMGs exhibit unique properties compared with its counterparts-crystalline materials. It has been reported that Zr-based BMGs exhibit very large elastic limit (about 2%) which can be compared with polymer materials but have very high strength (about 1600 MPa) [2]; Fe-based BMGs exhibit excellent magnetic properties [4]; Cu-based BMGs exhibit very high strength (2000 MPa) [5]; moreover the BMGs are master materials to prepare bulk Nano materials by controlled crystallizations [6, 7]. While for the formation of BMGs, at what compositions the multi-component alloys have the best glass forming ability(GFA) is a widely interesting question, because the answer to this question would be very helpful to find new BMG formers. From the nucleation and growth theory, Turnbull [8] suggested that the alloy with large reduced glass transition temperature Trg, which is defined by Tg/Tl, where Tg is glass transition temperature and Tl is liquidus temperature, will have large GFA. Li’s group [9] studied the GFA of La-based alloys by Bridgman solidification, and found that the GFA is strongly related to the value of Trg. Their further study [10] also showed that the Tl is much more important than the Tm (Tm is the solidus temperature) in evaluating the GFA of an alloy. The Tg/Tl has been used successfully in the exploring of CuTiZr [5], TiCuNiSnBe [11], ZrCuAl [12], ZrTiCuNiBe [13], and NdYFeAl [14]bulk glass formers. Because the liquid at the eutectic composition can be stable to a lower temperature, and the interval between the liquidus temperature and the glass transition temperature is small, this facilitates to avoid the crystallization when the liquid is cooled from high temperature to lower temperature and facilitate to form a glass. Generally, Tg is less dependent on the composition and Tl is a minimum at the eutectic composition, therefore, Trg will reach a maximum at the eutectic composition. So the best glass former is lower lying eutectics. However, there were reports about that the best GFA obtained at off eutectic in Al-Ni-Fe-Gd alloy [15] and at compound for solid state reactions [16].
La55Ni20Al25 alloy [1] was the first reported alloy which can form BMG without containing noble metals, and the alloy has a wide supercooled liquid region ∆Tx about 69 K [1]. In 1993, Inoue’s group [17] prepared La-based BMG by using high-pressure die casting method, and formed bulk glassy rods with diameter of 3 mm for La55Al25(Ni or Cu)20, 7 mm for La55Al25Ni10Cu10 and 9 mm for La55Al25Cu10Ni5Co5, and proposed that the glass forming ability (GFA) are closely related to ∆Tx.
A series of work have been done to look for the eutectic for the ternary alloy in La and Pr-based ternary alloys by Differential temperature analysis (DTA) or differential scanning calorimetry (DSC) combined with microstructure observation[18, 19]. Tan [18] found that the best glass former in La-Cu-Al ternary alloy is at a eutectic composition La66Cu20Al14, and 2 mm diameter glassy rod samples were formed by copper mould suck casting. In this paper, the eutectic in La-rich La-Cu0.5Ni0.5-Al alloys was determined by studying the melting behaviours and the microstructure observations. The rod samples for the microstructure observation were prepared by copper mould casting with dimension of 12 mm diameter rod, and by Bridgman solidification with different Manuscript submitted Oct. 31, 2002. This work was supported by
Singapore-MIT Alliance.
Y. Zhang, Research Fellow, Advanced Materials for Micro- & Nano-Systems, Singapore-MIT Alliance, National University of Singapore, phone: 65-68748781; fax: 65-67752920; email: smazy@nus.edu.sg;
H. Tan, PHD Graduate Student, Materials Science Department, Science Faculty, National University of Singapore, phone: 65-68741267; fax: 65-67763604; email: scip0212@nus.edu.sg;
Y. Li, Fellow of Singapore-MIT Alliance, also Associate Professor of Material Science Department, National University of Singapore, phone: 65-68743348; fax: 65-67763604; email: masliy@nus.edu.sg.
growth rates.
II. EXPERIMENTAL PROCEDURE
The ingots were prepared by arc-melting a mixture of pure La (99.9%), Al (99.9%), Ni (99.98%) and Cu (99.999%) in an argon atmosphere. The composition is nominally expressed in atomic percent and the La86-x[Cu0.5Ni0.5]xAl14 alloys where x=16, 18, 20, 22, 24, 27 and 29, were named by L70, L68, L66, L64, L62, L59, and La57, respectively. Each master ingot was firstly melted five times, and then crushed, and remeltedfour times. The ingots were then cast by pouring the molten alloy into a copper mould with a dimension of φ12×60 mm in the arc-melting chamber. The 12 mm diameter rod samples were transversally cut into 2 slices with thickness of 1.5 mm at a position 15 mm above the bottom, the rod about 10 mm long from the bottom were cut longitudinally again. Then one slice and one half of the cut rod were mounted and polished for observation under a scanning electron microscope (SEM) and optical microscopy (OM). The degree of amorphicity of all samples was examined by a X-ray diffraction (XRD, with Cu Kα radiation) on the transverse section of the whole ingot. The other slice was used for differential scanning calorimetry (DSC), central part of the slices was chosen because it has the slowest cooling rate in the whole section. The DSC was performed with a heating rate of 40 K/min. Bridgman solidification was carried out by inductive melting the alloys in vacuum sealed quartz tubes with 3 mm internal diameter and a wall thickness of 0.5 mm. It involved remelting prior to steady withdrawal at constant pre-determined velocity in the range of 0.008-4.82 mm/s through a temperature gradient of 15 K/mm into a water bath. In addition, ribbon sample for this alloy was obtained by the single roller melt-spinning method in an argon atmosphere. III. RESULTS 0.0 0.2 0.4 0.6 0.8 1.0 0.0 0.2 0.4 0.6 0.8 1.0 0.0 0.2 0.4 0.6 0.8 1.0 E D C B A
Cu
0.5Ni
0.5Cu
0.5Ni
0.5Al
La
La
, a
t%
A
l
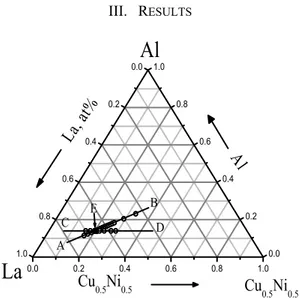
Fig. 1. Alloy compositions studied in this paper.
Figure 1 shows the compositions in the La-Cu0.5Ni0.5-Al alloy system, the melting behaviours of the alloys along the
compositional lines AB and CD were studied, and point E was found very near to the pseudo-ternary eutectic. Figure 2 (a) shows the Tm and Tl as a function of Cu0.5Ni0.5 content. The figure shows clearly that the Tm keeps a constant value at 680 K and Tl exhibits a minimum value at La66[Cu0.5Ni0.5]20Al14, indicating L66 is very near the eutectic. Figure 2 (b) shows the Tm and Tl as a function of composition of Al content. It is almost the same as Fig.2 (a) that the Tm keeps at the same constant value and Tl exhibits a minimum value at La66[Cu0.5Ni0.5]20Al14, it verifies that L66 alloy is very near to the pseudo ternary eutectic.
16 18 20 22 24 26 28 30 650 700 750 800 850
T
lT
mLa
86-x[Cu
0.5Ni
0.5]
xAl
14Temperature (K)
Cu
0.5Ni
0.5(at%)
Fig. 2 (a). Solidus Tm and liquidus Tl curves along the compositional line of CD
in Fig.1.
Fig. 2 (b). Solidus Tm and liquidus Tl curves along the compositional line of AB
in Fig.1.
Figure 3 (a), (b), (c), (d) show the morphologies of L66 alloy prepared by Bridgman solidification with growth rates of V=0.008 mm/s, 0.1 mm/s, 0.8 mm/s, and 1 mm/s, respectively. The cooling rate R can be expressed by: R=GV, G is the temperature gradient, here G=15 K/mm, so the corresponding cooling rates are 0.12 K/s, 1.5 K/s, 12 K/s, and 15 K/s,
respectively. From the Fig.3 (a), for the slowest cooling rate, 0.12 K/s, the morphology is mainly eutectic. When the cooling rate is about 1.5 K/s, the morphology is dendrite plus eutectic, as shown Fig. 3 (b). When the cooling rate is 12 K/s, the morphology is also dendrite plus eutectic, and the eutectic has very small spacing [Fig. 3 (c)]. And when the cooling rate is 15 K/s, the morphology is dendrite plus amorphous [Fig. 3 (d)], this indicates that the eutectic has transited to amorphous.
Fig. 3 (d). SEM Photograph for the L66 alloy prepared by Bridgman solidification with a growth rate of 1 mm/s.
XRD were also carried out for the L66 alloys prepared by Bridgman solidifications with different growth rates, as shown in Figure 4. The XRD patterns show that there is a broad maxima and a few of crystalline peaks for the samples prepared with growth rates of 1 mm/s and 4.8 mm/s, this indicates that the alloys prepared by this two growth rates are mixtures of crystalline phase and amorphous phase, the crystalline phase is α-La solid solution [20]. For the samples prepared with lower growth rates (0.8, 0.6, and 0.5 mm/s), there are more crystalline peaks, and no amorphous maxima, this indicates that the alloys have fully crystallized, the crystalline phases are α-La solid solution, La(Cu, Ni) intermetallic compound [21] and LaAl intermetallic compound [22]. Figure 5 shows the DSC heating curves of the L66 alloy samples prepared by Bridgman solidification. It also shows that when the growth rates are 0.5, 0.6 and 0.8 mm/s, there is no crystallization process, and when the growth rates are 1 and 4.8 mm/s, there is a distinct glass transition followed by a single exothermic peak corresponding to the crystallization process. This is in good agreement with the XRD and SEM results.
Fig. 3 (a). SEM Photograph for the L66 alloy prepared by Bridgman solidification with a growth rate of 0.008 mm/s .
30 40 50 60 70 80 90 La(Ni,Cu) αLa J J J J J J J J J J J J La66[Cu0.5Ni0.5]20Al14 3 mm-diameter rod 0.5mm/s 0.6mm/s 0.8mm/s 1mm/s 4.8mm/s
In
te
ns
it
y (
a.
u.
)
2
θ
(Degree)
Fig. 3 (b). SEM Photograph for the L66 alloy prepared by Bridgman solidification with a growth rate 0.1 mm/.
Fig. 4. XRD patterns of L66 alloys prepared by Bridgman solidification. Fig. 3 (c). SEM Photograph for the L66 alloy prepared by Bridgman
400 500 600 700 800 Tg 1 mm/s 0.8 mm/s 0.6 mm/s 4.8 mm/s 0.5 mm/s Ex ot hermic (a.u .) Temperature (K)
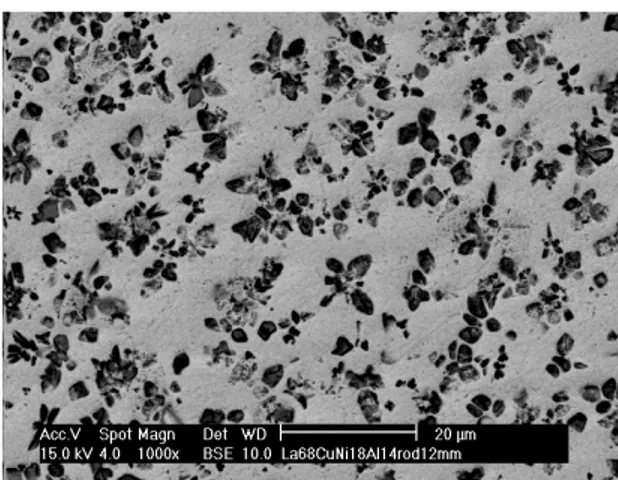
Fig.6 (b). The SEM photographs of 12 mm diameter rod sample in the central part of the ingot L68.
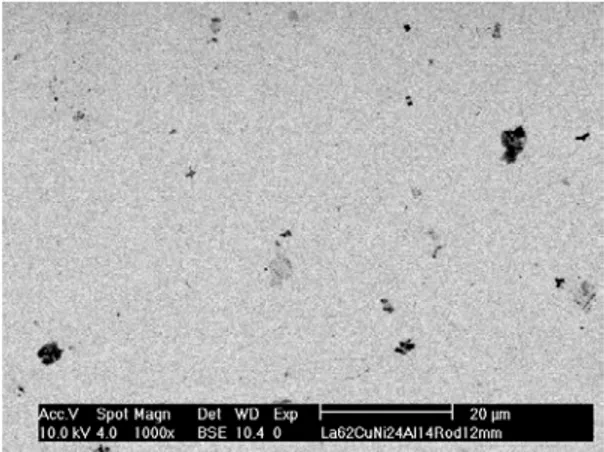
Fig. 5. DSC heating curves of L66 alloys prepared by Bridgman solidification. In order to compare the GFA of the alloys of L57, L59, L62, L64, L66, L68, and L70, rod samples with diameter of 12 mm were prepared by copper mould casting and the central part of the rod sections were observed by SEM. Figure 6 (a), (b), (c), (d), (e), (f), and (g) show the morphologies of the central parts of all the seven cast ingots respectively. We can see that it is a primary phase plus amorphous for L70, and L68 alloys, while the former contains more primary phases. For the alloy of L66, the morphology is a dendrite phase plus amorphous phase, and for L64 alloy, there is a small amount of dendrite plus amorphous matrix, and for the alloy of L62, it almost shows a featureless microstructure, indicating that the sample is very near to the fully amorphous. For the alloy of L59, it shows mainly eutectic microstructure, and for alloy L57, it shows a structure of eutectic plus an intermetallic compound.
Fig. 6 (c). The SEM photographs of 12 mm diameter rod sample in the central part of the ingot L66.
Fig.6 (d). The SEM photographs of 12 mm diameter rod sample in the central part of the ingot L64.
Fig. 6. (a). The SEM photographs of 12 mm diameter rod sample in the central part of the ingot L70.
Fig. 6 (e). The SEM photographs of 12 mm diameter rod sample in the central part of the ingot L62.
Fig. 6 (f). The SEM photographs of 12 mm diameter rod sample in the central part of the ingot L59.
Fig.6 (g). The SEM photographs of 12 mm diameter rod sample in the central part of the ingot L57.
Figure 7 shows the XRD patterns of the 12 mm rod transverse sections for all the seven alloys, there are crystalline peaks superimposed on a wide diffused peak for the alloys of L70, L68, L66, L59, and L57. This indicates that these rod samples are a mixture of amorphous and crystalline phases. The crystalline phases were identified as hcp α-La and La(Cu,Ni) intermetallic compound [20, 21] for L59, and L57 alloys, and
α-La (with texture) for L70, L68 and L66 alloys. For the alloy of L64, only a small amount of crystalline peaks can be observed superimposed on a diffused amorphous peak, this indicates the sample is mainly amorphous with a small amount of crystalline phases. The diffraction pattern of alloy L62 shows a wide diffused peak, and no observable crystalline peaks, indicating that the rod sample for this alloy is mainly amorphous. 30 40 50 60 70 80 90 α-La* La(Cu, Ni) α-La J J J J J Q J L59 L62 L64 L66 L68 L70 Q Q Q Q Q Q Q J J J J J J J Rod 12 mm L57
In
te
ns
ity
(
a.u
.)
2
θ
(Degree)
Fig. 7. XRD patterns of the transversal sections of the12 mm diameter rods.
400 500 600 700 800 900 Tm Tl Tx Tg L57 L59 L62 L64 L66 L68 L70 Exothermi c ( a.u.) Temperature (K)
Fig. 8. DSC heating curves of the central part of 12 mm diameter rod samples. Figure 8 shows the DSC curves of the central parts of the seven cast ingots. From the figure, the L70, L68, L66, L64, and L62 alloys exhibit exothermic peaks corresponding to the crystallization process, indicating that these parts of the rod samples which have the slowest cooling rate of the whole ingot contain amorphous phase. However, there is no exothermic peak for L59 and L57 alloys, indicating there is no amorphous existing in the central part for the two alloys. The followed
endothermic peaks are corresponding to the melting process, and the Tl and Tm of the alloys can be determined.
As the L62 alloy exhibits the best GFA, its critical cooling rate was measured by Bridgman solidification [9]. Figure 9 (a) shows the morphology of L62 alloy with a growth rate of 0.1 mm/s, it is eutectic plus intermetallic compound. For the sample with growth rate of 0.5 mm/s, it shows mainly eutectic with much finer spacing, as shown in Fig. 9 (b). When the growth rate reaches 0.6 mm/s, the microstructure is a featureless structure excluding a small amount of inclusions, indicating the eutectic microstructure has transited to amorphous, as shown in Fig. 9 (c). The DSC heating curves also show that when the growth rates are 0.1, 0.2, and 0.5 mm/s, there is no crystallization process, and when the growth rates are 0.6, 0.8, and 1 mm/s, there is a distinct glass transition followed by a multiple exothermic peak corresponding to the crystallization process, as show in Figure 10. Therefore the critical growth rate for L62 alloy is about 0.6 mm/s, and the corresponding critical cooling rate is 9 K/s, compared with the copper mould casting results, the lowest cooling rate of 12 mm diameter rod is about 15 K/s [23], they are in good agreement.
Fig. 9 (c). SEM Pictures of L62 alloys prepared by Bridgman solidification with growth rate of 0.6 mm/s.
400 480 560 640 720 800 880
La62[Cu0.5Ni0.5]24Al14 3mm-diam
rods by Bridgman Solidification
1 mm/s 0.8 mm/s 0.6 mm/s 0.5 mm/s 0.2 mm/s 0.1 mm/s Tl Tg
He
at
F
lo
w
Temperature (K)
Fig. 10. DSC heating curves of L62 alloy prepared by Bridgman solidification with different growth rates.
Fig. 9 (a). SEM Pictures of L62 alloys prepared by Bridgman solidification with a growth rate of 0.1mm/s
IV. DISCUSSION
From the DSC results [Fig. 8], the alloys of L70, L68, L66, L64, and L62 exhibit a glass transition and a crystallization process, while for alloys L59 and L57, there are no crystallization peaks. This is because the amorphous phase in the former alloys are mixed uniformly with the crystalline phases, while for the latter alloys, only the outer ring of the ingot is amorphous. As the cooling rate of the central part is the lowest in the rod sample, about 15 K/s [23], the critical cooling rates for the amorphous phase in the alloys of L70, L68, L66, L64, and L62 are also 15 K/s, or lower. This indicates that larger sized BMG (at least larger than 12 mm) can be formed if we can reduce the volume fraction of the primary phase and remove it by modifying the composition. As the primary phase is mainly La, so reducing the La content can lead to larger GFA, this was verified in the L62 alloy as shown above.
Fig. 9 (b). SEM Pictures of L62 alloys prepared by Bridgman solidification with a growth rate of 0.5 mm/s.
The best glass former in these alloys is L62, its Tg, Tx, Tm, and Tl are 423, 452, 684, and 744 K, respectively. The supercooled liquid region ∆Tx is 29 K, it is rather small. ∆Tx
V. CONCLUSION can serve as an indicator of the thermal stability of the
supercooled liquid [23] and for some alloys, the thermal stability has a positive correlation with the GFA [24, 25]. However, thermal stability of the supercooled liquid is different from GFA. The former is the resistance against the crystallization from the supercooled liquid during heating, the latter is the ease of suppression of the crystallization from the liquid in the cooling process and these two processes are rather different [26]. Thus a small ∆Tx may not often indicate a low GFA. Amiya et al [27] also found MgYCuAgPd BMG with 12 mm diameter rod has a small ∆Tx of 32 K. The reduced glass transition temperature, Trg for L62 alloy is 0.57. This is relatively high in La based alloys. However, the largest Trg is reached at the eutectic L66, Trg=0.59. But we cannot obtain fully glassy 12 mm rod for this alloy (a dendrite plus amorphous instead). The reason is under investigation.
In conclusion, La66[Cu0.5Ni0.5]20Al14 is a pseudo-ternary eutectic in La-Cu0.5Ni0.5-Al alloy system. This eutectic system has a skewed eutectic coupled growth zone. When the cooing rate is very low, the alloy has a eutectic morphology and when the cooling rate is within 1.5 K/s to 12 K/s, the morphologies are dendrite plus eutectic. When the cooling rate is higher than 15 K/s, it shows dendrite plus amorphous. The best glass forming alloy is at off-eutectic composition L62. When the cooling rate is 1.5 K/s, the morphology of L62 is intermetallic compound plus eutectic and when the cooling rate is 7.5 K/s, it shows mainly eutectic. When the cooling rate is higher than 9 K/s, it shows mainly amorphous. For this alloy, near 12 mm diameter cylindrical amorphous sample can be obtained by copper mould casting.
ACKNOWLEDGMENT
Y. Zhang would like to thank Singapore-MIT Alliance, and Materials Science Department, without their cooperation, I could not finish the work.
16 18 20 22 24 26 28 30 200 300 400 500 600 700 800 900 Eutectic Liquid Tx Liquid + compound Liquid + Solid Solution
Tg Tm Tl La86-x[Cu0.5Ni0.5]xAl14 T em perat ur e (K ) Cu0.5Ni0.5 REFERENCES
[1] Inoue, T. Zhang, and T. Masumoto, “Al-La-Ni Amorphous Alloys with a Wide Supercooled Liquid Region”, Mater. Trans., JIM, Vol.30(12), pp. 965-972, Dec.1989.
[2] W.L. Johnson, “Bulk Glass-Forming metallic Alloys: Science and Technology”, MRS Bulletin, pp.42-56, Oct. 1999.
[3] Y. Li, H. Jones, and H.A. Davies, “Determination of Critical Thickness for Glass Formation in New Easy Glass Forming Magnesium-Base Alloys by the Wedge Chill Casting Technique”, Scripta Metall., Vol.26, pp.1371-1375, 1992.
[4] A. Inoue, T. Itoi, H. Koshiba, A. Makino, “High-frequency permeability characteristics of Fe- and Co-based amorphous alloys with high B concentrations”, IEEE Tran. On mag., Vol.35(5), pp.3355-3357, Sep. 1999.
[5] Inoue, W. Zhang, T. Zhang, K. Kurosaka, “High-Strength Cu-Based Bulk Glassy Alloys in Cu-Zr-Ti and Cu-Hf-Ti Ternary Systems”, Acta Mater. Vol.49, pp. 2645-2652, 2001.
Fig. 11. Phase diagram of the compositional line along CD in Fig.1.
[6] K. Lu, J. T. Wang, and W. D. Wei, “A New Method for synthesizing nanocrystalline alloys”, J. Appl. Phys., Vol.69(1), pp. 522-524, 1991. L66 is the pseudo-ternary eutectic, but it shows eutectic
morphology only at very low cooling rate [Fig. 3 (a), 0.12 K/s). When the cooling rate increases, this alloy will show a microstructure of dendrite plus eutectic and the dendrite is α-La solid solution. So this eutectic system may have a skewed eutectic coupled zone. When the cooling rate increases further, the morphology is dendrite plus amorphous. So the eutectic is easier to transit to amorphous. This is similar to the formation of amorphous by multilayer solid-solid reaction [28]. At the off-eutectic, L62, with less La, when the cooling rate is as high as 7.5 K/s, the morphology is eutectic, but with very small spacing, and when the cooling rate is lower, it shows compound plus eutectic, so the pseudo-ternary eutectic contains intermetallic compound, as shown in Figure 11. Therefore, the eutectic reaction can be expressed by:
[7] W.H. Wang, D.W. He, D.Q. Zhao, and Y.S. Yao, “Nanocrystallization of ZrTiCuNiBeC Bulk Metallic Glass Under High Pressure”, Vol.75 (18), pp.2770-2772, 1999.
[8] D. Turnbull, “Under What Condition can a Glass be Formed?”, Contemp. Phys., Vol.10(5), pp 473-488, 1969.
[9] Z. P. Lu, T. T. Goh, Y. Li, S.C. Ng, “Glass Formation in La-based La-Al-Ni-Cu-(Co) Alloys by Bridgman Solidification and Their Glass Forming Ability”, Acta Mater., Vol.47(7), pp.2215-2224, 1999. [10] Z.P. Lu, H. Tan, Y. Li, and S.C. Ng, “The correlation between reduced
glass transition temperature and glass forming ability of bulk metallic glasses”, Scr. Mater., Vol. 42 (7), pp. 667-673, Mar. 2000.
[11] Y. C. Kim, W.T. Kim, D.H. Kim, “Glass Forming Ability and
Crystallization Behavior in Amorphous Ti50Cu32-xNi15Sn3Bex (x=0, 1, 3, 7)
Alloys”, Mater. Trans, Vol.43(5), pp.1243-1246, May 2002.
[12] Y. Yokoyama, H. Inoue, K. Fukaura, A. Inoue, “Relationship Between the Liquidus Surface and Structures of Zr-Cu-Al Bulk Amorphous Alloys”, Mater. Trans., Vol.43(3) pp.575-579, Mar. 2002.
[13] T. A. Waniuk, J. Schroers, W.L. Johnson, “Critical Cooling Rate and Thermal Stability of Zr-Ti-Cu-Ni-Be Alloys”, Appl. Phys. Lett., Vol. 78(9), pp.1213-1215, 2001.
L=>La (solid solution)+La(Cu, Ni)+LaAl.
[14] K. Q. Qiu, H. F. Zhang, A.M. Wang, B.Z. Ding, Z.Q. Hu, “Glass-forming ability and thermal stability of Nd70-xFe20Al10Yx alloys”, Acta Mater. Vol.50, pp.3567-3578, 2002.
[15] Y. He, S.J. Poon, G.J. Shiflet, “Synthesis and Properties of Metallic Glasses that Contain Aluminum”, Science, Vol. 241, pp1640-1642, 1988.
[16] R. J. Highmore, and A. L. Greer, “Eutectic and the Formation of Amorphous alloys”, Nature, Vol.339, pp. 363-365, 1989.
[17] Inoue, T. Nakamura, T. Sugita, T. Zhang, and T. Masumoto, “Bulky La-Al-TM (TM=Transition Metal) Amorphous Alloys with High Tensile Strength Produced by a High-Pressure Die Casting Method”, Mater. Trans., JIM, Vol.34(4), pp.351-358, Apr. 1993.
[18] H. Tan, Z.P. Lu, H.B. Ya, Y.P. Feng, andY. Li, “Glass Forming Ability of La-rich La-Al-Cu Ternary Alloys”, Mater. Trans., Vol.42(4), pp.551-555, Apr. 2001.
[19] Y. Zhang, B. Yao, H. Tan, Y. Li, “The eutectic Point in Pr-rich Pr-Cu-Al Ternary Alloys”, J. of Alloys and Comp., Vol. 333, pp.113-117, 2002. [20] 2001 JCPDS-International Center for Diffraction Data, 02-0607; 2001
JCPDS-International Center for Diffraction Data, 51-1165. [21] 2001 JCPDS-International Center for Diffraction Data, 19-0654. [22] K. A. Gschneidner, Jr. and F.W. Calderwood, “La-Al phase diagram”, in:
Binary alloy phase diagrams, T. B. Massalski, ed. ASM, 1988.
[23] X.H. Lin, W.L. Johnson, “Formation of Ti-Zr-Cu-Ni Bulk Metallic Glasses”, J. Appl. Phys., Vol.78 (11), pp.6514-6519, 1995.
[24] Inoue, “Stabilization of Metallic Supercooled Liquid and Bulk Amorphous Alloys”, Acta Mater., Vol. 48, pp.279-306, 2000.
[25] Y. Zhang, D.Q. Zhao, R.J. Wang, M.X. Pan, W.H. Wang, “Glass Forming Ability and Properties of Zr/Nb-Based Bulk Metallic Glasses”, Mater. Trans., JIM, Vol.41(11), pp.1423-1426, Nov. 2000.
[26] J. Schroers, A. Masuhr, W.L. Johnson, R. Busch, “Pronounced asymmetry in the crystallization behavior during constant heating and cooling of a bulk metallic glass-forming liquid”, Phys. Rev. B, Vol.60(17), pp.11855-11858, 1999.
[27] K. Amiya, A. Inoue, “Preparation of Bulk Glassy Mg65Y10Cu15Ag5Pd5
Alloy of 12 mm in Diameter by Water Quenching”, Mater. Trans., Vol.42(3), pp.543-545, Mar. 2001.
[28] B.X. Liu. W.S. Lai, Z. J. Zhang, “Solid-state crystal-to-amorphous transition in metal-metal multilayers and its thermodynamic and atomistic modelling”, Adv. in Phys., Vol.50(4), pp. 367-429, Apr. 2001.
Yong Zhang, was born in HeBei Province, China, on Jun. 26, 1969. Doctor Degree, State Key Lab. for Advanced Metals & Materials, University of Science & Technology Beijing, China, 1998;
Master Degree, Materials Science & Engineering Department, University of Science & Technology Beijing, China, 1994.
Bachelor Degree, YanShan University, China, 1991.
Yong’s research work is on formation and properties of bulk metallic glasses and bulk metallic glass matrix composites.