Publisher’s version / Version de l'éditeur:
Vous avez des questions? Nous pouvons vous aider. Pour communiquer directement avec un auteur, consultez la
première page de la revue dans laquelle son article a été publié afin de trouver ses coordonnées. Si vous n’arrivez pas à les repérer, communiquez avec nous à PublicationsArchive-ArchivesPublications@nrc-cnrc.gc.ca.
Questions? Contact the NRC Publications Archive team at
PublicationsArchive-ArchivesPublications@nrc-cnrc.gc.ca. If you wish to email the authors directly, please see the first page of the publication for their contact information.
https://publications-cnrc.canada.ca/fra/droits
L’accès à ce site Web et l’utilisation de son contenu sont assujettis aux conditions présentées dans le site LISEZ CES CONDITIONS ATTENTIVEMENT AVANT D’UTILISER CE SITE WEB.
Proceedings of the CIE Symposium '04, x27:2004, pp. 146-149, 2004-09-01
READ THESE TERMS AND CONDITIONS CAREFULLY BEFORE USING THIS WEBSITE.
https://nrc-publications.canada.ca/eng/copyright
NRC Publications Archive Record / Notice des Archives des publications du CNRC : https://nrc-publications.canada.ca/eng/view/object/?id=8732a10f-5867-472f-9134-017b5ed78d0e https://publications-cnrc.canada.ca/fra/voir/objet/?id=8732a10f-5867-472f-9134-017b5ed78d0e
NRC Publications Archive
Archives des publications du CNRC
This publication could be one of several versions: author’s original, accepted manuscript or the publisher’s version. / La version de cette publication peut être l’une des suivantes : la version prépublication de l’auteur, la version acceptée du manuscrit ou la version de l’éditeur.
Access and use of this website and the material on it are subject to the Terms and Conditions set forth at
Photometric issues in healthy lighting research and application
Photometric issues in healthy lighting research and
application
Veitch, J.A.; Tosco, A-M.; Arsenault, C.D.
NRCC-47346
A version of this document is published in / Une version de ce document se trouve dans :
Proceedings of the CIE Symposium '04 - Light and Health: Non-Visual Effects,
Vienna, Austria, Sept. 30-Oct. 2, 2004, pp. 146-149
CIE Symposium '04 - Light and Health: Non-visual Effects, Vienna, Austria, Sept. 30 - Oct. 2, 2004
PHOTOMETRIC ISSUES IN HEALTHY LIGHTING
RESEARCH AND APPLICATION
Veitch, Jennifer A.; Tosco, Anna-Maria; Arsenault, Chantal D. National Research Council of Canada, Institute for Research in Construction
ABSTRACT
Research results suggest that health in industrialized countries might be improved if people received a greater quantity of light at the eye. Achieving this using current architectural and lighting practices poses several challenges for research and for application. This paper explores issues of measurement and photometry using data from a dedicated daylighting facility.
Keywords: photometry; light dose; daylight; electric light; research methods
1. INTRODUCTION
CIE, in Report 158, concluded that one of the general principles for light and health is that there may be a necessary daily light dose that is higher than the light exposure of most individuals in industrialized nations [1]. Another of the general principles is the need to specify the light dose in terms of the light at the viewer's eye, rather than on the viewed horizontal or vertical plane for which there are illuminance recommendations. These two recommendations pose several challenges for research and for application; this paper explores issues related to photometry.
Among the means to increase the daily light dose is to make use of daylight. Increasing light dose with daylight has the added advantage of energy efficiency because no electricity is required for its production. However, like any light source, effective daylight requires control. Direct sunlight through an unshielded window is too bright for comfort, and can also reduce task visibility. When given the opportunity, occupants of offices with regular glass windows will close the blinds to block direct sunlight [2,4]. Thus, the presence of a window does not ensure that a higher light dose will be received.
This paper reports data from an experiment comparing two ways to control daylight: a translucent daylight sandwich
panel and a neutral density glass window with a low-transmittance perforated fabric blind. The experiment included extensive measurements of mood, well-being, and office work performance of occupants. However, this paper reports only photometric measurements related to the light dose received at the occupants' seats, and luminous conditions in the rooms. 2. METHOD
2.1 Experimental conditions
The NRC/IRC Daylighting facility in Ottawa, Canada (45,32o N and 75,67o W) consists of identical side-by-side enclosed offices with full glazing above the workplane on a SSE-facing façade. Each room measures 2,89 m wide by 4,57 m deep. The rooms were furnished as 2-person shared offices with identical desk, chair, and computer. Each occupant faced 45 degrees left or right relative to the façade, with the façade in the field of view (Figure 1). To accommodate the entry door without crowding the occupants, the left-hand desk was slightly closer to the façade than the right-hand desk. The electric lighting in both rooms was a recessed paracube louvered system, with 3500 K, CRI>80 triphosphor lamps on electronic dimming ballasts, operated by daylight-linked dimming to maintain the desktop illuminance to at least 450 lx.
The Room A glazing was a translucent daylight sandwich panel system of 20% transmittance, with a centre section of 30% neutral density glass to provide a view. The centre section amounted to 11% of the total glazed area; thus, the net transmittance in Room A was 21%. Room B was completely glazed with a 30% transmittance neutral density glass, together with a perforated fabric blind of 5% transmittance that was pulled down on clear- and variable-sky days, for a net transmittance of 1.5%. The rooms had identical glazing areas. The blind permitted a view while limiting direct sun.
CIE Expert Symposium on Light and Health, Vienna, Austria, Sept. 30 - Oct. 2, 2004
Figure 1. Photographs of Room A (top panel) and Room B (bottom panel), taken at noon on March 3, 2004 from the doorway. Exposure time and f-stop were matched. The blind is lowered in room B.
2.2 Photometry protocol
Instruments automatically recorded illuminance values at 12 locations in each room; vertical exterior illuminance; temperatures; lighting control settings; and, electric energy use for lighting and supplemental heating, every 30 seconds, 7 days per week, for the six weeks of the experiment (mid-February to late March 2004). A separate weather station located on the building roof recorded global total and diffuse irradiance measurements.
Measurements at the viewer's location while experimental participants were in the rooms were impossible. Therefore we developed an extensive photometry protocol for days when there were no participants. We repeated these measurements on 8 days during the testing period, and on 8 occasions each day, between the hours of 09:00 and 16:30. (Detailed luminance and illuminance distribution measurements were taken on three other days, and will be reported elsewhere.)
The photometry protocol included illuminance measurements taken at the two
occupant seats. Illuminances on the six faces of a cube at approximately head height were supplemented by illuminance from a shielded sensor inclined at 25 degrees from vertical, modelled after the one described by Navvab, Siminovitch, and Love [3]. Figure 2 shows the instrumented office chair used for these measurements. Radiant and air temperature at torso height were also measured.
Figure 2. Instrumented office chair used for occupant location measurements.
Cubic illuminance head Shielded illuminance sensor
Photopic illuminances were used because there is no specific measurement unit for photobiological effects. Spectral irradiance measurements in the vertical plane at head-height of the seated occupants were taken to allow subsequent application of novel spectral responsivity curves. Spectroradiometric radiance measurements
from 6 vertical points on the walls were used to determine spot luminances, and to track radiance between 450-470 nm, the peak sensitivity range of photoreceptors for melatonin regulation [1].
3. RESULTS
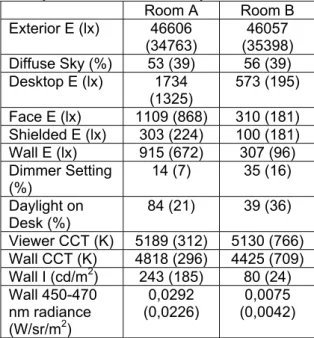
3.1 Comparing luminous conditions The photometry protocol was repeated 128 times for each room (8 days * 8 occasions * 2 desks). Descriptive statistics for key variables are shown in Table 1.
The ten selected interior measurements for the two rooms were compared using multivariate analysis of variance (MANOVA) (we ignored time-of-day as a variable because its effects are known). Only the correlated colour temperature (CCT) in the approximate location of the head of the
CIE Expert Symposium on Light and Health, Vienna, Austria, Sept. 30 - Oct. 2, 2004
seated viewer (Viewer CCT) was not different for the two rooms. This is unsurprising as the view was dominated by the computer monitor, which was identical in the two rooms. Room A delivered higher illuminance and luminance, a greater 450-470 nm radiance dose, and a slightly higher wall CCT, using less electric light (expressed here as dimmer setting) and with a greater percentage of the total illuminance from daylight, than Room B.
Table 1. Means and standard deviations (in parentheses) of illuminance conditions averaged across all seating positions, times of day, and measurement days.
Room A Room B Exterior E (lx) 46606 (34763) 46057 (35398) Diffuse Sky (%) 53 (39) 56 (39) Desktop E (lx) 1734 (1325) 573 (195) Face E (lx) 1109 (868) 310 (181) Shielded E (lx) 303 (224) 100 (181) Wall E (lx) 915 (672) 307 (96) Dimmer Setting (%) 14 (7) 35 (16) Daylight on Desk (%) 84 (21) 39 (36) Viewer CCT (K) 5189 (312) 5130 (766) Wall CCT (K) 4818 (296) 4425 (709) Wall I (cd/m2) 243 (185) 80 (24) Wall 450-470 nm radiance (W/sr/m2) 0,0292 (0,0226) 0,0075 (0,0042) Lighting Quality and Bothersome Glare ratings using NRC-developed scales showed that the higher illuminances were not perceived to be problematic: For the 41 participants in this counterbalanced repeated-measures design, the median overall Lighting Quality rating (scale of 0-4, higher scores indicate higher quality) for Room A was 3,0 and for Room B was 2,8; for Bothersome Glare, both medians were 0,5 (higher scores indicate more bothersome glare, range 0-4).
Even in rooms with 64% of the façade area glazed, and facing SSE, interior illuminances where occupants sit were 1-2 orders of magnitude lower than exterior illuminances. Moreover, the amount of light reaching the eye was quite small, as seen in the shielded illuminance values (Shielded E).
The intercorrelations between these variables were generally high, although the pattern differed somewhat within the two rooms (see next section). We particularly looked at correlations involving Shielded E. The apparatus was a custom adaptation, as no comparable commercial product yet exists. The correlation between Shielded E and the unshielded vertical sensor (Face E) was r=0,97. Therefore, perhaps a vertical unshielded sensor would provide equivalent information to the inclined shielded sensor, with the added benefit of being repeatable in other laboratories.
3.2 Predicting light dose
One goal of the detailed photometry protocol was to obtain sufficient information about relationships between the system state and the viewer-located measurements to predict the viewer-location values for the participant testing days, when it was impossible to measure them directly. We can then sum the predicted exposure values to determine the total light dose in each room over time. Variations in the light reaching the viewer occurred because of variations in the light sources, which were daylight and electric light. These light sources themselves varied by time and date. Six separate regressions were run (four room and desk geometries and, in room B, split by the presence or absence of the window blind) with four independent variables: Exterior E, Dimmer %, Date, and Time. For this paper, we selected two dependent variables of those shown in Table 1: Shielded E and Face E.
The six linear regression models were statistically significant for both dependent variables, but the accuracy of the model varied for different geometries. Table 2 shows a summary for the prediction equations, omitting the regression weights for date and time. The effect of lowering the blind in room B was to reverse the relative importance of electric light (Dimmer %) and illuminance from outdoors (Exterior E).
Explained variance was highest under conditions of diffuse daylight [in room A and in room B on cloudy days (no blind)]. When direct daylight was occasionally present [in room B on clear days (blind down)], there was more noise in the data and the percentage of explained variance was lower. The orientation of the rooms resulted in the
CIE Expert Symposium on Light and Health, Vienna, Austria, Sept. 30 - Oct. 2, 2004
left desk receiving more direct sun than the right, and therefore it showed poorer predictions. This phenomenon affected the Face E sensor more than the Shielded E sensor.
Table 2. Explained variance and Beta weights for Dimmer % (D%) and Exterior E (EE) regressed on two dependent variables. NB: no blind. B: blind. All statistics p<.05 except a. A analyses, df=4, 58. B-NB analyses df=4, 11. B-B analyses df=4, 43. Shielded E Face E Room R2 β-D% β-EE R2 β-D% β-EE A Left ,96 ,12 1,0 ,97 ,07 ,99 Right ,96 ,12 1,0 ,97 ,11 1,0 B-NB Left 1,0 ,52 1,3 ,99 ,10a 1,1 Right ,99 ,28 1,2 ,99 ,15 1,1 B-B Left ,82 1,0 ,47 ,40 ,34 ,45 Right ,91 ,98 ,52 ,48 ,52 ,46 4. DISCUSSION
These analyses are part of a larger experiment concerning the effects of these lighting conditions on office occupants. These analyses are ongoing. These measurements alone reveal issues for both researchers and designers. For researchers:
− A detailed measurement protocol can supply predicted photometric scores when direct measurement is impossible, but requires a thorough understanding of the lighting geometry and optics.
− Streamlined procedures and inexpensive field monitoring equipment are needed to facilitate studying light dose effects. This protocol and post-processing were very labour-intensive.
− A shielded inclined illuminance sensor might be a more stable device for recording light dose than an unshielded vertical sensor (particularly under daylit conditions), but a common design is needed as well as evidence that this metric predicts behavioural and physiological responses.
Concerning design, this work leads to the following conclusions:
− Achieving high interior illuminances at viewers' locations is a design challenge,
particularly if one wishes to avoid glare from direct sunlight.
− The translucent daylight sandwich panel delivered high light levels without compromising ratings of lighting quality. REFERENCES
[1] COMMISSION INTERNATIONALE DE L'ECLAIRAGE, CIE 158:2004, Ocular
lighting effects on human physiology and behaviour. CIE, Vienna, Austria, 2004.
[2] INOUE, T, KAWASE, T, IBAMOTO, T, TAKAKUSA, S, & MATSUO, Y, The development of an optimal control system for window shading devices based on investigations in office buildings ASHRAE
Trans, 94, 1034-1049, 1988.
[3] NAVVAB, M, SIMINOVITCH, M, & LOVE, J, Variability of daylight in luminous environments J Illum Eng Soc, 26(1), 100-114, 1997.
[4] REINHART, CF & VOSS, K, Monitoring manual control of electric lighting and blinds Ltg Res & Tech, 35, 243-260, 2003.
ACKNOWLEDGEMENTS
These data were collected as part of the NRC/IRC project “Kalwall Translucent Glazing System for Daylighting: Effects on Health and Task Performance” (NRCC Project # B3219), supported by Keller Companies, Inc., and the National Research Council of Canada. The authors are grateful to Teresa Campeau, Cara Donnelly, Anne Fitz, Anca Galasiu, Karen Liu, Roger Marchand, Guy Newsham, Christoph Reinhart, Peter Richards, Sue Rogan, Jana Svec, David van Reenen (NRC); Amy Keller Gleed, Cindy Shirey (Keller Co.); Bill Wilder and the installation crew (Kalwall Corp.); and, Joe Murdoch (U. of New Hampshire). Authors:
Jennifer A. Veitch, Anna-Maria Tosco, and Chantal D. Arsenault
National Research Council of Canada Institute for Research in Construction Building M-24, 1200 Montreal Road Ottawa, ON K1A 0R6 Canada
tel. +1-613-993-9671 / fax +1-613-954-3733 e-mail: jennifer.veitch@nrc-cnrc.gc.ca
© 2004, Her Majesty in Right of Canada. National Research Council of Canada, Ottawa K1A 0R6 Please cite as:
CIE Expert Symposium on Light and Health, Vienna, Austria, Sept. 30 - Oct. 2, 2004
Veitch, J. A., Tosco, A.-M., & Arsenault, C. (2004). Photometric issues in healthy lighting research and application. Proceedings of the CIE Symposium '04 - Light and Health:Non-visual effects (CIE Publication x027:2004, pp. 146-149). Vienna, Austria: CIE.