Anthropomorphic Visualization:
Depicting Participants in Online Spaces Using the Human Form
by Ethan Lewis Perry
B.A. Computer Science Yale University, 1995
Submitted to the Program in Media Arts & Sciences, School of Architecture & Planning
in Partial Fulfillment of the Requirements for the Degree of Master of Science in Media
Arts and Sciences at the Massachusetts Institute of Technology
JUNE 2004
@ 2004 the Massachusetts Institute of Technology
All Rights Reserved
Signature of Author
Department of Media Arts and Sciences May 7, 2004
Certified by
Judith S. Donath Assistant Professor of Media Arts and Sciences
A Thesis Supervisor
Accepted by
Andrew B. Lippman Chairperson, Departmental Committee on Graduate Studies Program in Media Arts and Sciences
MASSACHUSETTS INSTITUTE
OF TECHNOLOGY
JUN 1 7 2004
fROT
C
Anthropomorphic Visualization:
Depicting Participants in Online Spaces Using the Human Form
by Ethan Lewis Perry
Submitted to the Department of Media Arts & Sciences, School of Architecture & Planning
in Partial Fulfillment of the Requirements for the Degree of Master of Science in Media
Arts and Sciences at the Massachusetts Institute of Technology
JUNE 2004
@ 2004 the Massachusetts Institute of Technology
All Rights Reserved
Abstract
Anthropomorphic visualization is a new approach to presenting information about participants in
online spaces using the human form as the basis for the visualization. Various data about an
individual's online behavior are mapped to different parts of a humanoid yet abstract form. I
hypothesized that using a humanoid form to visualize data about people in online social spaces
could serve two purposes simultaneously: communicate statistics about the individuals and
evoke a social response.
Using the human form in this way has both benefits and drawbacks. Users can quickly scan a set
of humanoid representations and get a sense of the character of a group, and may respond
socially to the other participants in the group. However, the information we are able to represent
is somewhat limited, and a humanoid representation style might lead users to make incorrect
assumptions about the people being represented. To investigate these tradeoffs, I created a
test-bed application that visualized data from messages written in Usenet newsgroups. I conducted
user studies to evaluate how users interpreted the data from the visualizations and responded to
messages shown with visualizations. In this thesis, I discuss the challenges of designing effective
anthropomorphic visualizations and offer guidelines to consider when using the human form to
visualize information about participants in online conversations.
Thesis Supervisor: Judith S. Donath
Assistant Professor of Media Arts & Sciences
Director of Sociable Media, Media Laboratory
Anthropomorphic Visualization:
Depicting Participants in Online Spaces Using the Human Form
by Ethan Lewis Perry
The following people served as readers for this thesis:
Thesis Reader
Walter Bender
Executive Director, Senior Research Scientist MIT Media Laboratory
A I
Thesis Reader
John T. Stasko Associate Professor College of Computing/GVU Center
Acknowledgements
Thanks to my amazing wife Judy for her love, support, insight and great sense of fun! Thanks to my parents for their love and support, and for laundry & lunch.
Thanks to my brother Jonathan and the rest of my extended family. Thanks to Alex and Dave for helpful conversations and good times.
And thanks to the rest of Newton South East Coast and West Coast for great friendships.
Thanks to Andrew, Fernanda, Karrie, and Scott for all their help and for a great two years in SMG. Thanks to Walter Bender and John Stasko for their helpful feedback.
Thanks to Keith Hampton, Richard Hackman, Hiroshi Ishii, John Maeda, and Robert Berwick for interesting classes that influenced this work.
Thanks to James Pennebaker and Roger Booth for making a custom version of the LIWC software package available to me.
Thanks to Linda Peterson, Pat Solakoff, and Meg Kelly-Savic. Thanks to Linda Carpenter, Dorota Wojtas, and Veronica Lumpapa. Thanks to my UROPs, Jonathan and Chen.
Of course thanks to my advisor, Judith, for her deep insights, inquisitiveness, and encouragement. And thanks to the Media Lab community, a diverse and interesting bunch of folks.
Contents
ABSTRACT 3 ACKNOWLEDGEMENTS 7 FIGURES 11 TABLES 13 CHAPTER 1: INTRODUCTION 141.1 PRESENTING INFORMATION ABOUT AUTHORS OF ONLINE MESSAGES 14
1.2 USING THE HUMAN FORM TO DEPICT INFORMATION 15
1.3 EXAMPLE VISUALIZATIONS 16
1.4 A NOTE ABOUT THE CONTENTS OF THIS THESIS 17
CHAPTER 2: FOUNDATIONS 18
2.1 CONCEPTS OF IDENTITY AND PERCEPTIONS OF OTHERS 19
2.1.1 SELF-PRESENTATION AND TEXT COMMUNICATION 19
2.1.2 PROTOTYPES AND STEREOTYPES 20
2.1.3 REPUTATION MANAGEMENT ONLINE 20
2.2 SOCIAL DATA MINING 22
2.2.1 ANALYZING OVERALL ATTRIBUTES OF ONLINE COMMUNICATION 22
2.2.2 CONTENT ANALYSIS 23
2.2.3 SOCIAL NETWORK ANALYSIS 24
2.2.4 USING SOCIAL DATA MINING TO SUPPORT USER GOALS 24
2.2.5 PRIVACY ISSUES RAISED BY SOCIAL DATA MINING 25
2.3 A SURVEY OF ONLINE SPACES 26
2.3.1 TEXT-BASED ONLINE SPACES 26
2.3.2 GRAPHICAL REPRESENTATIONAL SPACES 26
2.3.3 GRAPHICAL ABSTRACT SPACES 27
2.4 INFORMATION VISUALIZATION GUIDELINES AND TECHNIQUES 30
2.4.1 INFORMATION GRAPHICS GUIDELINES 30
2.4.2 APPROPRIATENESS OF VISUAL REPRESENTATIONS FOR PARTICULAR DATA TYPES 30
2.4.3 VISUAL PERCEPTION 31
2.4.4 GESTALT THEORY 32
2.4.5 VISUALIZATION TECHNIQUES 32
2.5 USE OF THE FACE IN USER INTERFACES 34
CHAPTER 3: DESIGN OF ANTHROPOMORPHIC VISUALIZATIONS 35
3.1 SELECTION OF SOCIAL DATA
3.1.1 DESIGN APPROACH FOR THE ANTHROPOMORPHS
3.1.3 OTHER POSSIBLE APPROACHES 3.2 VISUAL DESIGN APPROACH
3.2.1 DESIGN APPROACH FOR THE ANTHROPOMORPHS
3.2.2 DISCUSSION
3.2.3 OTHER POSSIBLE APPROACHES
3.3 ANTHROPOMORPHIC VISUALIZATIONS IN USE 3.3.1 SEEKING INFORMATION ABOUT A GROUP
3.3.2 PARTICIPATING IN A GROUP WITH ANTHROPOMORPHS
CHAPTER 4: IMPLEMENTATION OF THE TEST-BED SYSTEM 48
4.1 OVERVIEW 48
4.2 SYSTEM ARCHITECTURE AND DATA MODEL 52
4.3 JAVA CLIENT AND VISUALIZATION ALGORITHMS 55
4.3.1 RENDERING POSTERS 55
4.3.2 RENDERING THREADS 56
4.3.3 RENDERING THE GROUP 57
CHAPTER 5: EVALUATION OF ANTHROPOMORPHIC VISUALIZATION 58
5.1 VISUAL CRITIQUE 59
5.1.1 VISUAL STYLES 59
5.2 COMPREHENSION STUDIES 61
5.2.1 RESULTS OF THE STUDIES 61
5.2.2 DISCUSSION 63
5.3 SOCIAL IMPACT STUDY 64
5.3.1 RESULTS OF THE STUDY 64
5.3.2 DISCUSSION 68
CHAPTER 6: CONCLUSION AND FUTURE WORK 70
6.1 CONTRIBUTIONS 70
6.2 FUTURE WORK 71
6.2.1 DIFFERENT TYPES OF DATA 72
6.2.2 DIFFERENT VISUAL STYLES 72
6.2.3 VISUAL EXTENSIONS TO THE ANTHROPOMORPHS 72
6.2.4 SOCIAL IMPACT OF VISUAL REPRESENTATIONS OF INDIVIDUALS 72
6.2.5 TASK-BASED EVALUATIONS 73
REFERENCES 74
APPENDIX A: USER STUDY
QUESTIONNAIRE
78SOCIAL IMPACT STUDY
EMAIL TO PARTICIPANTS SURVEY
APPENDIX B: APPLICATION OF INFORMATION VISUALIZATION GUIDELINES TO
ANTHROPOMORPHIC VISUALIZATION 98
Figures
Figure 1. Information about two example authors depicted as humanoid visualizations (known as
"A nthropom orphs"). ... 16
Figure 2. Landscape view of a group of authors from a single newsgroup...16
Figure 3. Microsoft's Comic Chat User Interface where users are represented as comic characters...27
Figure 4. PeopleGarden visualization of two different newsgroups with each author represented as a plant. ... 2 8 Figure 5. Loom visualization of newsgroup where each message in the group is connected in the woven "threads" of the conversation. In this view, the messages are categorized into different types of messages. Each type of message is coded with a different color...28
Figure 6. Babble social visualization interface with users represented as circles in the "Commons Area". ... 2 9 Figure 7. Mackinlay's ranking of visual attributes' appropriateness for perceptual tasks...31
Figure 8. Mappings of data to visual elements in the Anthropomorphs...39
Figure 9: Boxes in the body of the Anthropomorph represent messages the author has written. ... 39
Figure 10: Anthropomorphs fade over time if the author does not write a new message...40
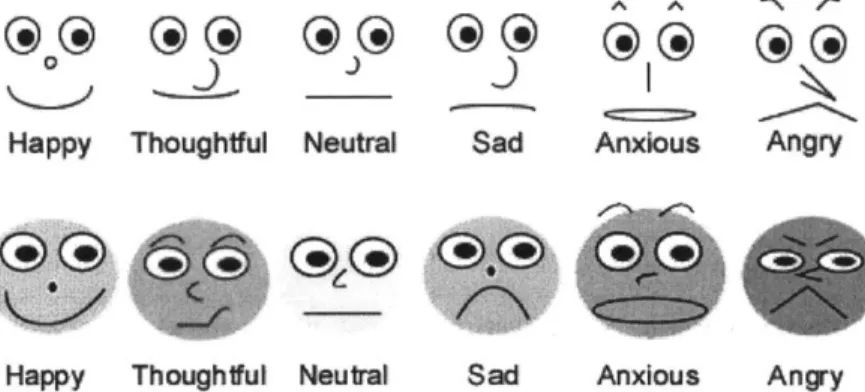
Figure 11: Several different facial expressions were selected...40
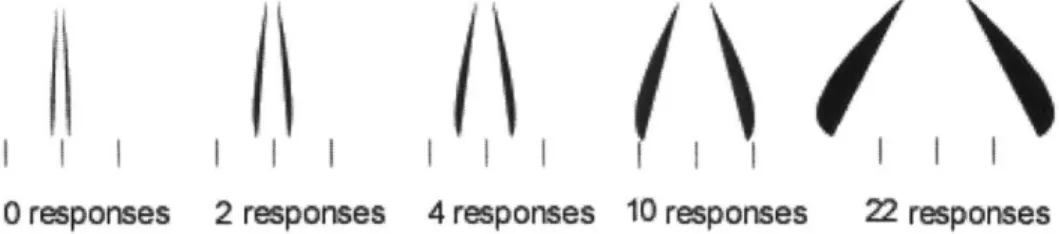
Figure 12: The more central an author is to the group, the more "planted" he or she is in the group, which we represent visually by displaying wider and thicker legs... 41
Figure 13: Silhouetted versions of the Anthropomorph have no facial expression...41
Figure 14. Even relatively abstract depictions of the human form are interpreted as humanoid ... 42
Figure 15. Original faces (top) were too subtle for users to interpret correctly, so I revised the design to have more exaggerated expressions (bottom)... 43
Figure 16. Group view of newsgroup with central group members depicted in the center of the group....44
Figure 17. Overview of the user interface... 48
Figure 18: Close-up of calendar view. Each row is labeled with a date and depicts the threads that were most recently active on that day. Each thread is depicted with the beginning of the subject of the thread and small silhouette representations of the posters who participated. ... 49
Figure 19: When the user clicks on a visualization of thread such as the one outlined by the blue box below, the diagram of the thread appears in the Thread view as shown in Figure 20. ... 50
Figure 20: The thread diagram is loaded into the Thread View panel. ... 50
Figure 21: When the user clicks on an Anthropomorph in the group view such as the one outlined by the blue box below, a larger version appears in the Poster view as shown in Figure 22. ... 51
Figure 22: The Anthropomorph is loaded into the Poster View panel...51
Figure 23. System architecture diagram ... 52
Figure 24. Anthropom orph object m odel... 53
F igure 25. E xam ple posters...55
Figure 27. Chronological Calendar view of the group ... 57
Figure 28: Reasons for Coming to Newsgroup Varied for Three Different Groups...65
Figure 29: H istogram of Ages of Respondents ... 65
Figure 30: Histogram of Time Respondents had been on Internet...66
Figure 31: Histogram of Time Respondents had Participated in Discussion Groups ... 66
Figure 32: Histogram of Time Respondents had Participated in Selected Newsgroup...66
Figure 33: How subjects in the Antique Collectors group viewing different visualization types said they w ould respond to m essages...67
Tables
Table 1: Correlations between visualization type, response to message, familiarity with author, impressions of authors, and likelihood to respond...100 Table 2: Differences between user perceptions of authors they are more familiar with vs. those they are
less fam iliar w ith ... 102 Table 3: Antique Collectors group - Correlations between visualization type, response to message,
familiarity with author, impressions of authors, and likelihood to respond...104 Table 4: How appropriate subjects felt it was to share information about past messages and to estimate
Chapter 1: Introduction
1.1 Presenting information about authors of online messages
When we encounter new people face-to-face, cues about their past are immediately visible. We can gain a sense of a person's age, social status and mood simply by looking at them. Aspects of people's history, reputation, and social roles are expressed in their body and clothing (Goffman, 1967). Although online spaces such as message boards and chat rooms have been in use for several decades now, in these spaces it is difficult for users to glean information about the past behavior of the participants. People are sometimes identified with just a name or a short profile. While "insiders" in online communities may have detailed beliefs about the other participants, someone who is new to the community may have much more difficulty making sense of the roles people play and gaining a sense of the history of past interactions within the space than they do in physical world situations.
Although few current online spaces depict historical data about participants, a source of data is available for this purpose - the archives of messages from these spaces. A variety of data can be mined from these messages. Several scholars have researched which data may be most feasible and useful to analyze and present (Whittaker, et al., 1998)(Smith, 1999)(Fiore, et al., 2002). Past attempts to visualize historical information about users have represented them with abstract graphical forms such as simple shapes (Donath, 2002). These abstract visualizations are intriguing but do not convey the kind of social cues we experience in face-to-face interaction. As human beings, we internalize many social rules that influence our behavior when in the presence of others. But online communication often distorts these reactions by transmitting only a limited set of cues from one person to the other (Walther, 1996).
In order to investigate whether we could enhance online communication by utilizing users' social reactions to other people, I developed a visualization approach that represents information about an individual in a form that looks like a person. Various historical data about an individual are mapped to different parts of a representation of their "body", resulting in an abstract yet humanoid depiction of a person (called an "Anthropomorph") [see fig. 1] (Perry and Donath, 2004). My goal was to incorporate elements of participants' history into an information visualization with the following properties:
* Information about participants' past behavior is legible.
* The overall visual figure generated for participants serves as a memorable depiction of them that becomes associated with their identity in the online space.
Many years of sociological theory and social psychology research have investigated how individuals are influenced by others' appearance and behavior. A number of researchers have discussed how identity and exchange of social cues impact online communication (Turkle, 1995)(Donath, 1998). Yet few researchers have empirically studied how visual representations of users impact the communication that takes place in online spaces. This thesis contributes an initial understanding of the social impact of visual representations of users by evaluating the Anthropomorphic Visualization approach. My studies both tested users' ability to comprehend the information represented in the visualization and examined whether users' responses to messages and impressions of message authors change when accompanied by an Anthropomorph visualization.
Several key questions about the appropriateness of using the human form to represent historical data were present as I developed and tested this visualization approach. One key risk is the tendency of people to form impressions of others based on stereotypes that come from limited information about the other individual. In the following section, I will discuss the rationale for the approach and the potential advantages and disadvantages of the human form.
1.2 Using the human form to depict information
While a number of different visual approaches have been used to visualize historical information about individuals in online spaces, the human form has rarely been used. In my research, I wanted to use a compact format that would obviously refer to a particular person and allow for the easy comparison of information about multiple people. The human form seemed a natural choice for these purposes, despite the potential issues with this approach. The most similar visualization technique is the approach known as "Chernoff faces" (Chernoff, 1973), which will be discussed in the Visualization section of Chapter 2. The human form seems to have several advantages:
* It looks like a person, and thus may be more intuitive to associate with a person than a more abstract representation.
* People easily recognize facial expressions.
* It is flexible as a graphic format - various information values about the person could be mapped to different body parts.
* It evokes social responses. Various research has examined human reactions to representations of faces and images of people on computer screens. This research has shown that people often respond with seemingly innate social responses such as being more polite and making judgments based on appearance as we do in the physical world.
* It lends itself to the comparison of large numbers of people since we are able to quickly scan through multiple depictions of humans.
However, there are also several potential issues with the human form:
* The limited data used to generate the visualization may result in a representation that may not be sufficient to provide useful information and yet it seems to be more realistic since it looks like a person.
* The depiction could be considered a caricature of their true identity, misleading, irrelevant and unacceptable to the person being represented.
* People may find it difficult to interpret more than 3 or 4 values represented simultaneously in the form because of limits to our ability to perceive multiple visual elements.
" The representation may encourage people to make assumptions about people based on the stereotypes that are visually apparent from their appearance with risks of overgeneralization and bias. In Chapter 2, Foundations, of this thesis I will discuss prior work that includes the findings that informed this list of advantages and disadvantages. In Chapter 3, Design of the Visualization, I will explain how my
own design decisions emerged from this prior work as well as guidelines from the information visualization tradition. In Chapter 5, Evaluation, I will report my own findings based on people's use of and reactions to the visualization. Clarifying the tradeoffs between these benefits and potential issues is the core of the evaluation of this visualization.
1.3 Example visualizations
To illustrate the Anthropomorphic Visualization approach, here are two example visualizations. They were generated from actual messages written by authors in Usenet newsgroups.
Figure 1. Information about two example authors depicted as humanoid visualizations (known as "Anthropomorphs").
6 Number of initial posts -Indeated by number f thick boxes
s - Number of replies -58 Indcated by number d thin bares
1-1 Number of responses received-11 Indcated by widh of legs
IL
j
17 - Days since wrote last message-0 Indcated by darkness of figureHere is a "landscape" view of the participants in a particular newsgroup with more "central" members of the group appearing in the center of the image.
Figure 2. Landscape view of a group of authors from a single newsgroup.
Gunther Kevi N Tom LalB Magic menagerie dan-tu 4 Pn B C rt
A
eA Richard Jones RodneyGary man Herelll
AGreen1209
LoaderLady
Donald Kerns
Dark Phoenix
Mel
0Wr-soowLrrjiCOftr From The Freezer ota12
George I npson
Carlos
T a
A~uI travrs M a.in BagshaiE
BErn 14 DAN. MartinOsirus Franl kay-ove FrnIaX4f4
For details about the the Visualization.
1.4 A note about the contents of this thesis
In order to provide the foundation for this research, I became familiar with the literature for a number of relevant areas. The Foundations chapter highlights relevant research from the following topic areas:
* Social perception of others * Social data mining
* Design of online spaces * Information visualization
0 The use of the face in user interfaces
The remaining chapters in turn cover: * the design of the visualization,
e the implementation of the test bed system, * the various evaluations of the research, e conclusions and potential future work.
Chapter 2: Foundations
At the core of this thesis work are several key questions about presenting information about authors of online messages:
e What information about authors can and should we visualize? e How should we depict the information?
e How will users interpret and perceive the anthropomorphic representations of participants in online spaces?
In order to place these questions about my own work in Anthropomorphic Visualization in a broader context, this chapter will be devoted to reviewing the literature from a number of fields. Research about which information about individuals from message archives is most useful is discussed in the Social Data Mining section. Lessons from the information visualization literature are discussed to shed light on how we should depict information. A survey of online spaces is also important for identifying the state of the art in how individuals are depicted in other systems.
Research regarding the way individuals perceive and present themselves to each other offline can be helpful in understanding how similar interactions occur online. In the Concepts of Identity and Perception of Others section, I discuss a number of relevant theories and studies that highlight how individuals communicate with each other both online and offline. I also cover past research on the use of faces in user interfaces. All of these topics are relevant to understanding how users will interpret and perceive the Anthropomorphs.
2.1 Concepts of Identity and Perceptions of Others
2.1.1 Self-presentation and Text CommunicationIn order to move towards the goal of enhancing users' perceptions of each other in online spaces, it is important to review the research about individuals' perception of each other offline and the way relevant theories have been applied to online spaces. While the experience of interacting with others in online spaces differs from our interactions in the physical world, many studies of interpersonal and group communication from the physical world can shed light on the way in which we interact online.
Goffman's theory of self-presentation is a primary example of a theory that is relevant to apply to online interaction. The theory introduces the idea that people shape their behavior towards an individual in response to the information they gather about that person. Depending on the situation, the individual may make more or less of an effort to influence others' perceptions through physical appearance and comments. The degree to which an individual is strategic about self-presentation is determined by the social conventions for the situation at hand, as well as the individual's personality. Regardless of how actively an individual presents himself, others still receive information based on his behavior and appearance (Goffman, 1967). Similarly, visual representations of users online may send signals to other users who view them regardless of how much users have been proactive about their online appearance. Online the tendency to make judgments about others based on the information at hand also occurs, but the information we receive may be more limited. Using text communication has been shown to have a number of strengths and limitations. In "Computer-Mediated Communication: Impersonal, Interpersonal, and Hyperpersonal Interaction", Joseph Walther examined how text communication online differs from communication in the physical world. He points out the following qualities of computer-mediated text communication:
e Groups with no prior history of communication have been shown to be "significantly lower than FtF [face-to-face communication] on certain social categories of conversation" and "significantly higher than FtF on certain types of hostile or profane speech acts, leading to characterizations of CMC as uninhibited and depersonalized." This may be because CMC provides less "social information per message" than FtF because of the absence of nonverbal cues so that relationships in online environments may take longer to develop than in FtF environments.
* In field research "where interaction time was not constrained", CMC has been shown to produce "emotionally rewarding exchanges", e.g. friendships, romances and other emotional support developing in online communities.
* In "certain common circumstances, CMC message receivers inflate the perceptions they form about their partners.. .they build stereotypical impressions of their partners without qualifying the strength of such impressions in light of the meager information - misspellings, typographical errors, or excessive punctuation on which they are built." (Walther, 1996).
One way to explain the sometimes more impersonal nature of online text communication and the incorrect impressions people form online is the reduced opportunity for self-presentation and exchange of information about others. Adding visual representations of participants in online communication may change users' perceptions of each other, however. It may be the case that the lack of a visual reminder of the other people's presence leads to a lack of social interaction. Presenting images of users may encourage more socializing. By adding additional information about others, users may also be less likely to build stereotypes based on a lack of information, and instead may be influenced by the visual appearance of the others they interact with. But if these appearances are not accurate or are based on superficial information, they may mislead users.
2.1.2 Prototypes and Stereotypes
In his study of impression formation in text-based virtual communities, David Jacobson also found that inaccurate impressions of other individuals encountered online could be partially explained through the stereotypes people employ to fill in the details of the images they have of each other when presented with incomplete information (Jacobson, 1999). Jacobson draws upon theories of categorization and Rosch's notion of "prototypes" to account for people's incorrect assumptions about others met only online.
When individuals perceive the world, they tend to group the objects and people they encounter into categories. One theory of how we form these categories is through prototypes - notable examples that possess the distinctive characteristics that define the category. For example, a robin might be a prototypical example for the category "bird" (Rosch, 1978). While we might assume that grouping people into categories in this way might minimize our ability to accurately understand the social atmosphere around us, in fact the reverse seems to be true. Without an ability to summarize the characteristics of individuals into preconceived packages of personalities, we are left with a flood of ambiguous characteristics that are difficult to make sense of. Our understanding of the social norms that are acceptable in particular social contexts is limited if we can't discern the type of social actors around us. So while there are negative costs to the human tendency to form prototypes such as overgeneralization and stereotyping, the human tendency is to form these generalizations in able to assist our ability to make sense of our social worlds.
Online, however, individuals participating in online spaces have had a difficult time forming impressions successfully. Their impressions of others have come from perceptions of textual writing styles, the names used by the other participants, and contextual cues such as geographic places mentioned. Not surprisingly, while some of these impressions may be accurate, many are not. If we add visual representations of users, these may lead to other types of stereotypes. If users with a particular type of appearance consistently behave in similar ways, these may lead to a different set of stereotypes than those based on lack of information, but they still may results in misperceptions, especially if the appearance is generated from irrelevant or superficial information. If the visual appearance is based on information that is useful for generalizing about individuals' behavior, it may be more likely to be a "useful" stereotype. So if, for instance, more active participants tend to be more helpful, a visualization that shows active users as larger will in general enable users to find the more helpful participants by looking for the larger ones.
2.1.3 Reputation Management Online
Within groups, members occupy particular roles partly because of their status level within the group. Contributions that members make to the group may help to elevate their reputation so that they are more trusted and respected than newcomers. Kollock explains how individuals manage the risk of interacting with an unknown party by getting a sense of the other's reputation. Websites like Slashdot.org and Ebay.com enable users to rank each others' performance. In the case of Slashdot, users can rate the quality of a message an individual posts to the site. On E-bay, users rate a seller or buyer's effectiveness, with users exchanging very positive ratings for the most part, since a small negative rating can have a large adverse impact on others' willingness to do business with the individual.
Kollock discusses explicit mechanisms for rating individuals, providing a reputation with an active evaluation by other users. He also mentions how aspects of a user's identity such as an AOL email address contribute to others' perceptions (Kollock, 1999). When providing historical information about participants, as this thesis proposes, users may also infer reputation based on the information provided by the individual. If particular historical information is unduly highlighted that may be perceived as negative, this may have an adverse impact on the interactions that take place within the group.
It is also possible that an individual's online ranking could be used as a piece of data to be shown in his or her visual representation. Although out of the scope of the research in this thesis, a natural next step for
Anthropomorphic Visualization would be to incorporate user opinions of each other's contributions as a visual element so that users can quickly discern the most valued members of the group. There is a risk, however that users will attempt to manipulate a system that attempts to show the most valuable members. As documented in (Donath, 1998) and (Turkle, 1995), users of online systems have often deceived others by posing as someone they are not and have even gone so far as to impersonate particular individuals to defame their image.
Users might also exploit a reputation system to gain additional "reputation points" by creating multiple personas and providing very positive opinions of the contributions by their other personas, resulting in a distorted picture of their true contributions. While some safeguards and moderators can prevent these types of deception, administrators of such a system will need to be aware of these issues. Users will likely need to learn about the risks of relying on potentially distorted information when viewing representations of individuals in a humanoid format.
2.2
Social Data Mining
The source for anthropomorphic visualizations of individuals is data gathered about the individuals' behavior. The messages that people write are a record of their past. As more and more information is exchanged online, it is feasible to analyze many aspects of the data that are generated from this communication. By looking for patterns in this data, it is often possible to uncover "implicit, previously unknown, and potentially useful information" in a "data mining" process (Frawley et al., 1992). In the last several years, scholars have applied data mining techniques to large online social spaces, analyzing messages in Usenet newsgroups, for instance. "Social data mining" is used to make generalizations and identify trends about patterns of communication (Terveen and Hill, 2001) and is a source of data for visualizations of social behavior.
Social data mining can also be used to recommend or filter messages or documents to users by presenting information that has been used or created by similar users. Incorporating historical data about individuals' behavior in a group into a visual representation of those individuals may help users identify participants who they find interesting. If an individual is especially activity in a set of conversations that a user finds relevant, she might be interested in other conversations that individual has participated in.
2.2.1 Analyzing Overall Attributes of Online Communication
In order to determine which data to include in visualizations of online individuals, we can draw upon past research about mining data from online archives. Marc Smith has conducted an ongoing social data mining project where he tracks the statistics of contributors to almost all Usenet newsgroups. Usenet newsgroups are message-board like forums in which various participants post information, comments, disagreements and the like around numerous topics. Newsgroups exist to discuss everything from sports teams to politics to hobbies of various types.
Smith's Netscan system catalogs the messages that people post per group and calculates how many messages are replies, how many are cross-posts, how many messages are written on average per contributor, etc. Smith's paper "Invisible Crowds in Cyberspace: Mapping the Social Structure of the Usenet" described how he attempted to characterize "successful" newsgroup social environments. Many Usenet groups seem to be unlikely candidates for high levels of social interaction. To begin to understand the range of social behaviors present, Smith analyzed quantitative measures of the groups such as messages posted and numbers of participants
Most Usenet posters contributed only a single message over a ten-week period, with only 4% of posters contributing more than 30 messages during this time. A tiny number of posters contributed a huge quantity of messages, possibly automatically generated spam, not written by individual people. Smith suggests that the measure of poster-to-post ratio is a useful way to assess the level of interactivity or social turn-taking within groups. 40% of groups have poster-to-post ratios that are either too high or too low to indicate much social interaction (Smith, 1999). We can imagine a "healthy" newsgroup from a social perspective being one that has participants who respond to each other's messages and have some awareness of each other. So both activity level and responsiveness are elements to measure that provide useful information about a user's past.
Steve Whittaker and his colleagues also used quantitative measures to study social interaction in Usenet, testing hypotheses from the "common ground model of communication" to examine what newsgroup conditions were conducive to establishing common ground for sustaining conversation. They found that 40% of messages were failed attempts to initiate conversation, yet 33% of messages had "2 or more threads, indicating frequent extended conversations." Groups that were larger in size with fewer posters contributing more than one message were somewhat less likely to have extended conversations (Whittaker, et al., 1998). There is a disparity between the posts that do not receive responses (perhaps indicating a lack of social capital on the part of the poster) and the messages that spawn more extended
discussion. More research is needed to understand why certain messages fail and others lead to additional conversation.
Initial studies by Smith and Andrew Fiore show that users' opinions about other newsgroup participants correlate to some extent with aspects of the participants' behavior (Fiore, et al., 2002). For instance, the more groups an author posts to, the less likely other individuals are to be interested in the author's messages. This is likely because authors who post to many groups may be posting advertisements, spam, or other disruptive messages. The more replies and the more frequently an author posts, the more likely they are to be trusted and respected by other group members. They also found that the more messages an author writes, the more likely the messages are to be replies to other authors, indicating that more active posters take a greater role in maintaining the discussion in a particular group, again validating that activity level is a worthwhile data element to measure and visualize.
2.2.2 Content analysis
One potentially revealing type of analysis for examining online messages is the use of natural language processing (NLP). By analyzing the words and phrases used in text, computer scientists have attempted to automatically infer some things about the tone and subject matter. While an entire set of journals and conferences are devoted to making progress in this field of information retrieval and natural language processing, some specific research is relevant to the question of analyzing the messages in online spaces:
* The BOW project at Carnegie Mellon University was used to categorize messages according to subject matter, by looking at the similarity of the most frequent words used in each message (McCallum, 1996).
. Ellen Spertus's SMOKEY project looked for common words and phrases used in "flames" or abusive messages, and was able to correctly categorize 64% of the flames and 98% of the non-flames (Spertus, 1997).
* Janyce Wiebe's group studies how to use to natural language processing to identify patterns that indicate how subjective a text is, that is whether it includes statements of opinion. (Riloff and Wiebe, 2003).
* Hugo Liu and his colleagues have utilized a "real-world" knowledge approach, leveraging the Open Mind database of information about the world to infer when the content of a particular text emplies a specific emotional state. (Liu et al., 2003).
* Pennebaker and Francis have created a dictionary of words that indicate a variety of emotional, cognitive and other psychological qualities. Their system counts the occurrence of words in a text and indicates the presence of each category. (Pennebaker, et al., 1999).
* Warren Sack's Conversation Map analyzes the semantic content of Usenet messages and retrieves keywords and then highlights messages based on their relevance to a particular keyword. (Sack, 2000b).
While not always precisely accurate in this subjective type of assessment, natural language analysis nonetheless provides useful cues about a person's writing. Because of these systems are able to categorize text automatically, they are worth considering as data sources for automatically-generated profiles of participants in online spaces. However, a number of issues are worth considering depending on the accuracy and subjectivity of the inference being made about the text. In the Discussion section of the Evaluation chapter, I will consider some guidelines for when it is appropriate to include data generated from automatic content analysis in a visualization. It is also necessary to be able to efficiently use the NLP technique to analyze the data. This requires integrating the NLP system with the system that is used to gather and display the messages.
2.2.3 Social network analysis
Another relevant source of techniques for analyzing data from messages is the field of social network analysis. By analyzing the relationships among individuals, we can reach some conclusions about some aspects of the structure of the discussion group. For instance, if a particular member of a group has more connections to other members of the group than anyone else in the group, that person is likely a central figure in the group. By identifying each response to another person's message as a connection or "tie" between two individuals, we can construct a network graph of the relationships that exist among all members of the group. We can use the data from this graph to show who the most central group members are. Social network analysts have a variety of techniques for analyzing these graphs from a sociological perspective. Techniques can be used to analyze the group as a whole as well as individuals within the group. The following techniques have some relevance for gathering social data that could be used to provide information about participants in online spaces (Wasserman and Faust, 1994):
e Centrality measures: A number of calculations are possible to determine how much particular individuals or "actors" have a central place in the social network. "Degree centrality" is the measure of how many connections or ties an actor has. "Closeness centrality" is the measure of how close an actor is to the other individuals in the network. "Betweenness centrality" is the measure of how many other individuals an actor is between, where being between two people may indicate certain capabilities or power. Centrality is often associated with prestige or status in a group. Higher status individuals are more likely to have ties to a larger or more significant group of members in the group.
* Cohesive subgroups: By looking at which sets of individuals in a group are most closely tied to each other, we can identify significant subgroups. Sets of particular individuals who are closely connected to each other may indicate subdivisions in the group in terms of common interests, comfort or access to each other. A variety of calculations can be used to determine which individuals constitute a subgroup including identifying sets of individuals who are all connected to each other, or who are all reachable within a certain number of steps from each other.
* Structural equivalence: By examining the connections different individuals have to the entire group, we can identify when two or more individuals are "structurally equivalent" or connected to the same set of individuals. Various approximations have been defined for calculating the degree to which two actors have equivalent placement in the network structure.
2.2.4 Using Social Data Mining to Support User Goals
In Terveen and Hill's discussion of recommender systems, they consider how social data mining can be used to suggest content that will be of interest to someone. This can be done by identifying documents that have been read by people with similar interests or by identifying individuals who are interesting to a user and then displaying documents or messages from that individual's history. Terveen and Hill contrast this type of system with other types of recommender systems:
e Content-based systems that provide suggestions by using the user's preferences to analyze the content in the system and find similar content
* Recommendation support systems that facilitates human recommendations
e Collaborative filtering systems that anonymously track all users' preferences and recommend content preferred by similar users without revealing who they are. (Terveen and Hill, 2001). We could potentially incorporate data that relates a user's content preferences to the past messages
could color code individuals' bodies according to their relevance to the user's content preferences. This might allow users to more efficiently identify participants whose interests match theirs.
2.2.5 Privacy Issues Raised By Social Data Mining
This process of analyzing data generated by individuals raises questions about privacy - should all the data generated by this kind of communication should be publicly available or should participants have some control over who views the information that has been recorded about them? Currently, it is much easier to mine the data about individuals than it is to prevent access to this data since so many online spaces are in the public forum. In addition, archives of the messages accrue over time, so that participants who wrote messages in Usenet newsgroups many years ago may not even be aware that their messages are still available online.
Designers of systems that mine data from messages have a responsibility to consider the ethicality of using this data when it reveals information about users that they did not intend to reveal. This complex issue will be discussed further in the Evaluation chapter.
2.3 A Survey of Online Spaces
Since the anthropomorphic visualization technique is meant to enhance the communication in online spaces, it is important to review the relevant online spaces that have been developed to date. There are a variety of ways in which these spaces depict individuals and structure conversation. It is useful to discuss the user interfaces of the different types of online environments in terms of several criteria so that we can better understand how these environments influence the communication that takes place within them. The following criteria are relevant for examining the way individuals interact with each other:
e How participants are depicted - via name, profile, avatar, or visualization
e What information about participants is included - via user selected representation, user-written
profile, historical information, or nonverbal cues
e How conversations are depicted - via list of messages or threads, or some type of visual
representation
e How users can select or enter conversations - via chronological list, search criteria, or some kind
of spatial representation of the environment
At a larger scale, the following distinctions are useful for characterizing online environments: * Text-based vs. Graphical
e Abstract vs. Literal/Representational e Type of spatial configuration: 2D/3D
Of interest to this thesis are the spaces that are good sources for visualization data and the spaces that extend online communication in some interesting way. The following sections provide a summary of text-based online spaces, graphical representational spaces, and graphical abstract spaces.
2.3.1 Text-based Online Spaces
Many environments rely purely on the exchange of text messages with the author's name attached. Notable text-based online environments include Usenet newsgroups, chat rooms, and instant messaging services such as AOL Instant Messenger. Usenet newsgroups are message-board like forums in which various participants post information, comments, disagreements and the like around numerous subjects. Newsgroups exist to discuss everything from sports teams to politics to hobbies of various types. Because newsgroup messages are publicly available and cover a wide variety of topics, they make a good source for visualizing many different types of group messages.
2.3.2 Graphical Representational Spaces
Visual spaces enable and influence communication in a more complex fashion. In addition to the text of the communication, users automatically make assumptions about others that they encounter based on the visual information they receive. Beginning with services such as Habitat, the Palace and AlphaWorld, users were able to interact with each other in a visual environment (Morningstar, et al., 1990)(Rossney, 1996). Each user was depicted as a visual representation of a person, animal or other object that could move around a 2- or 3-dimensional environment. Users selected avatars from a menu of choices, or uploaded an image. When an online space depicts a user with a visual representation, other users viewing this person form some kind of impression based on what the user looks like.
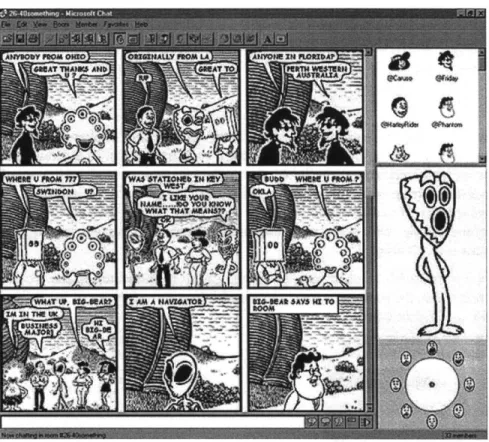
Another approach to representing users in a graphical fashion drew from the tradition of comic books. Kurlander, Skelly and Salesin's Comic Chat allows users to select a comic character and places the text they type in text "balloons" arranged in panels that resemble a traditional comic strip. The program automatically positions the characters and generates suggested emotional expressions and gestures and places the characters in a comic book scene. Users can also override the expressions and gestures with
their own selection (Kurlander, et al., 1996). While an entertaining way to view messages, the stylized nature of the representations of the users and unlikely environments they inhabit seem to make it less likely that they refer to the actual individuals typing the messages. Instead, the pictures take on the feel of a fantasy that adds a layer of visual interest and novelty but may not reflect much actual information about the people participating. A key question for anthropomorphic visualizations are the degree to which they appear to actually represent the users being depicted as opposed to taking on more of fantastical feel as Comic Chat does.
Figure 3. Microsoft's Comic Chat User Interface where users are represented as comic characters.
Cassell and Vilhjalmsson's BodyChat and Spark systems automatically generates detailed gestures and facial expressions for avatars in conversation, timed to occur at a particular point in an utterance when they are semantically appropriate. This project is interesting in that the online participants begin to present themselves with a greater amount of non-verbal cues. Vilhjalmsson found some evidence to support the idea that conversations that incorporated avatars with these cues led to better conversational quality than equivalent conversations using text chat. Users reported that the interaction felt more like a face-to-face conversation (Vilhjalmsson, 2003). This thesis also investigates whether users also have a different experience in a conversation with anthropomorphic figures compared to a text-based discussion.
2.3.3 Graphical Abstract Spaces
Abstract visualizations represent individuals in a format that is not humanoid but instead use shapes and colors to represent data about users. In order to provide information about participants in Usenet newsgroups, Xiong and Donath developed "data portraits" which visualized information about individuals. The PeopleGarden application displayed a set of users from a particular group as plants in a garden, with various pieces of information about each participant represented as a different element of the plant (Xiong and Donath, 1999).
Figure 4. PeopleGarden plant.
visualization of two different newsgroups with each author represented as a
t
Loom is a series of visualizations of Usenet newsgroups in which entire groups and conversations are depicted using a variety of abstract visuals. In the first version of Loom, each participant in a group was represented with a horizontal row in which each message he or she wrote was represented with a small square. Lines connected the messages in a particular conversation, creating a woven tapestry of intersecting conversations in active groups. By color-coding whether a message is an initial message or a reply, different types of users become visible, with some users responding to many messages, and others just posting a few questions (Donath et al., 2001a).
Figure 5. Loom visualization of newsgroup where each message in the group is connected in the woven "threads" of the conversation. In this view, the messages are categorized into different types of messages. Each type of message is coded with a different color.
A later version of Loom depicted conversations as circles, making groups with lengthy conversations appear with a collage of intersecting circles, while groups with spam and little social interaction having just a spotted landscape of initial posts.
In a similar vein, Warren Sack's Conversation Map system visualizes conversations in Usenet newsgroups with several complementary views. A social network view shows the connections among the different participants in the group. A semantic network view shows the connections among the subject matter of the messages written by the different participants. Next to this is a listing of the "themes" prevalent in the messages. At the bottom is a view of the message threads, in which a grid of messages is laid out with linkages to messages written in the same discussion thread (Sack, 2000b).
Anthropomorphic visualization draws upon these past Usenet visualizations in some of the choices of data to depict and some of the visual techniques used to display information. Minimal evaluation has been done on those systems, so it is unknown to what degree users benefit from them. While all of these views depict more detailed information about users and groups than are usually present in Usenet displays, they do not provide much sense of human presence. Anthropomorphic visualization attempts to combine this more abstract approach to representing information about people with the lessons from systems that depict individuals in a humanoid form.
Other systems use abstract representations of people to provide an overview of individuals taking part in an online conversation. Chat Circles is a chat environment in which individuals are represented as abstract colored circles. Users can control their own circle with the mouse, and can move closer or farther away from other circles in the space. Only when a circle moves close enough to be within "hearing range" of another circle is the user able to see the text typed by that owner of that circle (Vi6gas, 1999).
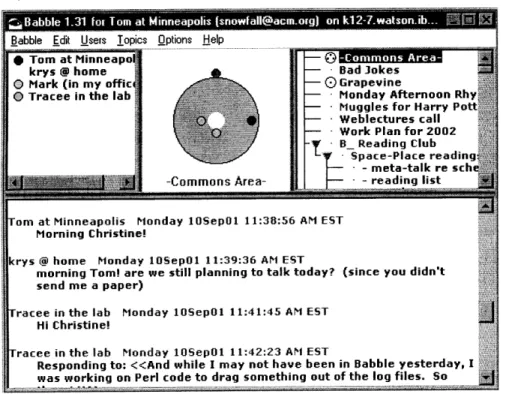
Babble is a system with synchronous chat and asynchronous message board functionality. All conversations persist and can be viewed by anyone in the group at a later time. Users who are currently connected are represented as a small colored circle and when they type a message or otherwise interact with the system, they move to the center of a two-dimensional "Commons Area" panel in the interface. As time goes on, they drift away from the center (Erickson, 1999).
Figure 6. Babble social visualization interface with users represented as circles in the "Commons Area".
~~~.33~~~
. 3 3 0 NBabble Edit Users Topics Options Help
* Tom at Minneapol ' ' -
1
krys @ home BadJokes
O Mark (in my offic( 0 Grapevine
o Tracee in the lab Monday Afternoon Rhy
Muggles for Harry Pott
0-- Weblectures call
O- Work Plan for 2002
SB_ Reading Club Space-Place reading.
--meta-talk re sche
S -Coinmmo-s Area- reading list
Tom at Minneapolis Monday 10Sep01 11:38:56 AM EST
Morning Christine!
krys @ home Monday 10Sep01 11:39:36 AM EST
morning Tom! are we still planning to talk today? (since you didn't send me a paper)
racee in the lab Monday 10Sep01 11:41:45 AM EST
Hi Christine!
Tracee in the lab Monday 10Sep01 11:42:23 AM EST
Responding to: <<And while I may not have been in Babble yesterday, I was working on Perl code to drag something out of the log files. So
Just as these systems use a two-dimensional layout to show the relationships among users, the Anthropomorph test-bed system has been developed to represent users so that their position on screen provides some useful information about them. Like Babble, the system determines position based on their activity, rather than allowing users to move themselves in the application as Chat Circles does.
2.4 Information Visualization Guidelines and Techniques
As discussed in the survey of online spaces, a number of ways to depict individuals are feasible. In order to decide the best way to design these depictions, it is useful to consider a number of guidelines and findings from the information visualization research. Ideally the design of the anthropomorphic visualization should be both legible and communicate some sense of social presence. In order to communicate multiple pieces of data in a compact format, it is necessary to take into account lessons from information design as well as visual perception. The following sections highlight research and recommendations relating to these areas.
2.4.1 Information Graphics Guidelines
Edward Tufte has suggested many guidelines for the clear and informative presentation of information graphics. At the beginning of his book, The Visual Display of Quantitative Information, Tufte proposes that "Excellence in statistical graphics consists of complex ideas communicated with clarity, precision, and efficiency." He goes on to state that graphical displays should:
* "Induce the viewer to think about the substance rather than about methodology, graphic design, the technology of graphic production, or something else
* Avoid distorting what the data have to say e Present many numbers in a small space e Make large data sets coherent
e Encourage the eye to compare different pieces of data
e Reveal the data at several levels of detail, from a broad overview to the fine structure e Serve a reasonably clear purpose: description, exploration, tabulation or decoration * Be closely integrated with the statistical and verbal descriptions of a data set"
He also suggests that "a large share of ink on a graphic should present data-information" so that "nothing can be erased without losing information." In other words, he advocates a minimalist approach in which every visual element has meaning. So for instance, he states that "Half-faces carry the same information as full faces".
Consistent with his desire for high information density, Tufte proposes the concept of "small multiples" in which each information element has several pieces of data that are visually presented together as a compact unit. The "same design structure [is] repeated for all the images. An economy of perception results; once viewers decode and comprehend the design for one slice of data, they have familiar access to data in all the other slices. As our eye moves from one image to the next, this constancy of design allows viewers to focus on changes in information rather than changes in graphical composition." (Tufte, 1983). While a number of these guidelines are relevant and have been observed in the design of the anthropomorphic visualizations discussed in this thesis, our purpose is not only to communicate statistics clearly, but also to play a role in conversation with the display of social non-verbal cues. So for instance, half faces would have a very different effect socially than a full face. In the Design chapter we further describe our response to these guidelines.
2.4.2 Appropriateness of visual representations for particular data types
In his attempt to automate the design of information graphics, Mackinlay discussed the appropriateness of different types of graphical variables. Modifying a prior framework suggested by Cleveland and McGill, Mackinlay suggests that the appropriateness of particular graphic elements depends on the type of data.
He proposes that nominal, ordinal, and quantitative data have different rankings of appropriateness for the graphic elements. He also suggests that the most important attribute should be represented with the most effective technique for representing the data (Mackinlay, 1986). See Figure 7 for his ranking of the appropriateness of "perceptual tasks" with certain visual elements for particular types of data.
Figure 7. Mackinlay's ranking of visual attributes' appropriateness for perceptual tasks.
More accurate Less accurate Quantitative Position Length Angle Slope Area Volume Density Color Saturation Color Hue Texture, Connectim, Contaimnenti Shape F*** c lo enit .( ot p1
NEaiJ
Ordinalig. 14, Accuracy ranking of quantitative erceptual tasks. Higher tasks are accom-ished more accurately than lower tasks.
leveland and McGill empirically varified the asic properties of this ranking.
Nominal Position Color Hue Texture Connection Containment Density Color Saturation Shape Length Angle Slope Area Volume
Fig.15. Ranking of perceptual tasks. The tasks shown in the gray boxes are not relevant to these typeenofrIdtft.
These guidelines are useful in the design of anthropomorphic visualization forms. For instance, while color hue is useful for displaying items falling into different categories such as different emotions, it is not appropriate for displaying quantitative values.
2.4.3 Visual Perception
Certain target visual elements can be recognized preattentively, that is within 250 milliseconds of viewing, regardless of how many "distractors" (visual elements that are not targets) are present. It is