Publisher’s version / Version de l'éditeur:
Canadian Acoustics, 26, September 3, pp. 21-22, 1998-09-01
READ THESE TERMS AND CONDITIONS CAREFULLY BEFORE USING THIS WEBSITE.
https://nrc-publications.canada.ca/eng/copyright
Vous avez des questions? Nous pouvons vous aider. Pour communiquer directement avec un auteur, consultez la première page de la revue dans laquelle son article a été publié afin de trouver ses coordonnées. Si vous n’arrivez pas à les repérer, communiquez avec nous à PublicationsArchive-ArchivesPublications@nrc-cnrc.gc.ca.
Questions? Contact the NRC Publications Archive team at
PublicationsArchive-ArchivesPublications@nrc-cnrc.gc.ca. If you wish to email the authors directly, please see the first page of the publication for their contact information.
NRC Publications Archive
Archives des publications du CNRC
This publication could be one of several versions: author’s original, accepted manuscript or the publisher’s version. / La version de cette publication peut être l’une des suivantes : la version prépublication de l’auteur, la version acceptée du manuscrit ou la version de l’éditeur.
Access and use of this website and the material on it are subject to the Terms and Conditions set forth at
Comparisons of computer simulations of acoustical conditions in
classrooms
Bistafa, S. R.; Bradley, J. S.
https://publications-cnrc.canada.ca/fra/droits
L’accès à ce site Web et l’utilisation de son contenu sont assujettis aux conditions présentées dans le site LISEZ CES CONDITIONS ATTENTIVEMENT AVANT D’UTILISER CE SITE WEB.
NRC Publications Record / Notice d'Archives des publications de CNRC:
https://nrc-publications.canada.ca/eng/view/object/?id=ee364134-8f75-49e3-8fd8-3c2413adecbf
https://publications-cnrc.canada.ca/fra/voir/objet/?id=ee364134-8f75-49e3-8fd8-3c2413adecbf
http://www.nrc-cnrc.gc.ca/irc
Com pa risons of c om put e r sim ula t ions of a c oust ic a l c ondit ions in
c la ssroom s
N R C C - 4 5 6 8 5
B i s t a f a , S . R . ; B r a d l e y , J . S .
S e p t e m b e r 1 9 9 8
A version of this document is published in / Une version de ce document se trouve dans:
Canadian Acoustics, 26, (3), September, pp. 21-22, September 01, 1998
The material in this document is covered by the provisions of the Copyright Act, by Canadian laws, policies, regulations and international agreements. Such provisions serve to identify the information source and, in specific instances, to prohibit reproduction of materials without
written permission. For more information visit http://laws.justice.gc.ca/en/showtdm/cs/C-42
Les renseignements dans ce document sont protégés par la Loi sur le droit d'auteur, par les lois, les politiques et les règlements du Canada et des accords internationaux. Ces dispositions permettent d'identifier la source de l'information et, dans certains cas, d'interdire la copie de
Comparisons of Computer Simulations of Acoustical Conditions in Classrooms
Sylvio R. Bistafa'& Jobn S. Bradley
Institute for Research in Construction, National Research Council, Montreal Road. Ottawa, KIA OR6
where Noiseisthe overall background noise level in dBA and SPL
isthe octave band speech sound level. Speech Intelligibility Metrics
Both Odeon and Raynoise give values for Reverberation Time and Definition, and Raynoise also gives the Sound Transmission Index. With Definition defined as:
50ms
f
p2(1)dtD= 0 (I)
f
p2(t)dto
where p(t) is the room impulse response; CSO and USO were calculated using the fonnulas:
C50=IOIg[%_D)}
(2)Introduction
Acoustical specifications for classrooms are usually established solely on the basis of reverberation time. Although in general the conditions for speech communication improve as an optimum reverberation time is approached. reverberation time by itself does not provide the best direct measurement of speech intelligibility. Many metrics have been developed and used to measure speech intelligibility such as the Speech Transmission Index (STI), Definition (D), EarlylLate Ratios (CSO), and Useful/Dp.trimp.ntal Ratios(USO). All of them can be measured in real rooms, but predictions of these parameters can best be obtained by computer simulations. This work consists of comparisons of computer simulations of acoustical conditions in classrooms for a number of newer parameters and using two different computer models.
Computer Programs and Simulated Classroom
Many room acoustical computer simulation programs are available today that can be used for this purpose. To study the relation among the newer speech intelligibility metrics, as well as to obtain some indications about the reliability of this type of room acoustic simulation tool, we use two computer programs available to us namely; Odeon 2.6 and Raynoise 2.1A. Both programs use so-called hybrid models in that they combine different procedures for calculating the earlier and later parts of the impulse response. The modeled classroom had dimensions of7.6m x lO.Om and 3.3m height. Four different sound absorption material configurations, using mineral wool, were simulated to investigate the relation between reverberation and speech intelligibility. The ceiling and the back wall surfaces were respectively covered: I: 100%, 100%; 2: 3S% (outer ring), 100%; 3: 0%, 100%; 4: 0%, 0%, in each configuration.
Conclusions
The simulations showed that the speech intelligibility metrics have been consistently estimated using two different room acoustic computer programs. The prediction of reverberation time seems to deviate from expected values at high frequencies. with both programs, for a very reverberant room. The position. averaged results were in quite good agreement, and the general trend seems to have been correctly predicted; that is, an increase of speech intelligibility occurs with added sound absorption, with
an
upper limit at high frequencies for the most absorbing sound configuration.
Results and Discussion
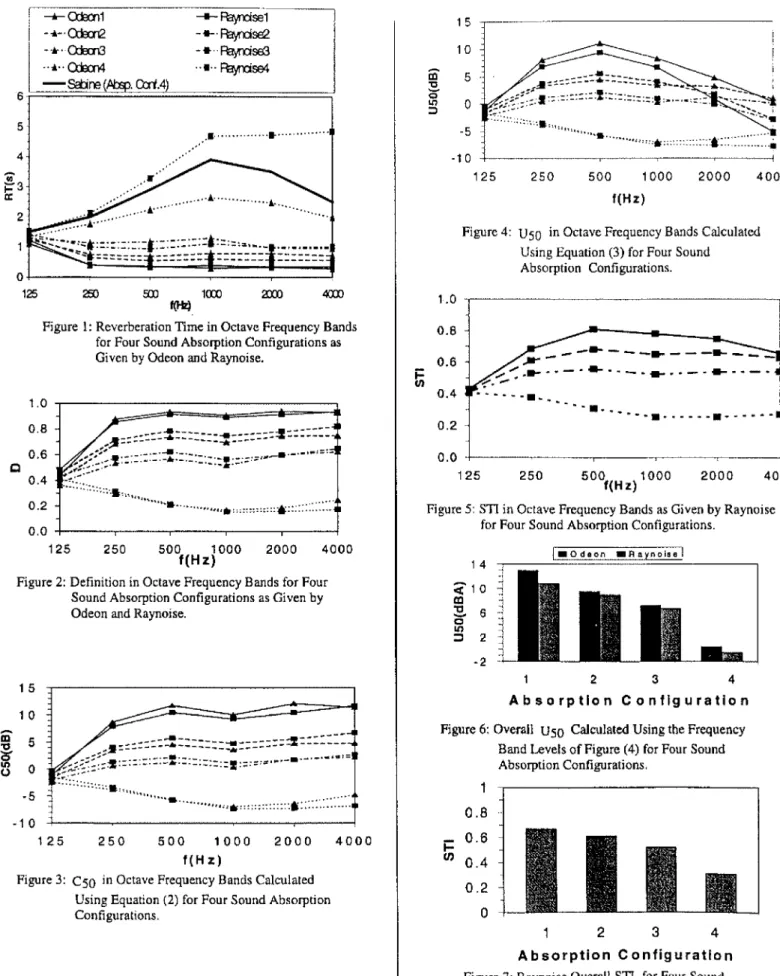
The speech intelligibility metrics and reverberation time were determined at eight different microphone positions unifonnly distributed inside the classroom. The classroom was supposed to be empty with no pupils or furniture, and the overall background noise level was 32 dB(A). The speech level and directivity was that ofamale talker with a nonnal vocal effort. The results from the eight microphone positions were averaged in each octave band. The final results are displayed for a specific metric as an octave band spectrum for each sound absorption configuration. Figure I shows the イH[セャNゥセエウ fcr エィセ Reverberation Time. As expected, RT decreases with the increase of sound absorption. The agreement between the results furnished by both programs is good with the exception of configuration 4. This corresponded to a classroom with no sound absorbing material. For this very reverberant room, Figure I also shows the RT as given by the Sabine equation. It is seen that neither Odeon nor Raynoise estimated the expected RT, as given by Sabine equation very acurately. For Odeon, changing the coefficient of diffusion of the room surfaces did not result in significant differences of RT. For Raynoise, diffusion is not taken into account for calculations at specific microphone positions (IMAGE Option Calculation). This situation is said to have been changed in Raynoise Rev3.0. It was found during the simulations that, for both programs, diffusion does not seem to have a significant effect on the speech intelligibility metrics. Figure 2 shows comparative results for D, as given by both computer programs. Figure 3 shows calculated values of CSO' using Equation (2). Figure 4 shows calculated values for U 50 ' using Equation (3), with the speech SPL values as given by the programs. The agreement is quite good and shows that speech intelligibility improves as the room sound absorption increases, but
an upper limit might exist as shown by the U50 values on Figure 4. As can be seen, U50 begins to decrease at high frequencies due to the reduction in the speech levels with added absorption inside the classroom. The same fact can be seen on Figure S, which shows values of STI, as given by Raynoise, for the four different absorption configurations. An upper limit on STI seems to have been reached a4000 Hz for the absorption configuration 4. Figure 6 shows values for the overallU50 in dBA calculated using the frequency band levels given in Figure 4. Figure 7 shows microphone position-averaged overall STI as given by Raynoise. The same trend is observed on these overall results; that is, there is
anincrease on the values of U50 and STI with sound absorption. However this might vary if the ambient noise level was increased.
(3)
{
D
}
U =101 ,
5U g 1- D
+
[1O(NOI",-SPl)I10]and
• VisitingScientist,University ofSao Paulo.Brazil.
-4000 2000 500 1000 f(H z)
1-0
dBon . R aynoise! 250i
I ! i セ - - _ . . - - - I...-
--,
"''''
...
-
...
_
...
_
...
_
..
::0' ..-'" I.'.'... -• . .
i
• • • • • I...•
-.
----
.
I I I 14 <,10 CO セ 6 o ll} :::l 2 -2 15 MMセM⦅N⦅MMMMMMMMMMMMM 10Figure 4: USO in Octave Frequency Bands Calculated Using Equation (3) for Four Sound
Absorption Configurations.
:
BァセGセG[セ
GZ[G[セセセ[セLGセG[Zセ[ZZZZZZNL
Z[Nセ[ G」LZ[[ZLセ
-51····:····:;;::···,",··" ..,··
""".:::::::::::::::.::::::::: :::..•
-10 125 250 500 1000 2000 4000 f(Hz) 0.0 125Figure 5: S11 in Octave Frequency Bands as Given by Raynoise for Four Sound Absorption Configurations.
1.0 0.8 0.6 i= (J)
OA
0.2 4000 2000 --Payrdse1 - • . Payrdse2 - •.. Paynjse3 ..•.. Payrdse4...•...•...
250M[セァセ[Zセ[[G[セセセセZセセ[セZZ[Z[ZセZLZ]
GセセセZLZ[N
.:::..:..:::::: ,,,.,,..
,LLLZZZLLZZZZZNZZZZZZZZZZZZセN
f(I-k)Figure 1: Reverberation Time in Octave Prequency Bands for Four Sound Absorption Configurations as Given by Odeon and Raynoise.
1.0 0.8 0.6 0.4 0.2 0.0 125 2 5 i -+-o:.t:al1
I -..-.
0:i:0l2 I ...Q:irrG ... Q:B::n4 6 -S:bre(.Aap.CcrlA) 4 500 1000 f(Hz)Figure 2: Definition in Octave Frequency Bands for Four Sound Absorption Configurations as Given by Odeon and Raynoise.
c
セS
a:
1 2 3 4
Absorption Configuration
Figure 6: Overall USO Calculated Using the Prequency Band Levels of Figure(4)for Four Sound Absorption Configurations,
4
32
0.2o
10.8
i=
0.6en
0.4
1 0 -5 5o
1 5 -10 125 250 500 1000 2000 4000 f(Hz)Figure 3: CSO in Octave Frequency Bands Calculated Using Equation (2) for Four Sound Absorption Configurations.
Absorption Configuration
Figure 7: Raynoise Overall STI for Four Sound Absorption Configurations.