Publisher’s version / Version de l'éditeur:
Vous avez des questions? Nous pouvons vous aider. Pour communiquer directement avec un auteur, consultez la première page de la revue dans laquelle son article a été publié afin de trouver ses coordonnées. Si vous n’arrivez pas à les repérer, communiquez avec nous à [email protected].
Questions? Contact the NRC Publications Archive team at
[email protected]. If you wish to email the authors directly, please see the first page of the publication for their contact information.
https://publications-cnrc.canada.ca/fra/droits
L’accès à ce site Web et l’utilisation de son contenu sont assujettis aux conditions présentées dans le site LISEZ CES CONDITIONS ATTENTIVEMENT AVANT D’UTILISER CE SITE WEB.
Canadian Acoustics, 19, 1, pp. 3-13, 1991
READ THESE TERMS AND CONDITIONS CAREFULLY BEFORE USING THIS WEBSITE. https://nrc-publications.canada.ca/eng/copyright
NRC Publications Archive Record / Notice des Archives des publications du CNRC : https://nrc-publications.canada.ca/eng/view/object/?id=dec0b088-af48-49e4-8f91-64599954d0ec https://publications-cnrc.canada.ca/fra/voir/objet/?id=dec0b088-af48-49e4-8f91-64599954d0ec
NRC Publications Archive
Archives des publications du CNRC
This publication could be one of several versions: author’s original, accepted manuscript or the publisher’s version. / La version de cette publication peut être l’une des suivantes : la version prépublication de l’auteur, la version acceptée du manuscrit ou la version de l’éditeur.
Access and use of this website and the material on it are subject to the Terms and Conditions set forth at
Remedial measures for traffic-induced vibrations at a residential site.
Part 1: Field tests
-
S e r
TH1
N 2 1 d
n
.
1
7
0
1
t
1
National Research
C o n d l national
1 9 9 1
Council Canada
de recherches Canada
B t D G .
Institute for
lnstitut de
-
- -
Research in
recherche en
Construction
construction
-
-Remedial Measures for Traffic-Induced
Vibrations at a Residential Site.
Part 1: Field Tests
by M.O. Al-Hunaidi and
J.H.
Rainer
Reprinted from
Canadian Acoustics
/
Acoustique Canadienne
19 (1). 1991
pp.'3-i 3
(IRC Paper No. 1701)
NRCC 32371
J NRC-
CISTII R C
%kL I B R A R Y
-%
eAPA
25
1991
+::
B ~ B L I O T H E Q U E
I R C
CNFZC-
I C I S ~Canadian Acoustics / Acoustique Canadienne 19(1) 3-13 (1991) Research paper 1 Article de recherche
REMEDIAL MEASURES FOR TRAFFIC-INDUCED VIBRATIONS AT A
RESIDENTIAL SITE. PART
1:
FIELD TESTS
M.O. Al-Hunaidi and J.H. Rainer
Institute for Research in Construction, National Research Council, Ottawa, Ontario KIA OR6
Abstract
Traffic-induced vibrations were investigated at a site after several complaints were lodged by homeowners residing near a roadway. The objective of the study was to investigate the factors influencing the level of these vibrations and their relative quantitative importance for this site. Based on the findings of the study, effective remedial actions were suggested. The present paper reports on the results of the experimental part of the study in which the effects of vehicle type, vehicle speed, vehicle weight, and road surface conditions were investigated. A companion paper reports on the results of the analytical part of the study in which the role of pavement/subbase characteristics, effectiveness of vibration screening by concrete walls, and soil improvement were investigated using finite element simulations.
A la suite de plaintes d6pos6es par plusieurs proprietaires de maisons situ6es le long d'une route, on a men6 une etude concernant les vibrations produites B cet endroit par la circulation. I1 s'agissait de determiner les facteurs qui influaient sur le niveau des vibrations et d'6valuer leur importance quantitative relative. En se basant sur les conclusions de I'Ctude, les auteurs ont propose des correctifs. Ce document fait 6tat des rtsultats du volet exptrimental de l'ttude, qui a port6 sur les effets du type de vthicule, de sa vitesse et de son poids, ainsi que sur les caracttristiques de la chaussb. Un document compltmentaire pr6sente les rtsultats du volet analytique de l'ttude, dans lequel les auteurs ont 6tudi6, B l'aide de simulations par tltments finis, le r6le de la chauss6ecouche de fondation, l'efficacit.6 du blocage des vibrations au moyen de murs de btton, ainsi que I'am6lioration du sol.
1
INTRODUCTION
are: degree of road roughness, vehicle weight, vehiclespeed, pavement/subgrade characteristics (e.g. Traffic induced vibrations are characterized by a source- pavement/,ubbase stiffness, soil support value), and path-receiver scenario- When a vehicle moves on a road, @ansmission path characteristics (e.g. soil type and profile, the stress field produced in the ground by the vehicle's and topography).
weight also moves along and hence stress waves are produced. This happens even in the absence of any imperfections or irregularities in the vehicle or the road. The presence of discrete irregularities in the road surface, e.g. potholes, cracks, unleveled manhole covers etc., as well
as
periodic and random surface roughness result in additional dynamic forces on the road that generate significant stress waves in the supporting soil. These waves radiate through the soil and eventually reach the foundations of adjacent buildings where certain frequency components can be amplified by the building's structure and lead to unacceptable vibration levels.Many factors affect the generation of these vibrations and their transmission to adjacent buildings. Chief among them
The possibility of inducing building vibrations due to vehicle acoustic noise also exists, especially if buildings are close to the road (Martin, 1978). Such noise may induce "rattles" inside buildings that may be very annoying. This aspect is not part of the present study.
Building vibrations induced by road traffic can reach levels that cause human annoyance, possible damage to old and historical buildings, and interruption of sensitive instrumentation and processes. Consequently, road administrators are often confronted with complaints and in some cases possible litigation. Thus existing vibration problems need to be resolved and future ones forestalled.
Various counter-measures are suggested to reduce traffic- induced vibrations. The main ones are: periodic maintenance to provide a smooth road surface, traffic flow control, traffic weight control, traffic speed control, improvement of roadJsubbase structure, screening of vibration by trenches or stiff obstacles, soil improvement, establishing an environmental zone and the use of building vibration isolation systems. Some of these measures may be readily seen as impractical or not cost effective. In addition, the suitability of any one or a combination of these measures is site specific.
The purpose of this study is to investigate the factors influencing the level of traffic vibrations, and their relative quantitative importance, for a site where several complaints were made by homeowners. Special emphasis is on the role of pavemendsubbase structure. Based on the findings of the investigation, effective remedial actions are suggested. At this site the road was founded on clay soil.
It must be mentioned that the results of this study should not be understood as generalizations for traffic-induced vibrations. They are applicable only to the site investigated here, although similar results might be obtained at other sites. The paper presents an approach and background work that are needed for aniving at effective remedial measures for a particular site.
The investigation consisted of: (a) Controlled field tests using different kinds of vehicles and sections of the road to establish the relative significance of: vehicle type, speed, weight, and road surface condition; (b) Computer simulations using the finite element method to investigate the role of pavementlsubbase characteristics. The effectiveness of vibrations screening by concrete walls as well as the improvement of soil under the road were also investigated. In this paper, field tests are described and their results reported. Computer simulations are presented in a companion paper (Al-Hunaidi and Rainer, 1990a).
2
SITE DESCRIPTION
Field tests consisted of measuring ground vibrations due to a test bus and a test truck on a residential road in the City of Hull, Quebec, where traffic induced vibrations have led to complaints by homeowners. The road runs in the east-west direction with a wide median separating the roadways for each traffic direction. Each roadway is two lanes wide, the right lane is used generally for vehicle parking and bus stops. The road includes a relatively steep hill sloping down towards the east. A much gentler slope continues eastward for the remainder of the road. The road surface of bituminous pavement is cracked and fissured in the transverse direction. Near the left curb many of the catch
basins provide major depressions in the riding surface. Posted speed limit is 50 kmlh.
Vibration measurements were taken at two locations. One set of vibration tests were performed on the sloping part of the road (Location 1). Another set of tests were performed on the slightly sloping part of the road (Location 2).
3
VIBRATION MEASUREMENTS
3.1
Measurement Stations
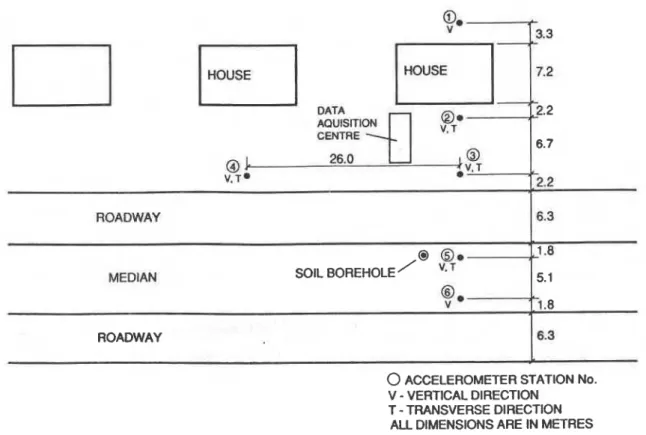
At each of the two test locations, ground vibrations were monitored at several measurement stations: at the edge of the road; close to houses adjoining the road; and on the median. The layouts of measurement stations for Location 1 and Location 2 are given in Figures 1 and 2, respectively. Ground vibrations were measured in the vertical and transverse directions (perpendicular to the road). Acceleration transducers were taped to wooden mounting plates (175 x 175 x 19 mm) attached to the ground using threaded thin rods (150 mm long). The plates were mounted on the ground after removal of surface vegetalion to a depth ranging from 100 to 200 mm (see Al-Hunaidi and Rainer, (1990b) for details). Stations 1 and 2 at Location 2 were on a paved driveway. For these two stations only, acceleration transducers were taped to steel plates laid directly on the driveway.
3.2
Instrumentation and data acquisition
Measurements were made with servo-accelerometers having a sensitivity of 5 Vlg (volts/gravity) in the frequency range 0-400 Hz. Signals from the accelerometers were amplified, low-pass filtered at 125 Hz, digitized at a sampling rate of 500 Hz, and then stored on a hard disk of a micro-computer. The signals were checked on site after the passage of each test vehicle. If overloaded channels were detected, necessary adjustments to channel gains were made and the test was repeated.
3.3
Data Processing
Recorded signals were processed in the frequency domain using both (i) one-third octave band analysis and (ii) narrow-band analysis. One-third octave band analysis was performed on a real-time analyser (Bruel & Kjaer 2134) using a single 8-second integration time. Broad-band amplitude of each record was calculated using the square root of the sum of squares of the one-third octave bands within the frequency range 1.6-25 Hz. Narrow-band analysis (Fourier transform) was performed on a micro- computer. The analysis was performed using a single 8192-
point FFT with a "rectangular" window (i.e. 16.4-second section of the signal). This 16.4-second rectangular window encompassed almost the whole event of vibrations induced by a passing test vehicle (e.g. see time records in Figures 14 and 15). Hence, there was no need for using other types of smoothing windows. Results are presented in the form of magnitude vs. frequency plots (Frequency spectra).
Time histories of recorded signals are presented in the form of envelopes formed by displaying the maximum and minimum accelerations of each 0.08 second time segment of the actual signal.
Narrow-band spectra were used to closely study the frequency content of traffic-induced ground vibrations, whereas 113-octave spectra and broad-band amplitudes were used to determine the amplitude variation of ground vibration as a function of vehicle type, vehicle weight, vehicle speed.
4
DESCRIPTION OF FIELD TESTS
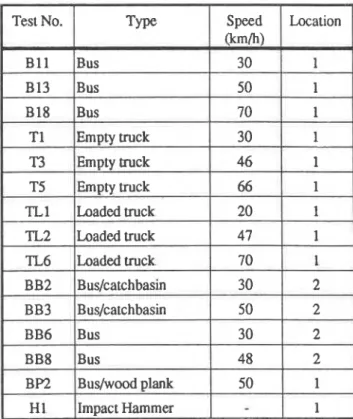
Controlled field tests were carried out ~lsing a transit bus and a medium size water truck (emptylfull). The truck was only used at Location 1, and weighed 8.7 tons empty and 11.08 tons when full with water. Both directions of the road were closed to traffic while experiments were carried out. Asummary of field tests anal~sed in this study is given in depression, the wood plank was attached to the road near
Table 1. the left curb so that only the left wheels of the vehicle
would pass over it. Location 2 included a catch basin near the left curb of the road (see Figure 2) which provided a
4.1 Speed control tests
typical depression in the road surface.
The following tests were performed: (i)bus passes over road depression, (ii) bus Test vehicles were driven past the measurement stations atspeeds of approximately 30, 50 and 70 kmh. Since avoids road depression. The test bus was driven at speeds Location 2 was close to an intersection it was considered of approximately 30 and 50 kmh.
unsafe to drive the test bus at 70 kmh. Vehicle speeds were measured using a hand-held "radar gun".
5
EXPERIMENTAL RESULTS
4.2
Weight control tests
The variation of vibration levels with vehicle weight was investigated by driving the water truck past measurement stations at Location 1 while empty and then full at approximately the same speed. The full truck was about 27% heavier than the empty one.
4.3
Tests of discrete road irregularities
The effect of a discrete irregularity was tested at Location 1 by driving test vehicles over a wood plank 40 mm high and 230 mm wide. In order to simulate a catch basin
5.1 Speed Control Tests
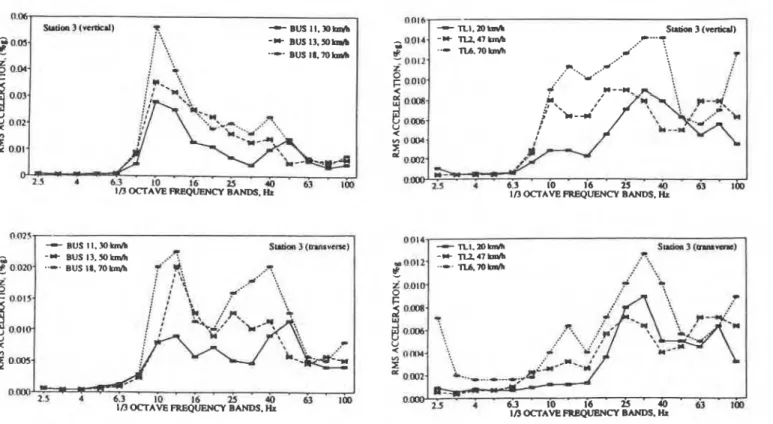
For the tests performed at Location 1, comparisons between one-third octave band spectra of different vehicle speeds are shown in Figures 3,4 and 5 for the bus, the empty truck and the loaded truck, respectively. In these figures, acceleration spectra for the vibration signals in both the vertical and rransverse directions at measurement station No. 3
are
shown. These results provide strong evidence that the amplitude of ground vibrations is substantially affected by vehicle speed. The higher the speed the higher the vibrations. This is especially true for frequency components at or near the predominant frequency of vibrations. Measurements made at other stations show the same trend as can be seen in Figure 6 for bus tests at 30 and 70 kmh.Table 1 Summary of field tesb
BB3 Bus/catchbasin 50 2
BB6 Bus 30 2
BB8 Bus 48 2
BP2 Buslwood plank 50 1
ROADWAY HOUSE
0
f 3.3 HOUSE DATAQ
6.70 1
26.0 Y. T * Lo
@a-.
1.8MEDIAN SOIL BOREHOLE' V- 5.1
ROADWAY
1
6.30
ACCELEROMETER STATION NO. V-
VERTICAL DIRECTIONT
-
TRANSVERSE DIRECTION ALL DIMENSIONS ARE IN METRES Figure 1 Layout of measurement ststions at Location I,STONE WALL /
3
v, T SI0 .
V.T+ 13 / ~ V , T. @
2.2/ ROADWAY2
.
cBb ,CATCH BASIN SOIL @, BOREHOLE MEDIANc
ROADWAY0
ACCELEROMETER STATION No.STATIONS @AND@ ARE SET ON DRIVEWAY PAVEMENT V
-
VERTICAL DIRECTIONH
-
HORIZONTAL DIRECTION ALL DIMENSIONS ARE IN METRESmm. ' $I.lia13(mrlll T
-
BUS I I . Y ) h r h3
-
0."- ,; i -) BUS 13.50 W j ': i ? "-' BUS l8.7Obd ;+
"""'I-
n1.B- sm‘km3(&)I
Figure 3 Vibration amplitudes for various speeds of a bus at Figure 5 Vibration amplitudes for various s p e d of a loaded truck
Location 1 at Location 1
DISTANCE FROM (ENlRBOF ROAD. M m
5 75 12.05
DISTANCE EXOM CFNTRE OF ROAD. METRES
Figure 4 Vlbation amplitudes for various speeds of an empty buck Figwe 6 1/3 octave band amplitudes of bus-induced vl'bratioI's at
Table 2
Broadband acceleration amplitudes (=lo4 g mu) at station 3. Location 1
Speed range 20-30 46-50 66-70 (km/h)
Measurement Transverse Vertical Transverse Vertical Transverse Vertical direction
Bus 1.6 4.2 2.9 6.1 3.7 7.8
-
-
ppI Loaded truck 0.9 1 1 .O 1.1 1.8 1.6 2.4
Empty truck 0.86 1.1 1.1 1.9 1.3 2.7
From the broad band amplitudes presented in Table 2 it can be observed that increasing vehicle speed from 30 to 50
km/h results in an average increase of vibration amplitudes of 55%; and increasing the vehicle speed from 50 km/h to 70 km/h leads to an average increase of vibration amplitudes of 30%.
Regarding the frequency content of the induced vibrations, there was an obvious difference between buses and trucks. As can be seen from narrow-band Fourier spectra, presented in Figures 7 and 8 for buses and loaded trucks, respectively, the following two observations
can
be made:-
the frequency content of the bus-induced vibrations is concentrated in a narrow range in the vicinity of 10 to 15 Hz.-
the frequency content of the truck-induced vibration is spread out over a wide range between 10 to 40 Hz.In general, the predominant frequency of vibrations at Location 1 is about 10 Hz.
5.2
Weight Control Tests
Figure 9 shows the one-third octave band spectra for the cases of empty and loaded water trucks tested at speeds of 50 and 70 kmh. From this figure and the broadband amplitudes presented in Table 2, it emerges that the weight of the truck has little effect on the amplitude of ground vibrations. When significant irregularities are present in the road surface, however, it was observed that heavier vehicles produce higher vibrations.
On the other hand, it is observed that vibration amplitudes induced by buses (at all speeds) in the frequency bands that are of primary interest here, 10 and 12.5 Hz, are larger by at least a factor of 3 compared with the vibration amplitudes induced by trucks. This could be due to the fact that the energy of impacts generated by buses, unlike trucks, is concentrated in these frequency bands, as will be elaborated
later. The weight difference is an unlikely cause since the weights of the test bus and the loaded truck were approximately the same. It should be noted that the frequencies of primary interest in this study are those which correspond to the maximum one-third octave band amplitude of vibrations at a house floor. In earlier measurements at the same test sites, these were found to be 10 and 12.5 Hz.
5.3
Tests with Discrete Road Irregularities
Catchbasins
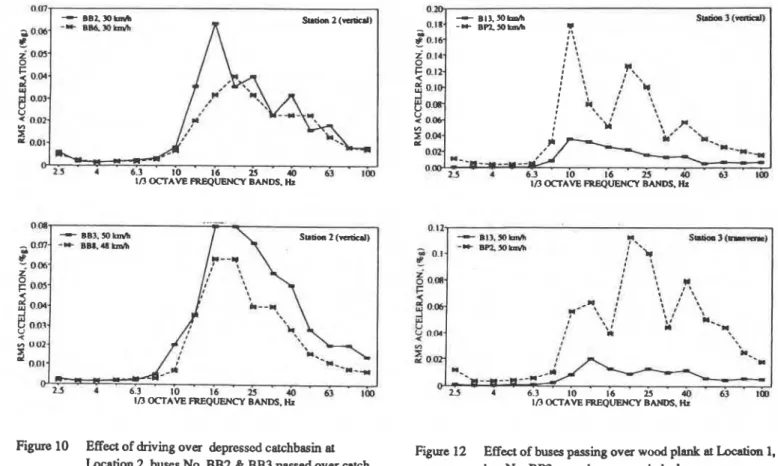
The results of these tests with buses at station No. 2 at Location 2 are shown in Figure 10 in the form of one-third octave band spectra of the vertical acceleration. Buses No. BB2 and BB3 passed over a a depressed catchbasin at speeds of 30 and 50 km/h. Buses No. BB6 and BB8 avoided the catchbasin, but were driven at the same speed as BB2 and BB3, respectively. As expected, the surface irregularity provided by the catchbasin led to significant increase in vibration levels. The broadband amplitude for buses running at 30 km/h increased by 42%, and for buses running at 50 km/h they increased by 33%. The predominant frequency of vibration observed at this site (Location 2) was found to be between 17 to 23 Hz as can be seen from the Fourier spectrum in Figure 11.
Wood ~ l a n k s
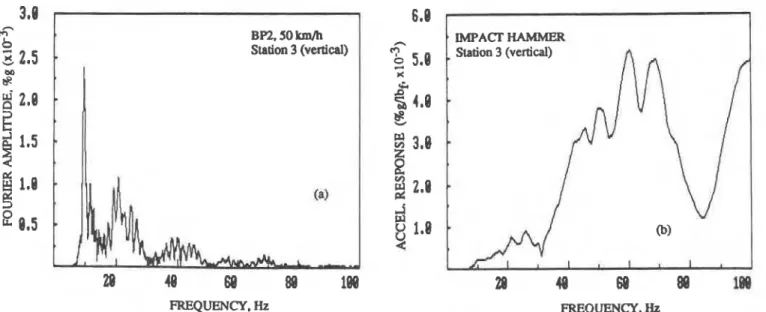
Tests performed with a bus passing over a wood plank (40 mm high) attached near the left edge of the road at Location 2 indicate that vibration levels could increase by a factor as much as 10 times due to the presence of such an irregularity. This can be seen from the one-third octave band spectra presented in Figure 12 for the acccleralion at Station 3 due to a bus running at 50 kmlh. From Lhe Fourier spectrum in Figure 13a, it can also be observed that the bus impact with the wood plank resulted in new frequency peaks at approximately 20, 25 and 40 Hz. Interestingly, these frequency peaks correspond to some of the peaks of
FREQUENCY.
Hz
FREQUENrn,Hz
Figure 7 Acceleration Fourier spectra of bus-induced vibrations at station 3, Location 1
40
69
88
188
FREQUENCY, Hz
Figure 9 Weight control tests using empty and loaded truck U
.
. i O.I* I I 0 I I F 0.12- <g
0.1.e
0-m- Y owf
0.w 0.m 6 10 6 63 I(X1If3 OCTAVE FREQUENCY BANDS. Hr
0016-
Figure 10 Effect of driving over depressed catchbasin at Figure 12 Effect of buses passing over wood plank at
~~
1.Location 2 buses No. BB2 & BB3 passed over catch bus No. BP2 passed o v a wood plank basin - u r n - a
1.0
,oa~*- 1P-OOlz. ig
0010-2
o ma
.,
Y cn 0 . m J: w 0 0x4. w 2 4 a 6 3 10 16 n o i 3 - 1 r n Location 2If3 OCrAVE FWQW%CY BANDS. H. -= n , m ~
48
60
A
la0
FREQUENCY,
Hz
the frequency response function for the site, shown in Figure 13b, obtained from an impact test using an instrumented hammer. This means that the predominant frequencies of traffic-induced vibrations correspond with the natural frequencies of the site (note: natural frequencies of a site are the frequencies of the various modes of one- dimensional vibration of the soil stratum; they are the frequencies of peaks of the site's response function). Time history envelopes of vertical ground acceleration at Station 3 of Location 1 are shown in Figures 14 and 15 for the test bus and the test truck, respectively. By closely inspecting the spikes in these records one can detect a certain pattern of impacts. Mainly, it can be observed that a small spike is usually followed by a larger spike. The first spike corresponds to the front wheels of a vehicle hitting a crack or a ripple on the road surface, followed by the rear wheels hitting the same irregularity. This can be seen clearly from the record of truck TL1 running at 20 km/h (Figure 15). The first major spike in this record is smaller than the second major spike. The &e difference between the two spikes is approximately 0.86 seconds. During this time the truck travels a distance of 4.8 m which is about the distance between the front and rear wheels of the front and rear wheels.
Since the spikes in the time records of Figures 14 and 15 have been identified as resulting from road irregularities, e.g. cracks and ripples, the potential of reducing ground vibration levels by providing a smooth road surface is thus evident. By comparing the amplitudes of the spikes to the general vibration background amplitude, il is conservatively estimated that the peak acceleration can be reduced between 40 to 50%.
6
DISCUSSION
&
RECOMMENDATIONS
The fact that the frequency content of bus-induced vibrations, unlike truck-induced vibrations, is concentrated in a narrow range is probably an indication that the energy of bus-road interaction forces is also concentrated in a narrow frequency range. This is possibly due to the different characteristics of suspension systems of buses and trucks. The characteristics of a suspension system depend on its stiffness and the unsprung mass of the vehicle. In general, buses tend to have "soft" suspension systems as opposed to "stiff" (uncomfortable) ones in trucks. A stiff suspension system produces "sharper" impacts on the road than those produced by a soft system. Sharp impacts have wide frequency content. Concentrating the impact energy in a narrow frequency range,
as
happens with buses, leads to higher vibration peaks. Most likely also, the unsprung masses of the two test vehicles are different. This could lead to significant difference in interaction forces betweenthe vehicle and the road. A detailed investigation of this whole phenomenon was beyond the scope of this study. The predominant frequency of vibrations at Location 2 being higher than that observed at Location 1 is due to the fact that the soil layers at the latter location are deeper than those at the first one, as was found from the soil surveys. It is well known that the deeper the site the lower its fundamental frequency (e.g. see Wolf, 1985).
Finally, based on the findings of field experiments it emerges that:
-
enforcing the 50 km/h speed limit, which was observed to be generally exceeded by 20 km/h, results in 23 % vibration reduction;-
eliminating discrete irregularities such as catchbasin depressions reduces vibration levels by approximately 30% and-
providing a smoother road surface by eliminating cracks and ripples reduces peak vibration levels by as much as 50%.It should be noted that the effects of these three measures are not simply cumulative since they are interdependent. It is estimated, however, that the overall effect of these remedies is likely to reduce the vibration levels by more than 50%. Such a reduction would help bring down the vibration levels for the test sites to an acceptable human annoyance level. This is based on earlier measurements at the same site which showed that acceptable levels were exceeded by up to 50%.
7
SUMMARY OF RESULTS
The results of field experiments, for the site under investigation, show that:
The amplitude of ground vibrations is significantly influenced by vehicle speed. Broadband amplitudes increase by an average of 55% when speed is increased from 30 to 50 km/h and by an average of 30% when speed is increased from 50 to 70 km/h.
Tests with empty and loaded water trucks show that the weight of the vehicle has little effect on the amplitude of ground vibrations.
Discrete irregularities in the road surface have a significant effect on the amplitude of ground vibrations. Broadband amplitudes increased by 42% and 33% for a bus passing over a depressed catchbasin at 30 and 50 kmh, respectively, compared to a bus that avoided passing over the depression.
, W A C X HAMMER
.
Station 3 (vertical)b
20
48
68
88
188
20
40
68
80
100
FREQUENCY. Hz FREQUENCY. HzFigure 13 Fourier spectra of a bus passing over a discrete irregularity; and an impact using an instrumented hammer at Location 1
--
9.2
12.4
15.6
18.8
nee
3.2
6.4
3.6
12.8
16.8
TIME. SECONDS
TIME. SECONDS Figure 14 Timeversus-amplitude envelopes of bus-induced vibrations at station 3. Location 1
1.794
2.132
h-
P. c.l+
x1 . B
V9
V K1.421
s
i
0.598
2
0 F:6
0m710
0.m
F2
8.000
W4.m
!j
4.718
u
-1.196
-1.421
11.2
14.4
17.6
1.8
24.0
3.2
6.4
3.6
12.8
16.8
TIME, SECONDS TIME. SECONDS Figure 15 Timeve~sus-amplitude envelopes of loaded truck-induced vibrations at station 3. Location 1
Tests with a 40 mm wood plank show an increase of vibration levels by a factor of 10.
Time history envelopes suggest that peak ground acceleration can be reduced by as much as 50% by eliminating cracks and irregularities and providing a smooth road surface.
The frequency content of bus-induced vibrations is concentrated in a narrow range whereas that of truck-induced vibrations is spread over a wide range.
For the frequency bands of interest, 10 and 12.5 Hz, bus-induced vibrations are higher by at least a factor of 3 than truck-induced vibrations.
Fourier spectra obtained from tests in which the bus passed over an irregularity show several frequency peaks that did not appear before. This can cause individual building components, e.g. slabs and walls that generally have high resonance frequencies, to start resonating.
The dominant frequency of ground vibrations was found to be between 17 and 23 Hz at the Location 2 and about 10 Hz at Location 1.
ACKNOWLEDGEMENTS
This study was conducted for the service de ghie, Ville de Hull, Quebec, with partial funding from the Quebec Ministry of Transportation and the National Research Council of Canada. The authors are grateful to Messrs. R. Glazer and J. Marans for their help with field experiments and data processing, and to Dr. K.T. Law and Messrs. T. Hoogeveen and A. Laberge who provided the soil surveys. The cooperation of the service de genie, Ville de Hull, the Transit Authority of Outaouais and the homeowners on Mont-Bleu Blvd. is gratefully acknowledged.
REFERENCES
Al-Hunaidi, M.O., and Rainer, J.H. 1990a. Remedial measures for traffic-induced vibrations at a residential site. Part 2: FEM simulations. accepted by Canadian Acoustics.
Al-Hunaidi. M.O., and Rainer, J.H. 1990b. Evaluation of measurement limits of transducer mountings in the ground. Canadian Acoustics, Vol. 18, No. 3, pp. 15-27.
Martin. D.J. 1978. Low frequency noise and building vibration. Transport and Road Research Laboratory, Report No. TRRL 402, Crownthome, Berkshire, U.K.
Wolf, J.P. 1985. Dynamic Soil-Structure Interaction, Prentice-Hall Inc., Englewood Cliffs. N.J.