nitrativorans, Hyphomicrobium denitrificans, and Hyphomicrobium
zavarzinii
Christine Martineau,* Florian Mauffrey, Richard Villemur
INRS-Institut Armand-Frappier, Laval, QC, Canada
Hyphomicrobium spp. are commonly identified as major players in denitrification systems supplied with methanol as a carbon
source. However, denitrifying Hyphomicrobium species are poorly characterized, and very few studies have provided
informa-tion on the genetic and physiological aspects of denitrificainforma-tion in pure cultures of these bacteria. This is a comparative study of
three denitrifying Hyphomicrobium species, H. denitrificans ATCC 51888, H. zavarzinii ZV622, and a newly described species,
H. nitrativorans NL23, which was isolated from a denitrification system treating seawater. Whole-genome sequence analyses
revealed that although they share numerous orthologous genes, these three species differ greatly in their nitrate reductases, with
gene clusters encoding a periplasmic nitrate reductase (Nap) in H. nitrativorans, a membrane-bound nitrate reductase (Nar) in
H. denitrificans, and one Nap and two Nar enzymes in H. zavarzinii. Concurrently with these differences observed at the genetic
level, important differences in the denitrification capacities of these Hyphomicrobium species were determined. H. nitrativorans
grew and denitrified at higher nitrate and NaCl concentrations than did the two other species, without significant nitrite
accu-mulation. Significant increases in the relative gene expression levels of the nitrate (napA) and nitrite (nirK) reductase genes were
also noted for H. nitrativorans at higher nitrate and NaCl concentrations. Oxygen was also found to be a strong regulator of
denitrification gene expression in both H. nitrativorans and H. zavarzinii, although individual genes responded differently in
these two species. Taken together, the results presented in this study highlight the potential of H. nitrativorans as an efficient
and adaptable bacterium that is able to perform complete denitrification under various conditions.
H
yphomicrobium spp. are restricted facultative methylotrophs
that reproduce by budding at the tip of a polar prostheca.
They are ubiquitous in water and soil but can also be found in
sewage treatment plants (1). Some strains have been characterized
by their denitrification capacities (2–5). They have often been
identified as major players in denitrification systems
supple-mented with methanol (4,
6–8), and their presence has been
asso-ciated with high denitrification rates (9,
10).
Denitrification takes place in bacterial cells where N-oxides
and/or N-oxyanions serve as the terminal electron acceptor
in-stead of oxygen (O
2) for energy production when oxygen
deple-tion occurs, leading to the producdeple-tion of gaseous nitrogen (N
2)
(11). Four sequential reactions are essential for the reduction of
nitrate to gaseous nitrogen via nitrite, nitric oxide, and nitrous
oxide intermediates, and each of these reactions is catalyzed by
different enzymes, namely, nitrate reductases (Nar and Nap),
ni-trite reductase (Nir), nitric oxide reductase (Nor), and nitrous
oxide reductase (Nos) (12–14).
Previous studies using DNA hybridization with probes
target-ing genes encodtarget-ing the catalytic subunit of denitrification
reduc-tases (narG, nirK, nirS, and nosZ) detected denitrification genes in
several members of the genus Hyphomicrobium, including H.
denitrificans and H. zavarzinii (2,
3). H. denitrificans (5) is
com-monly found in soils, freshwater environments, and activated
sludge. This bacterium has the capacity to denitrify (2), and its
nitrite and nitrous oxide reductases were previously characterized
(15–18). H. zavarzinii is a soil bacterium that has been studied
mainly for the biotechnological potential of the exceptional
form-aldehyde dehydrogenase found in strain ZV580 (19,
20). Recently,
we described a new denitrifying species of the genus
Hyphomicro-bium, H. nitrativorans NL23
T(21,
22). This bacterium was isolated
from a methanol-fed denitrification system treating seawater at
the Montreal Biodome in Canada. H. nitrativorans was one of the
most abundant bacterial species in the denitrifying biofilm, along
with Methylophaga nitratireducenticrescens JAM1
T, which was also
isolated from this biofilm and which can reduce nitrate into nitrite
(23,
24). Given that pure cultures of H. nitrativorans grow poorly
in seawater (21), we believe that M. nitratireducenticrescens JAM1
and H. nitrativorans NL23 work together in syntrophy in the
bio-film to achieve the complete denitrification pathway.
Despite the presence of denitrifying Hyphomicrobium spp. in
many environments or denitrification processes, genetic and
physiological information regarding their denitrification
capaci-ties is poorly documented. This could be related to the fact that
Hyphomicrobium spp. can be hard to culture, especially under
denitrifying conditions. In this study, three denitrifying
Hyphomi-Received 17 March 2015 Accepted 12 May 2015 Accepted manuscript posted online 15 May 2015
Citation Martineau C, Mauffrey F, Villemur R. 2015. Comparative analysis of denitrifying activities of Hyphomicrobium nitrativorans, Hyphomicrobium
denitrificans, and Hyphomicrobium zavarzinii. Appl Environ Microbiol
81:5003–5014.doi:10.1128/AEM.00848-15. Editor: V. Müller
Address correspondence to Richard Villemur, [email protected]. * Present address: Christine Martineau, Laboratoire de Santé Publique du Québec, Ste-Anne-de-Bellevue, QC, Canada.
Supplemental material for this article may be found athttp://dx.doi.org/10.1128 /AEM.00848-15.
Copyright © 2015, American Society for Microbiology. All Rights Reserved. doi:10.1128/AEM.00848-15
crobium species, H. nitrativorans, H. denitrificans, and H.
zavarzi-nii, were compared at the genetic and physiological levels. Because
H. nitrativorans was isolated from a marine environment, we
fo-cused on the effect of salt on denitrification. Among the major
differences found between their genomes was the type of nitrate
reductase that they encode. Our results showed that H.
nitrativ-orans sustained better denitrifying activity than the other two
spe-cies and had a better tolerance to higher nitrate and NaCl
concen-trations. The effect of variations in the nitrate and NaCl
concentrations on the relative expression levels of the nitrate and
nitrite reductase genes was also assessed.
MATERIALS AND METHODS
Genome sequence analyses. Hyphomicrobium nitrativorans strain NL23T (ATCC BAA-2476), Hyphomicrobium denitrificans strain XT (ATCC 51888), and Hyphomicrobium zavarzinii strain ZV622T(ATCC 27496) were used in this study. The general characteristics of the three bacterial species are presented in Table S1 in the supplemental material. Publicly available genome sequences of H. nitrativorans NL23 (GenBank accession numberNC_022997) (22), H. denitrificans ATCC 51888 (GenBank acces-sion numberNC_014313) (25), and H. zavarzinii ATCC 27496 (GenBank accession numbersKB911255toKB911269for 15 scaffolds) were re-trieved from GenBank, imported into RAST (Rapid Annotation Using Subsystem Technology) (26) for annotation, and processed in SEED viewer (27) to identify denitrification gene clusters and associated regula-tory genes. Orthologous genes were determined with the “sequence-based comparison” tool in SEED viewer and refined by hand. Briefly, the de-duced amino acid sequences for all the annotated genes of one genome were compared to those of the other two genomes by BLAST (automated process in SEED viewer). This comparison was performed three times with a different genome set as the reference each time. Only genes that resulted from reciprocal analysis were considered orthologous. The three genomes were also annotated by the Integrated Microbial Genomes (IMG) comparative analysis system of the Joint Genome Institute (http: //img.jgi.doe.gov/) (28). The majority of the differences in annotations between RAST and IMG were in genes encoding hypothetical proteins with unknown functions. However, both annotation systems provided similar results for orthologous genes. The results were derived from RAST because supplemental options were not available in IMG. A genome com-parison of the three species was further performed with MAUVE (29). The average nucleotide identity (ANI) was determined for each pair of species (http://enve-omics.ce.gatech.edu/ani/). Deduced amino acid sequences derived from the napA, narG, nirK, cnorB, and nosZ genes that were re-trieved from the genomes of the three Hyphomicrobium species, as well as sequences of their closest relatives and representative sequences of the Proteobacteria, were aligned by using ClustalW, and phylogenetic trees were constructed by using the neighbor-joining algorithm (30) with the Poisson correction method in MEGA version 6.06 (31).
Bacterial strains and growth conditions. Bacteria were cultured in
modified Hyphomicrobium medium 337a (32) [composition (per liter), 1.3 g KH2PO4, 1.13 g Na2HPO4, 0.5 g (NH4)2SO4, 0.2 g MgSO4·7H2O, 3.09 mg CaCl2·2H2O, 2.0 mg FeSO4·7H2O, 1.0 mg Na2MoO4·2H2O, 0.88 mg MnSO4·4H2O, and 10g CuCl2·2H2O (pH 7.5)] at 30°C. The NaCl concentrations were variable depending on the assay and are specified below. When required, nitrate was added to the growth medium as so-dium nitrate (NaNO3) at a concentration of 14.3 mM (200 mg NO3-N liter⫺1, unless otherwise specified). Nitrate was added to the precultures for all of the assays conducted under denitrifying conditions (unless oth-erwise specified). Methanol was added to the growth medium as a carbon source at a concentration of 0.3% (vol/vol) prior to inoculation. Vitamin B12was also added at a concentration of 0.1 mg liter⫺1prior to inoculation to stimulate bacterial growth on solid medium and in liquid medium to start cultures from bacterial colonies. The inoculum was made of fresh aerobic liquid cultures. Bacterial cells were pelleted, dispersed in a 0.85%
NaCl solution, and homogenized prior to inoculation. The initial optical density of the cultures was adjusted to reach an optical density at 600 nm (OD600) close to 0.1. In order to assess the capacity of the three
Hyphomi-crobium species to achieve complete denitrification, the N2O concentra-tions in the headspace of cultures incubated with and without 10% (vol/ vol) acetylene, an inhibitor of the nitrous oxide reductase, were compared (33).
Aerobic cultures used for RNA extraction were incubated with con-stant shaking (250 rpm) in 200-ml Erlenmeyer flasks containing 30 ml of growth medium. For cultures under denitrifying conditions, 30 ml of growth medium supplemented with nitrate was dispensed into 70-ml serum vials. The vials were sealed with rubber stoppers and metal seals, flushed for 10 min with N2to remove oxygen from the headspace, and autoclaved. Substrate addition, inoculation, and sampling of these vials were performed through the rubber stopper using a syringe and a needle. All cultures were incubated in the dark. Bacterial growth was monitored by spectrophotometry (OD600). The nitrate and nitrite concentrations in the cultures were determined by ion chromatography using an 850 Professional IC instrument (Metrohm, Herisau, Switzerland) with a Metrosep A Supp 5 analytical column (250 by 4.0 mm), while N2O was analyzed by injecting 250l of the headspace into an Agilent 6890 gas chromatograph equipped with a microelectron capture detector.
RNA extraction. RNA was extracted from 15 to 30 ml of bacterial
culture in the mid-exponential growth phase. Bacterial cells were centri-fuged, transferred into 2-ml tubes containing 500 mg of 0.1-mm zirconia-silica beads (Biospec Products, Bartlesville, OK, USA), and dispersed in 700l of a solution containing precooled TPM buffer (50 mM Tris-HCl [pH 7.0], 1.7% [wt/vol] polyvinylpyrrolidone K25, 20 mM MgCl2), 35l of 20% SDS, and 500l of phenol. The samples were flash frozen with liquid nitrogen and stored at⫺80°C until RNA extraction was performed. After thawing, RNA was extracted by bead beating twice with a Fast-Prep-24 instrument (MP Biomedicals, Solon, OH, USA), with the power set at 6.5 for 45 s. The tubes were then centrifuged at 20,000⫻ g for 5 min at 4°C, and the upper phase was transferred into a new tube. The bead beating and centrifugation steps were repeated following the addition of 700l of PBB buffer (5 mM Tris-HCl [pH 7.0], 5 mM Na2EDTA, 1% [wt/vol] SDS, 6% [vol/vol] water-saturated phenol) to the tubes contain-ing the bacterial cells. Both upper phases were further extracted with phe-nol-isoamyl alcohol (25:24:1 [vol/vol/vol]) and chloroform-isoamyl alcohol (24:1 [vol/vol]). For each extraction step, centrifugation was performed at 20,000⫻ g for 5 min at 4°C. RNA was recovered by precipitation with a 1/10 volume of 3 M sodium acetate (pH 5.2) and 2 volumes of 100% ethanol at⫺20°C overnight. After centrifugation at 20,000⫻ g for 45 min at 4°C, the supernatant was discarded, and the pellets were washed with 70% ethanol (13,000⫻ g for 10 min at 4°C), dried at room temperature for 15 min, dissolved in diethyl pyrocarbonate (DEPC)-treated water, and treated with Turbo DNase (Ambion; Life Technologies Inc., Burlington, ON, Canada) for 30 min to remove all contaminating DNA. Finally, RNA extracts were purified by using the RNeasy MinElute Cleanup kit according to the manufacturer’s instruc-tions (Qiagen, Toronto, ON, Canada). RNA integrity was verified by gel electrophoresis, and RNA quantification was performed by using a Nano-Drop ND-1000 spectrophotometer (NanoNano-Drop Products, Wilmington, DE, USA). The absence of DNA was confirmed by endpoint PCR analysis using 16S rRNA gene universal primers.
Reverse transcription and quantitative PCR assays. cDNAs were
generated from RNA by using hexameric primers and the reverse tran-scription system from Promega (Madison, WI, USA) with 1g of ex-tracted RNA, according to the manufacturer’s protocols. Real-time quan-titative PCR (qPCR) assays were performed with PerfeCTa SYBR green SuperMix ROX (Quanta; VWR International, Ville Mont-Royal, QC, Canada). The final volume of all of the reaction mixtures was 20l, and the amplification mix was composed of 10l of PerfeCTa SYBR green SuperMix, 0.4l of each primer (40 pmol), 4.2 l of RNA-free water, and 5l of cDNA (50 ng). All of the reactions were performed with a Corbett
Rotor-Gene 6000 real-time PCR machine (Qiagen). PCR started with an initial denaturation step for 10 min at 95°C followed by 40 cycles of 30 s at 95°C, 30 s at 55°C, and 30 s at 72°C. The fluorescence signal was acquired at the end of the 72°C step and at the end of a 15-s reading step at 80°C that was added to the end of each cycle to avoid fluorescence from primer dimers. Primers were designed with Primer3web version 4.0.0 (34,35) to target the napA, narG, nirK, cnorB, and nosZ denitrification genes and the rpoB and dnaG reference genes of the three Hyphomicrobium species (see Table S2 in the supplemental material). Each of the primer sets was tested for specificity and efficiency of amplification by qPCR with serial dilutions of purified PCR fragments (efficiencies of between 0.92 and 1.05).
Calculations and statistical analyses. Growth and denitrification
rates were obtained by calculating the slope of the linear portion of the growth and denitrification curves, respectively. Relative gene expression was calculated according to the⌬⌬CTmethod (36). For each calculation, only one housekeeping gene was used as a control. For each Hyphomicro-bium species, the control gene was chosen from among the two genes tested (rpoB and dnaG) by using RefFinder (http://www.leonxie.com /referencegene.php), an online tool that allows the selection of the appro-priate control gene based on the lowest variability according to geNorm (37), Normfinder (38), BestKeeper (39), and the comparative ⌬⌬CT method (40). Statistical analyses were performed with R (version 2.9.0; R Foundation for Statistical Computing). The effects of nitrate and NaCl concentrations on growth and denitrification rates were tested by using factorial analysis of variance (ANOVA). Prior to factorial ANOVA, nor-mality was tested by using the “shapiro.test” function. When necessary, data were log transformed to meet parametric ANOVA assumptions. ANOVA and post hoc Tukey honestly significant difference (HSD) tests were then carried out by using the “aov” and “TukeyHSD” functions, respectively. If significant interactions were detected between the two fac-tors, ANOVA was performed on a subset of data that were generated for each factor. Normality was tested again on each data subset prior to ANOVA. The statistical significance of the⌬⌬CTvalues was tested by Student’s t test (two tailed, heteroscedastic).
RESULTS
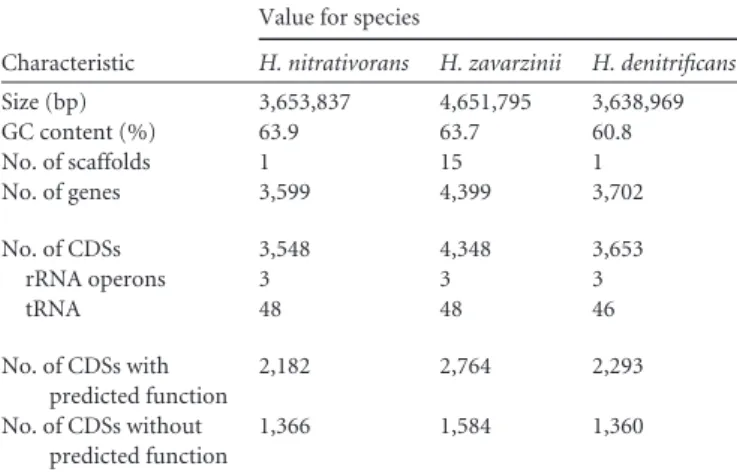
Genome comparison. The general characteristics of the three
ge-nomes are presented in
Tables 1
and
2
and
Fig. 1. A total of 1,961
orthologous genes are shared among the three species (Fig. 1),
with 2,150 orthologous genes shared between H. nitrativorans and
H. denitrificans, 2,687 shared between H. nitrativorans and H.
za-varzinii, and 2,355 shared between H. denitrificans and H.
zavar-zinii (Table 2). The number of unique genes (found in one species
but not in the other two) constitutes between 16.3 and 25.7% of
the total genes, with the highest number of unique genes being
found in H. denitrificans (Fig. 1). However, a large number
(
⬎75%) of these unique genes are annotated as hypothetical
pro-teins with unknown functions (HP). When the genomes were
compared for the average deduced amino acid sequence identity
between orthologous genes and for the average nucleotide identity
(ANI) between whole-genome sequences, H. nitrativorans and H.
zavarzinii showed a higher level of identity with each other than
with H. denitrificans (Table 2). These results are consistent with
the results of phylogenetic analysis of the 16S rRNA gene
se-quences (21).
Putative unique pathways were found in each species or in two
out of three species (see Table S3 in the supplemental material). A
long cluster of genes associated with photosynthesis is present in
H. zavarzinii, although there is no indication in the literature of
photosynthesis-related activities in this bacterial species. The urea
decomposition pathways differ among the three species. Urea is
degraded into CO
2and NH
3by urease in H. denitrificans and by
urea carboxylase and allophanate hydrolase in H. zavarzinii. No
urea decomposition pathway was found in H. nitrativorans.
Genes encoding the Na
⫹/H
⫹multisubunit antiporter were found
in H. nitrativorans, and NhaA-type and NhaD-type Na
⫹/H
⫹an-tiporter genes were found in the other 2 species. H. nitrativorans
and H. zavarzinii carry genes encoding methylamine
dehydroge-nase and associated proteins. These genes were not found in H.
denitrificans, which is surprising because this bacterium can utilize
monomethylamine, dimethylamine, and trimethylamine as sole
carbon sources (5). Clustered regularly interspaced short
palin-dromic repeats (CRISPRs) and CRISPR-associated proteins were
found in H. nitrativorans, whereas only CRISPR-associated
pro-teins were found in H. zavarzinii. However, the draft genome
showed an
⬃3,000-bp gap flanking the chromosomal region of
the genome, suggesting a repeated region that could not be
assem-bled properly.
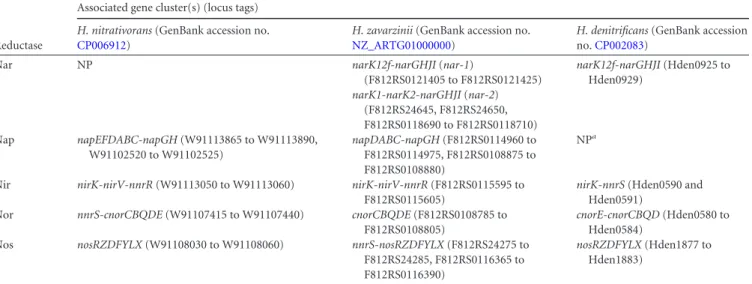
Genes associated with the denitrification pathway. All three
Hyphomicrobium species studied here possess gene clusters
en-coding the full set of enzymes necessary to achieve complete
deni-trification, although they differ greatly in their nitrate reductases
(Table 3). The genome of H. nitrativorans contains a gene cluster
encoding the periplasmic nitrate reductase Nap, the genome of H.
denitrificans contains a gene cluster encoding the
membrane-TABLE 1 General characteristics of the genomes of the threeHyphomicrobium speciesa
Characteristic
Value for species
H. nitrativorans H. zavarzinii H. denitrificans Size (bp) 3,653,837 4,651,795 3,638,969 GC content (%) 63.9 63.7 60.8 No. of scaffolds 1 15 1 No. of genes 3,599 4,399 3,702 No. of CDSs 3,548 4,348 3,653 rRNA operons 3 3 3 tRNA 48 48 46 No. of CDSs with predicted function 2,182 2,764 2,293 No. of CDSs without predicted function 1,366 1,584 1,360
aSequence analyses were performed in RAST. CDSs, coding DNA sequences.
TABLE 2 Comparative analysis of the genomes of the Hyphomicrobium species
Species
H. nitrativorans H. zavarzinii
No. of orthologsa Ortholog identity (%)b ANI (%) No. of orthologsa Ortholog identity (%)b ANI (%)
H. zavarzinii 2,687 73.90 82.50
H. denitrificans 2,150 60.60 80.80 2,355 61.80 81.00
a
Number of orthologous genes in common between the respective species.
bound nitrate reductase Nar, and the genome of H. zavarzinii
contains gene clusters encoding one Nap and two Nar enzymes.
The three species also have a nirK gene encoding the
copper-con-taining nitrite reductase, along with the nirV gene encoding an
accessory protein in H. nitrativorans and H. zavarzinii. Gene
clus-ters encoding the nitric oxide (Nor) and nitrous oxide (Nos)
re-ductases and with similar gene organizations were also detected in
the three genomes. The only exception is norE, which is located
upstream in a direction opposite that of cnorCBQD in H.
denitri-ficans (Table 3). Genes associated with nitrate transport were
de-tected upstream of the nar gene clusters in H. denitrificans and H.
zavarzinii. Two distinct genes encoding NarK transporters, a
NarK1-type symporter and a NarK2-type nitrate/nitrite
anti-porter, are located upstream of the nar-2 gene cluster in H.
zavar-zinii. One gene encoding a fused NarK1-NarK2-type transporter
(here named narK12f) (41) is located upstream of the nar-1 gene
cluster in H. zavarzinii and the nar gene cluster in H. denitrificans.
Genes commonly associated with the regulation of
denitrifica-tion gene expression, such as nnrS and nrrR, were detected in the
three genomes. Most of these genes belong to the CRP (cyclic
AMP receptor protein)/FNR (fumarate and nitrate reductase
reg-ulation) family; some of them are located close to the
denitrifica-tion gene clusters (Table 3). The narXL two-component
tran-scription regulatory system was found in H. denitrificans and H.
zavarzinii. However, it is not located in the vicinity of the
denitri-fication gene clusters in either species.
Phylogenetic analyses were performed on the deduced amino
acid sequences of genes encoding the catalytic subunits of the
different reductases (NapA, NarG, NirK, cNorB, and NosZ)
found in the three Hyphomicrobium species. All these reductases
are phylogenetically related to known denitrification reductases
found in other Alphaproteobacteria, with sequence identities
gen-erally above 80%, except for NarG2 and NosZ of H. zavarzinii
(maximum of 69% identity in both cases) (see Fig. S1 in the
sup-plemental material).
Effect of nitrate and NaCl on bacterial growth and
denitrifi-cation activity. The three Hyphomicrobium species cultivated
un-der aerobic conditions with or without the addition of 14.3 mM
NaNO
3showed similar growth curves. No nitrate reduction or
nitrite production was detected under these conditions (data not
shown). When incubated under denitrifying conditions at the
same nitrate concentration, the three Hyphomicrobium species
had the capacity to grow and to completely eliminate nitrate
with-out nitrite accumulation, although growth was much slower than
that under aerobic conditions (Fig. 2). The addition of acetylene
led to the accumulation of N
2O in the headspace of the vials, while
no (H. nitrativorans) or less (H. denitrificans and H. zavarzinii)
N
2O accumulation was observed in cultures incubated without
FIG 1 Venn diagram illustrating the number of orthologs found across the
three species. Numbers in the nonsharing zones represent unique genes with no homology to sequences in the other two species. Percentages of unique genes that were identified as encoding a HP (hypothetical protein with un-known function) are illustrated. In the shared zones, only genes that resulted from reciprocal analysis (e.g., H. nitrativorans versus H. denitrificans and H. denitrificans versus H. nitrativorans) were considered.
TABLE 3 Gene clusters associated with the dissimilatory pathway of denitrification
Reductase
Associated gene cluster(s) (locus tags) H. nitrativorans (GenBank accession no.
CP006912)
H. zavarzinii (GenBank accession no.
NZ_ARTG01000000)
H. denitrificans (GenBank accession no.CP002083)
Nar NP narK12f-narGHJI (nar-1)
(F812RS0121405 to F812RS0121425) narK12f-narGHJI (Hden0925 to Hden0929) narK1-narK2-narGHJI (nar-2) (F812RS24645, F812RS24650, F812RS0118690 to F812RS0118710) Nap napEFDABC-napGH (W91113865 to W91113890, W91102520 to W91102525) napDABC-napGH (F812RS0114960 to F812RS0114975, F812RS0108875 to F812RS0108880) NPa
Nir nirK-nirV-nnrR (W91113050 to W91113060) nirK-nirV-nnrR (F812RS0115595 to F812RS0115605)
nirK-nnrS (Hden0590 and Hden0591)
Nor nnrS-cnorCBQDE (W91107415 to W91107440) cnorCBQDE (F812RS0108785 to
F812RS0108805)
cnorE-cnorCBQD (Hden0580 to Hden0584)
Nos nosRZDFYLX (W91108030 to W91108060) nnrS-nosRZDFYLX (F812RS24275 to
F812RS24285, F812RS0116365 to F812RS0116390)
nosRZDFYLX (Hden1877 to Hden1883)
acetylene (Fig. 3), indicating that the three species can achieve
complete denitrification.
The effect of increasing nitrate concentrations on the growth
and denitrification kinetics of the three Hyphomicrobium species
was assessed under denitrifying conditions, with the NaNO
3con-centration ranging from 14.3 to 107 mM (200 to 1,500 mg NO
3-N/liter) (Fig. 2). H. nitrativorans had the capacity to grow (Fig. 2A)
and denitrify without significant nitrite accumulation (Fig. 2D) at
all of the concentrations of NaNO
3tested, with optimal growth at
71.4 mM NaNO
3. In contrast, growth and denitrification by H.
denitrificans and H. zavarzinii were almost completely inhibited
at 107 mM NaNO
3(Fig. 2B,
C,
E, and
F). For H. denitrificans and
H. zavarzinii, optimal growth and denitrification were observed at
42.8 mM NaNO
3, although higher levels of nitrite were
con-stantly detected in cultures of H. denitrificans. While these higher
levels of nitrite were transient at initial concentrations of 14.3 and
42.8 mM NaNO
3in H. denitrificans, nitrite accumulation leading
to incomplete denitrification was detected at 71.4 mM NaNO
3(Fig. 2E).
Because H. nitrativorans was isolated from a marine
environ-FIG 2 Effect of nitrate concentration on growth and denitrification. H. nitrativorans (A and D), H. denitrificans (B and E), and H. zavarzinii (C and F) werecultured in triplicate under denitrifying conditions with an initial concentration of 14.3 mM (diamonds), 42.8 mM (squares), 71.4 mM (triangles), or 107 mM (crosses) NaNO3. At regular intervals, growth (A to C) and nitrate and nitrite concentrations (D to F) were measured. In panels D to F, full lines indicate nitrate
concentrations, and dotted lines indicate nitrite (NOx) concentrations. Assays were performed with an NaCl concentration of 0.5% in the growth medium. The standard deviations of the means for each time point are presented.
ment, tolerance to increasing NaCl concentrations ranging from 0
to 2% NaCl was assessed under denitrifying conditions for the
three species. Growth of and denitrification by H. nitrativorans
were detected at all of the NaCl concentrations tested, without
nitrite accumulation, although a concentration of 2% led to
slower growth and denitrification (Fig. 4A
and
D). Increasing
NaCl concentrations ranging from 0 to 1% led to delayed growth
and denitrification in H. denitrificans (Fig. 4B
and
E) and slower
growth and denitrification in H. zavarzinii (Fig. 4C
and
F). A
transient accumulation of nitrite was also observed in H.
denitri-ficans cultures. At 2% NaCl, these two species showed poor or no
growth and no denitrifying activity.
To further evaluate whether the interaction between nitrate
and NaCl could lead to significant differences in growth and
denitrification rates in the three Hyphomicrobium species, we
carried out a factorial experiment using two different
concentra-tions of each of the two factors in question. Growth and
denitri-fication were assessed at 14.3 and 71.4 mM NaNO
3and at 0 and
0.5% NaCl (Table 4). The results showed that the three species
responded differently to variations of nitrate and NaCl levels.
While no significant interactions between the nitrate and NaCl
concentrations were detected for H. nitrativorans and H.
denitri-ficans, significant interactions between these two factors were
de-tected for the growth rate and the denitrification rate in H.
zavar-zinii (Table 4). Single-factor analysis of the data subsets showed
that growth and denitrification rates in H. zavarzinii were
nega-tively affected by higher nitrate and NaCl concentrations, with the
lowest rates being detected at 71.4 mM NaNO
3and 0.5% NaCl
(Tables 5
and
6). In H. nitrativorans, while nitrate and NaCl had
no significant effect on the growth rate, a significant effect of both
factors on the denitrification rate was detected, with higher values
being observed at higher nitrate and NaCl concentrations (Tables
5
and
6). In contrast, neither of the two factors had a significant
effect on the denitrification rate in H. denitrificans (Table 6), but
the nitrate concentration had a significant effect on the growth
rate, with a considerably lower value at 71.4 mM NaNO
3than at
14.3 mM NaNO
3(Table 5).
Effect of nitrate, NaCl, and oxygen on relative gene
expres-sion levels of the nitrate and nitrite reductase genes. Our results
showed the influence of nitrate and NaCl on the growth and
deni-trification of the three Hyphomicrobium species. The effects of
these parameters were also assessed at the nitrate and nitrite
re-ductase gene expression levels. We focused our analysis on these
genes because the three species differ greatly in their nitrate
reduc-tases; H. denitrificans also harbors a very distinct nitrite reductase,
while NO and N
2O reductases found in the three species are more
similar.
The three Hyphomicrobium species were cultured under the
following denitrifying conditions: (i) 14.3 mM NaNO
3and 0%
NaCl, (ii) 71.4 mM NaNO
3and 0% NaCl, (iii) 14.3 mM NaNO
3and 0.5% NaCl, and (iv) 71.4 mM NaNO
3and 0.5% NaCl.
Rela-tive expression levels of the napA, narG, and nirK genes were
mea-sured during the mid-exponential growth phase, with cultures
grown in 14.3 mM NaNO
3and 0% NaCl as the reference culture
(Fig. 5A
to
C). In H. nitrativorans, higher nitrate and NaCl
con-centrations led to a small (1.4- to 3.4-fold) but significant increase
in the relative gene expression levels of napA and nirK (Fig. 5A). In
H. denitrificans, a significant effect was observed exclusively for
relative gene expression levels of nirK in cultures grown with 71.4
mM NaNO
3and 0% NaCl (5.8-fold increase) (Fig. 5B). In H.
zavarzinii, the nitrate and NaCl concentrations affected the three
nitrate reductase genes to different degrees. The relative gene
ex-pression level of napA did not change under any of the conditions
tested. Both factors had a negative effect on narG1 gene expression
but a positive effect on narG2 gene expression (Fig. 5C). Similar to
narG1, the relative gene expression level of nirK in H. zavarzinii
was negatively affected by higher nitrate and NaCl concentrations.
Oxygen is also known to have a major effect on denitrification
and the denitrification reductases. The three Hyphomicrobium
species were cultured under aerobic conditions, under aerobic
conditions with 14.3 mM NaNO
3, or under denitrifying
condi-tions with 14.3 mM NaNO
3. The relative expression levels of the
napA, narG, and nirK genes were measured as described above,
with the culture grown aerobic conditions set as the reference
culture (Fig. 5D
and
E). In H. nitrativorans, the addition of nitrate
to aerobic cultures led to small but significant increases in the
relative gene expression levels of napA and nirK (1.8- and 3.2-fold,
respectively), while incubation under denitrifying conditions led
to much higher relative gene expression levels for both genes
(7.1-and 35.1-fold, respectively) (Fig. 5D). In H. denitrificans, the only
difference observed was for the relative gene expression level of
narG, which was significantly higher in the presence of nitrate
under aerobic conditions (Fig. 5E). In H. zavarzinii, none of the
genes tested was significantly affected by the addition of nitrate to
aerobic cultures (Fig. 5F). However, the incubation of this
bacte-rial species under denitrifying conditions led to a strong increase
in the relative gene expression level of narG1 (36.4-fold), a slight
but significant increase in the level of narG2 (1.8-fold), and a
significant decrease in the level of napA (⫺8.3-fold) (Fig. 5F).
DISCUSSION
H. nitrativorans, H. denitrificans, and H. zavarzinii possess genes
encoding the full set of enzymes required to perform complete
denitrification, and they were able to achieve this process. Under
the culture conditions tested, H. nitrativorans was found to be the
most efficient of the three Hyphomicrobium species evaluated.
Compared to the two other species, it has the capacity to denitrify
FIG 3 Effect of acetylene on the production of N2O. H. nitrativorans(tri-angles), H. denitrificans (squares), and H. zavarzinii (circles) were cultured in triplicate under denitrifying conditions with (full lines) or without (dotted lines) acetylene at an initial concentration of 14.3 mM NaNO3. At regular
at high nitrate concentrations, without nitrite accumulation.
Consistent with this observation, an increase in the nitrate
con-centration in the growth medium induced significant increases in
narG and nirK relative gene expression levels in H. nitrativorans.
In contrast, an increase of the initial nitrate concentration in the
growth medium led to nitrite accumulation in H. denitrificans
cultures despite a significant increase in the nirK relative gene
expression level at a higher nitrate concentration. Nitrate
inhibi-tion of nitrite reducinhibi-tion was previously reported for several
bac-teria (42–44) and has been associated with a phenomenon of
com-petition between nitrate and nitrite reductases for electron
donors. These results suggest that in H. denitrificans, the nitrate
reductase might have a higher affinity for electrons than the nitrite
reductase. H. denitrificans is characterized by its unique nitrite
re-FIG 4 Effect of NaCl concentration on growth and denitrification. H. nitrativorans (A and D), H. denitrificans (B and E), and H. zavarzinii (C and F) werecultured in triplicate under denitrifying conditions with 0% (diamonds), 0.5% (squares), 1% (triangles), and 2% (crosses) NaCl. At regular intervals, growth (A to C) and nitrate and nitrite (NOx) concentrations (D to F) were measured. In panels D to F, full lines indicate nitrate concentrations, and dotted lines indicate nitrite concentrations. Standard deviations of the means for each time point are presented.
ductase, which is clearly distinct from the nitrite reductases found
in other Hyphomicrobium species. It is characterized by the
pres-ence of two type I Cu sites, as opposed to the single type I Cu site
found in the nitrite reductases of most bacteria (16,
17,
45). The
role of this second type I Cu site has not been elucidated yet.
Currently, the role of this distinct nitrite reductase in the
denitri-fying capacity of H. denitrificans is unknown, but it might be
linked to the nitrite accumulation observed in H. denitrificans
cul-tures. Growth of H. denitrificans and H. zavarzinii was totally
in-hibited at the highest nitrate concentration tested. Because nitrate
was supplied as NaNO
3, it is possible that this growth inhibition
was exacerbated by the input of sodium in the growth medium, as
previously observed for Shewanella oneidensis cultures (46).
As expected, H. nitrativorans also demonstrated better
toler-ance to NaCl than the two other Hyphomicrobium species tested
and showed small but significant increases in the napA and nirK
relative gene expression levels when NaCl was added to the growth
medium. More surprisingly, H. nitrativorans showed better
toler-ance to NaCl when cultured under denitrifying conditions than
previously reported for aerobic growth. Indeed, while total growth
inhibition at NaCl concentrations of
⬎1% was previously
re-ported for H. nitrativorans under aerobic conditions (21), our
results demonstrate growth and complete denitrification by this
bacterium at NaCl concentrations of up to 2%. The mechanisms
of this enhanced tolerance to NaCl could be associated with the
multisubunit Na
⫹/H
⫹antiporter. A gene cluster encoding this
type of antiporter was found in the H. nitrativorans genome,
whereas genes encoding an NhaA-type Na
⫹/H
⫹antiporter were
found in the genomes of the two other species. The multisubunit
Na
⫹/H
⫹antiporter has been associated with high Na
⫹extrusion
activity in halotolerant Staphylococcus aureus (47). Despite having
better NaCl tolerance than the other Hyphomicrobium species, H.
nitrativorans remains quite sensitive to NaCl compared to other
bacteria isolated from denitrifying biofilms, such as
Methyl-ophaga nitratireducenticrescens JAM1, which can tolerate NaCl
concentrations of up to 8% (24). We hypothesize that H.
nitrativ-orans benefits from the osmoprotection of other bacteria, such as
M. nitratireducenticrescens JAM1, to thrive in the artificial
seawa-ter of the Biodome aquarium (NaCl concentration of 2.4%). This
hypothesis is currently being studied in our laboratory.
The detailed comparison of the H. nitrativorans, H.
denitrifi-cans, and H. zavarzinii genomes has highlighted the facts that a
large number of orthologous genes are shared among these three
species and that very few genes with known functions are unique
to a single species. From this perspective, the fact that the three
species differ greatly in their nitrate reductases is noteworthy, and
it can be hypothesized that the differences observed in their
deni-trification capacities reflect these variations observed at the
ge-netic level. Indeed, while H. nitrativorans and H. denitrificans are
characterized by the presence of a single Nap or Nar gene cluster,
respectively, one Nap and two Nar gene clusters have been
iden-tified in the genome of H. zavarzinii. Such an occurrence of
mul-tiple operons encoding nitrate reductases has previously been
reported for other microorganisms. One well-characterized
ex-ample is E. coli K-12, which also expresses two different
cytoplas-mic membrane nitrate reductases (NRA and NRZ), encoded by
narGHJI and narZYWV, respectively, and one periplasmic nitrate
reductase, encoded by napFDAGHBC (48–50). Gene deletions in
E. coli K-12 indicate that Nap can support anaerobic growth when
it is the only nitrate reductase available, although NRA is clearly
the main enzyme responsible for nitrate reduction when all
en-zymes are present (48).
While Nap in E. coli is expressed under anaerobic conditions
(50) and is specifically involved in nitrate reduction at low nitrate
concentrations (48,
51), different functions have been proposed
for the Nap system in other bacteria. In Paracoccus spp., in which
both the Nar and Nap systems are present, Nar is expressed under
anaerobic conditions, while Nap is expressed during aerobic
TABLE 4 Factorial ANOVA of the effects of nitrate and NaCl concentrations on growth and denitrification ratesaSource of variation
P value
H. nitrativorans H. denitrificans H. zavarzinii
Growth rate
Denitrification
rate Growth rate
Denitrification
rate Growth rate
Denitrification rate
Nitrate NS 0.0041 0.0042 NS ⬍0.001 ⬍0.001
NaCl NS 0.0178 NS NS ⬍0.001 ⬍0.001
Nitrate⫹ NaCl NS NS NS NS 0.0145 0.0087
aThe nitrate concentrations tested were 14.3 and 71.4 mM NaNO
3; the NaCl concentrations tested were 0 and 0.5%. P values of⬍0.05 are considered statistically significant. NS,
not significant.
TABLE 5 Effect of nitrate and NaCl concentrations on growth rates of three Hyphomicrobium speciesa
NaNO3concn (mM)
Growth rate (OD units h⫺1)
H. nitrativorans H. denitrificans H. zavarzinii
0% NaCl 0.5% NaCl Mean 0% NaCl 0.5% NaCl Mean 0% NaCl 0.5% NaCl Mean
14.3 0.00206 0.00249 0.00228 0.00325 0.00277 0.00301a 0.00357Aa 0.00287Ba NA
71.4 0.00220 0.00225 0.00223 0.00234 0.00228 0.00231b 0.00291Ab 0.00138Bb NA
Mean 0.00213 0.00237 0.00280 0.00253 NA NA
a
Uppercase letters indicate significant differences between columns according to Tukey’s test; lowercase letters indicate significant differences between rows according to Tukey’s test. NA, not applicable.
growth, in the presence or absence of nitrate (13,
52,
53). This
expression pattern is similar to our results for H. zavarzinii, with
growth under denitrifying conditions leading to the repression of
napA and the overexpression of narG1 and, to a lesser extent,
narG2. In Paracoccus spp., Nap is responsible for aerobic nitrate
reduction, and it has been suggested that this activity might help
dissipate excess reductant, which is further supported by the fact
that Nap is induced by growth on highly reduced carbon
sub-TABLE 6 Effect of nitrate and NaCl concentrations on denitrification rates of three Hyphomicrobium speciesaNaNO3concn (mM)
Denitrification rate (mM h⫺1)
H. nitrativorans H. denitrificans H. zavarzinii
0% NaCl 0.5% NaCl Mean 0% NaCl 0.5% NaCl Mean 0% NaCl 0.5% NaCl Mean
14.3 0.121 0.174 0.148b 0.126 0.114 0.120 0.280Aa 0.220Ba NA
71.4 0.186 0.204 0.196a 0.117 0.140 0.129 0.166Ab 0.123Bb NA
Mean 0.154A 0.189A 0.122 0.127 NA NA
a
Uppercase letters indicate significant differences between columns according to Tukey’s test; lowercase letters indicate significant differences between rows according to Tukey’s test. NA, not applicable.
FIG 5 Relative expression levels of the nitrate and nitrite reductase genes in the three species cultured under different conditions. (A to C) Effects of nitrate and
NaCl concentrations. The three species were cultured in triplicate under denitrifying conditions with 14.3 mM NaNO3and 0% NaCl (reference cultures are
represented by the dashed line set at 1 in each panel), with 71.4 mM NaNO3and 0% NaCl, with 14.3 mM NaNO3and 0.5% NaCl, or with 71.4 mM NaNO3and
0.5% NaCl. (D and E) Effects of oxygen. The three species were cultured in triplicate under aerobic conditions (reference cultures are represented by the dashed line set at 1 in each panel), aerobic conditions with 14.3 mM NaNO3, or denitrifying conditions with 14.3 mM NaNO3. Aerobic precultures for this assay were
strates (13,
52). Despite higher levels of Nap expression under
aerobic conditions than under denitrifying conditions, we did not
detect significant nitrate reduction in aerobic liquid cultures of H.
zavarzinii. Similarly, the expression level of the Nap-␣ operon in
Rhodobacter sphaeroides 2.4.3 was higher in aerobic liquid cultures
than in anaerobic cultures, without any detectable nitrate
reduc-tion (54). However, aerobic reducreduc-tion of nitrate into nitrite
oc-curred when R. sphaeroides 2.4.3 was cultivated on solid medium,
indicating a role of Nap-
␣ in redox homeostasis specific for these
culture conditions. Preliminary assays performed in our
labora-tory indicated that this is not the case for H. zavarzinii, but more
extensive work will have to be performed to rule out this
hypoth-esis.
While it is not uncommon to find multiple nitrate reductases
in a single bacterium, the presence of multiple nitrate reductases
of the same type has been reported only rarely in previous studies.
Rhodobacter sphaeroides 2.4.3 possesses two Nap operons, one,
identified as Nap-␣, being similar to Nap operons found in other
Alphaproteobacteria (napKEFDABC) and the other, identified as
Nap-
, being similar to the Nap operons found in
Gammaproteo-bacteria (napFDAGHBC) such as Shewanella spp. and E. coli (54).
These two distinct Nap isoforms have also been reported for
sev-eral strains of Shewanella (55,
56). Recently, we also described the
new bacterial species Methylophaga nitratireducenticrescens JAM1
(Gammaproteobacteria), which expresses two distinct Nar nitrate
reductases (Nar1 and Nar2) encoded by two narGHJI operons
(23,
24,
57). For this bacterium, phylogenetic analyses revealed
that Nar1 is more closely related to the Nar system of
Betaproteo-bacteria, whereas Nar2 is more closely related to the Nar system
found in other Gammaproteobacteria, suggesting that the Nar1
system was acquired by horizontal gene transfer (23). In H.
zavar-zinii, while narG1 is closely related to narG sequences found in
other Alphaproteobacteria, narG2 is only distantly related to any
known narG sequence. The expression patterns of these two genes
were also slightly different, with a much stronger effect of
anaer-obic conditions on the expression of narG1 than on the expression
of narG2. Further work, including the production of gene
knock-out mutants for the different nitrate reductases in H. zavarzinii, is
necessary to completely elucidate the physiological roles played by
these enzymes.
Although the napA gene product in H. nitrativorans is more
related to Nap-
␣ than to Nap- of Rhodobacter sphaeroides 2.4.3,
a distinct napA expression pattern was observed. In H.
nitrativ-orans, napA gene expression levels were significantly higher in the
presence of nitrate and under denitrifying conditions than in the
absence of nitrate and under aerobic conditions. Similar results
have been reported for Bradyrhizobium japonicum, which also
possesses a single periplasmic nitrate reductase of the
␣ isoform
(58). Although results from studies on Paracoccus pantotrophus
and Rhodobacter sphaeroides point toward a specific role of the
Nap-
␣ isoform in aerobic denitrification and redox balancing,
both the
␣ and  isoforms have been associated with anaerobic
nitrate respiration in Shewanella spp. (55,
56). It is important to
note that the highest denitrification efficiencies were observed for
a Shewanella strain lacking the nap- operon (55) and for a nap-
mutant Shewanella strain (56), indicating that the
␣ isoform plays
a major role in anaerobic respiration in this bacterial genus. Taken
together, these results further illustrate that there is no clear
asso-ciation between the isoform and the physiological role of Nap and
that other factors, such as the presence of distinct enzymes with
similar functions, might also play an important role.
Denitrifying conditions were shown to increase the relative
gene expression level of nirK in H. nitrativorans. However, such an
effect was not observed for H. denitrificans and H. zavarzinii. No
previous studies assessed quantitatively the expression of nirK
un-der different culture conditions in Hyphomicrobium spp.
Mi-croaerobic or anaerobic conditions are known to regulate nirK
expression in many bacterial species (59–61). In Rhodobacter
sphaeroides 2.4.3, nirK expression is regulated by NnrR, a
tran-scriptional activator of the CRP/FNR family (60,
62). Gene
anno-tation of the H. denitrificans genome did not reveal sequences
closely related to nnrR, which could explain the absence of
regu-lation of nirK expression. The lack of an effect of denitrifying
conditions on H. zavarzinii is surprising, as nnrR was found
downstream of nirK. In fact, H. zavarzinii and H. nitrativorans
have the same gene arrangement in the nirK locus (Table 3), and
both showed a potential NnrR binding site (data not shown).
Fur-ther work will be required in order to elucidate this phenomenon.
ACKNOWLEDGMENTS
We thank Karla Vasquez for her technical assistance.
This project was financially supported by a grant to R.V. from the Natural Sciences and Engineering Research Council of Canada and by scholarships to C.M. from the Fondation Universitaire Armand-Frappier and the Fonds de Recherche du Québec Nature et Technologies. REFERENCES
1. Gliesche CG, Fesefeldt A, Hirsch P. 2005. Genus Hyphomicrobium Stutzer and Hartleb 1898, 76AL, p 476 – 494. In Staley JT, Bryant MP,
Pfennig N, Holt JG (ed), Bergey’s manual of systematic bacteriology. Wil-liams & Wilkins, Baltimore, MD.
2. Fesefeldt A, Kloos K, Bothe H, Lemmer H, Gliesche CG. 1998. Distri-bution of denitrification and nitrogen fixation genes in Hyphomicrobium spp. and other budding bacteria. Can J Microbiol 44:181–186.http://dx .doi.org/10.1139/w97-139.
3. Kloos K, Fesefeldt A, Gliesche CG, Bothe H. 1995. DNA-probing indi-cates the occurrence of denitrification and nitrogen fixation genes in Hy-phomicrobium. Distribution of denitrifying and nitrogen fixing isolates of Hyphomicrobium in a sewage treatment plant. FEMS Microbiol Ecol 18: 205–213.http://dx.doi.org/10.1111/j.1574-6941.1995.tb00177.x. 4. Timmermans P, Van Haute A. 1983. Denitrification with methanol:
fundamental study of the growth and denitrification capacity of Hypho-microbium sp. Water Res 17:1249 –1255.http://dx.doi.org/10.1016/0043 -1354(83)90249-X.
5. Urakami T, Sasaki J, Suzuki K-I, Komagata K. 1995. Characterization and description of Hyphomicrobium denitrificans sp. nov. Int J Syst Bacte-riol 45:528 –532.http://dx.doi.org/10.1099/00207713-45-3-528. 6. Harder W, Attwood MM. 1978. Biology, physiology and biochemistry of
Hyphomicrobia. Adv Microb Physiol 17:303–359. http://dx.doi.org/10 .1016/S0065-2911(08)60060-0.
7. Baytshtok V, Lu H, Park H, Kim S, Yu R, Chandran K. 2009. Impact of varying electron donors on the molecular microbial ecology and biokinet-ics of methylotrophic denitrifying bacteria. Biotechnol Bioeng 102:1527– 1536.http://dx.doi.org/10.1002/bit.22213.
8. Satoh H, Yamakawa T, Kindaichi T, Ito T, Okabe S. 2006. Community structures and activities of nitrifying and denitrifying bacteria in industrial wastewater-treating biofilms. Biotechnol Bioeng 94:762–772.http://dx .doi.org/10.1002/bit.20894.
9. Isaka K, Kimura Y, Osaka T, Tsuneda S. 2012. High-rate denitrification using polyethylene glycol gel carriers entrapping heterotrophic denitrify-ing bacteria. Water Res 46:4941– 4948.http://dx.doi.org/10.1016/j.watres .2012.05.050.
10. Baytshtok V, Kim S, Yu R, Park H, Chandran K. 2008. Molecular and biokinetic characterization of methylotrophic denitrification using nitrate and nitrite as terminal electron acceptors. Water Sci Technol 58(2):359 – 365.http://dx.doi.org/10.2166/wst.2008.391.
11. Knowles R. 1982. Denitrification. Microbiol Rev 46:43–70.
12. Philippot L. 2002. Denitrifying genes in bacterial and archaeal genomes. Biochim Biophys Acta 1577:355–376.http://dx.doi.org/10.1016/S0167-4 781(02)00420-7.
13. Richardson DJ, Berks BC, Russell DA, Spiro S, Taylor CJ. 2001. Func-tional, biochemical and genetic diversity of prokaryotic nitrate reductases. Cell Mol Life Sci 58:165–178.http://dx.doi.org/10.1007/PL00000845. 14. Kraft B, Strous M, Tegetmeyer HE. 2011. Microbial nitrate respiration—
genes, enzymes and environmental distribution. J Biotechnol 155:104 – 117.http://dx.doi.org/10.1016/j.jbiotec.2010.12.025.
15. Deligeer, Fukunaga R, Kataoka K, Yamaguchi K, Kobayashi K,
Tagawa S, Suzuki S. 2002. Spectroscopic and functional
characteriza-tion of Cu-containing nitrite reductase from Hyphomicrobium denitri-ficans A3151. J Inorg Biochem 91:132–138.http://dx.doi.org/10.1016/ S0162-0134(02)00442-7.
16. Yamaguchi K, Kataoka K, Kobayashi M, Itoh K, Fukui A, Suzuki S. 2004. Characterization of two type 1 Cu sites of Hyphomicrobium denitri-ficans nitrite reductase: a new class of copper-containing nitrite reducta-ses. Biochemistry 43:14180 –14188.http://dx.doi.org/10.1021/bi0492657. 17. Nojiri M, Xie Y, Inoue T, Yamamoto T, Matsumura H, Kataoka K,
Deligeer, Yamaguchi K, Kai Y, Suzuki S. 2007. Structure and function of
a hexameric copper-containing nitrite reductase. Proc Natl Acad Sci U S A 104:4315– 4320.http://dx.doi.org/10.1073/pnas.0609195104. 18. Yamaguchi K, Kawamura A, Ogawa H, Suzuki S. 2003. Characterization
of nitrous oxide reductase from a methylotrophic denitrifying bacterium, Hyphomicrobium denitrificans A3151. J Biochem 134:853– 858.http://dx .doi.org/10.1093/jb/mvg211.
19. Jérôme V, Hermann M, Hilbrig F, Freitag R. 2007. Development of a fed-batch process for the production of a dye-linked formaldehyde dehy-drogenase in Hyphomicrobium zavarzinii ZV 580. Appl Microbiol Bio-technol 77:779 –788.http://dx.doi.org/10.1007/s00253-007-1218-z. 20. Klein CR, Kesseler FP, Perrei C, Frank J, Duine JA, Schwartz AC. 1994.
A novel dye-linked formaldehyde dehydrogenase with some properties indicating the presence of a protein-bound redox-active quinone cofactor. Biochem J 301:289 –295.
21. Martineau C, Villeneuve C, Mauffrey F, Villemur R. 2013. Hyphomi-crobium nitrativorans sp. nov., isolated from the biofilm of a methanol-fed denitrification system treating seawater at the Montreal Biodome (Can-ada). Int J Syst Evol Microbiol 63:3777–3781.http://dx.doi.org/10.1099 /ijs.0.048124-0.
22. Martineau C, Villeneuve C, Mauffrey F, Villemur R. 2014. Complete genome sequence of Hyphomicrobium nitrativorans strain NL23, a deni-trifying bacterium isolated from biofilm of a methanol-fed denitrification system treating seawater at the Montreal Biodome. Genome Announc
2(1):e01165-13http://dx.doi.org/10.1128/genomeA.01165-13.
23. Auclair J, Lepine F, Parent S, Villemur R. 2010. Dissimilatory reduction of nitrate in seawater by a Methylophaga strain containing two highly divergent narG sequences. ISME J 4:1302–1313.http://dx.doi.org/10.1038 /ismej.2010.47.
24. Villeneuve C, Martineau C, Mauffrey F, Villemur R. 2013. Methyl-ophaga nitratireducenticrescens sp. nov. and MethylMethyl-ophaga frappieri sp. nov., isolated from the biofilm of the methanol-fed denitrification system treating the seawater at the Montreal Biodome. Int J Syst Evol Microbiol
63:2216 –2222.http://dx.doi.org/10.1099/ijs.0.044545-0.
25. Brown PJB, Kysela DT, Buechlein A, Hemmerich C, Brun YV. 2011. Genome sequences of eight morphologically diverse alphaproteobacteria. J Bacteriol 193:4567– 4568.http://dx.doi.org/10.1128/JB.05453-11. 26. Aziz R, Bartels D, Best A, DeJongh M, Disz T, Edwards R, Formsma K,
Gerdes S, Glass E, Kubal M, Meyer F, Olsen G, Olson R, Osterman A, Overbeek R, McNeil L, Paarmann D, Paczian T, Parrello B, Pusch G, Reich C, Stevens R, Vassieva O, Vonstein V, Wilke A, Zagnitko O. 2008.
The RAST server: rapid annotations using subsystems technology. BMC Genomics 9:75.http://dx.doi.org/10.1186/1471-2164-9-75.
27. Overbeek R, Olson R, Pusch GD, Olsen GJ, Davis JJ, Disz T, Edwards
RA, Gerdes S, Parrello B, Shukla M, Vonstein V, Wattam AR, Xia F, Stevens R. 2014. The SEED and the Rapid Annotation of Microbial
Ge-nomes Using Subsystems Technology (RAST). Nucleic Acids Res 42: D206 –D214.http://dx.doi.org/10.1093/nar/gkt1226.
28. Markowitz VM, Chen I-MA, Palaniappan K, Chu K, Szeto E, Pillay M,
Ratner A, Huang J, Woyke T, Huntemann M, Anderson I, Billis K, Varghese N, Mavromatis K, Pati A, Ivanova NN, Kyrpides NC. 2014.
IMG 4 version of the integrated microbial genomes comparative analysis
system. Nucleic Acids Res 42:D560 –D567.http://dx.doi.org/10.1093/nar /gkt963.
29. Darling AE, Mau B, Perna NT. 2010. progressiveMauve: multiple ge-nome alignment with gene gain, loss and rearrangement. PLoS One
5:e11147http://dx.doi.org/10.1371/journal.pone.0011147.
30. Saitou N, Nei M. 1987. The neighbor-joining method: a new method for reconstructing phylogenetic trees. Mol Biol Evol 4:406 – 425.
31. Tamura K, Stecher G, Peterson D, Filipski A, Kumar S. 2013. MEGA6: Molecular Evolutionary Genetics Analysis version 6.0. Mol Biol Evol 30: 2725–2729.http://dx.doi.org/10.1093/molbev/mst197.
32. Atlas RM. 2010. Handbook of microbiological media, 4th ed, vol 1, p 769 – 868. CRC Press, Boca Raton, FL.
33. Yoshinari T, Knowles R. 1976. Acetylene inhibition of nitrous oxide reduction by denitrifying bacteria. Biochem Biophys Res Commun 69: 705–710.http://dx.doi.org/10.1016/0006-291X(76)90932-3.
34. Rozen S, Skaletsky H. 1999. Primer3 on the WWW for general users and for biologist programmers, p 365–386. In Misener S, Krawetz S (ed), Bioinformatics methods and protocols, vol 132. Humana Press, Totowa, NJ.
35. Untergasser A, Nijveen H, Rao X, Bisseling T, Geurts R, Leunissen
JAM. 2007. Primer3Plus, an enhanced Web interface to Primer3. Nucleic
Acids Res 35:W71–W74.http://dx.doi.org/10.1093/nar/gkm306. 36. Livak KJ, Schmittgen TD. 2001. Analysis of relative gene expression data
using real-time quantitative PCR and the 2-⌬⌬Ctmethod. Methods 25: 402– 408.http://dx.doi.org/10.1006/meth.2001.1262.
37. Vandesompele J, De Preter K, Pattyn F, Poppe B, Van Roy N, De Paepe
A, Speleman F. 2002. Accurate normalization of real-time quantitative
RT-PCR data by geometric averaging of multiple internal control genes. Genome Biol 3:RESEARCH0034.http://dx.doi.org/10.1186/gb-2002-3-7 -research0034.
38. Andersen CL, Jensen JL, Orntoft TF. 2004. Normalization of real-time quantitative reverse transcription-PCR data: a model-based variance esti-mation approach to identify genes suited for normalization, applied to bladder and colon cancer data sets. Cancer Res 64:5245–5250.http://dx .doi.org/10.1158/0008-5472.CAN-04-0496.
39. Pfaffl MW, Tichopad A, Prgomet C, Neuvians TP. 2004. Determination of stable housekeeping genes, differentially regulated target genes and sample integrity: BestKeeper—Excel-based tool using pair-wise correla-tions. Biotechnol Lett 26:509 –515.http://dx.doi.org/10.1023/B:BILE.000 0019559.84305.47.
40. Silver N, Best S, Jiang J, Thein SL. 2006. Selection of housekeeping genes for gene expression studies in human reticulocytes using real-time PCR. BMC Mol Biol 7:33.http://dx.doi.org/10.1186/1471-2199-7-33. 41. Goddard AD, Moir JWB, Richardson DJ, Ferguson SJ. 2008.
Inter-dependence of two NarK domains in a fused nitrate/nitrite transporter. Mol Microbiol 70:667– 681. http://dx.doi.org/10.1111/j.1365-2958 .2008.06436.x.
42. Polcyn W, Lucin´ski R. 2003. Aerobic and anaerobic nitrate and nitrite reduction in free-living cells of Bradyrhizobium sp. (Lupinus). FEMS Microbiol Lett 226:331–337.http://dx.doi.org/10.1016/S0378-1097(03)0 0620-7.
43. Almeida JS, Reis MAM, Carrondo MJT. 1995. Competition between nitrate and nitrite reduction in denitrification by Pseudomonas fluorescens. Biotechnol Bioeng 46:476 – 484.http://dx.doi.org/10.1002/bit.260460512. 44. Kornaros M, Zafiri C, Lyberatos G. 1996. Kinetics of denitrification by Pseudomonas denitrificans under growth conditions limited by carbon and/or nitrate or nitrite. Water Environ Res 68:934 –945.http://dx.doi.org /10.2175/106143096X127947.
45. Ellis MJ, Grossmann JG, Eady RR, Hasnain SS. 2007. Genomic analysis reveals widespread occurrence of new classes of copper nitrite reductases. J Biol Inorg Chem 12:1119 –1127.http://dx.doi.org/10.1007/s00775-007 -0282-2.
46. Zhang H, Fu H, Wang J, Sun L, Jiang Y, Zhang L, Gao H. 2013. Impacts of nitrate and nitrite on physiology of Shewanella oneidensis. PLoS One
8:e62629.http://dx.doi.org/10.1371/journal.pone.0062629.
47. Hiramatsu T, Kodama K, Kuroda T, Mizushima T, Tsuchiya T. 1998. A putative multisubunit Na⫹/H⫹antiporter from Staphylococcus aureus. J Bacteriol 180:6642– 6648.
48. Stewart V, Lu Y, Darwin AJ. 2002. Periplasmic nitrate reductase (NapABC enzyme) supports anaerobic respiration by Escherichia coli K-12. J Bacteriol 184:1314 –1323.http://dx.doi.org/10.1128/JB.184.5.1314 -1323.2002.
Competition between Escherichia coli strains expressing either a periplas-mic or a membrane-bound nitrate reductase: does Nap confer a selective advantage during nitrate-limited growth? Biochem J 344:77– 84.http://dx .doi.org/10.1042/0264-6021:3440077.
50. Darwin AJ, Ziegelhoffer EC, Kiley PJ, Stewart V. 1998. Fnr, NarP, and NarL regulation of Escherichia coli K-12 napF (periplasmic nitrate reduc-tase) operon transcription in vitro. J Bacteriol 180:4192– 4198.
51. Wang H, Tseng C-P, Gunsalus RP. 1999. The napF and narG nitrate reductase operons in Escherichia coli are differentially expressed in re-sponse to submicromolar concentrations of nitrate but not nitrite. J Bac-teriol 181:5303–5308.
52. Bell LC, Richardson DJ, Ferguson SJ. 1990. Periplasmic and membrane-bound respiratory nitrate reductases in Thiosphaera pantotropha: the periplasmic enzyme catalyzes the first step in aerobic denitrification. FEBS Lett 265:85– 87.http://dx.doi.org/10.1016/0014-5793(90)80889-Q. 53. Sears HJ, Sawers G, Berks BC, Ferguson SJ, Richardson DJ. 2000.
Control of periplasmic nitrate reductase gene expression (napEDABC) from Paracoccus pantotrophus in response to oxygen and carbon sub-strates. Microbiology 146:2977–2985.
54. Hartsock A, Shapleigh JP. 2011. Physiological roles for two periplasmic nitrate reductases in Rhodobacter sphaeroides 2.4.3 (ATCC 17025). J Bac-teriol 193:6483– 6489.http://dx.doi.org/10.1128/JB.05324-11.
55. Simpson PJL, Richardson DJ, Codd R. 2010. The periplasmic nitrate reductase in Shewanella: the resolution, distribution and functional im-plications of two NAP isoforms, NapEDABC and NapDAGHB. Microbi-ology 156:302–312.http://dx.doi.org/10.1099/mic.0.034421-0.
56. Chen Y, Wang F, Xu J, Mehmood MA, Xiao X. 2011. Physiological and evolutionary studies of NAP systems in Shewanella piezotolerans WP3. ISME J 5:843– 855.http://dx.doi.org/10.1038/ismej.2010.182.
57. Villeneuve C, Martineau C, Mauffrey F, Villemur R. 2012. Complete genome sequences of Methylophaga sp. strain JAM1 and Methylophaga sp. strain JAM7. J Bacteriol 194:4126 – 4127. http://dx.doi.org/10.1128/JB .00726-12.
58. Delgado MJ, Bonnard N, Tresierra-Ayala A, Bedmar EJ, Müller P. 2003. The Bradyrhizobium japonicum napEDABC genes encoding the periplas-mic nitrate reductase are essential for nitrate respiration. Microbiology
149:3395–3403.http://dx.doi.org/10.1099/mic.0.26620-0.
59. Baek SH, Shapleigh JP. 2005. Expression of nitrite and nitric oxide re-ductases in free-living and plant-associated Agrobacterium tumefaciens C58 cells. Appl Environ Microbiol 71:4427– 4436.http://dx.doi.org/10 .1128/AEM.71.8.4427-4436.2005.
60. Tosques IE, Kwiatkowski AV, Shi J, Shapleigh JP. 1997. Characteriza-tion and regulaCharacteriza-tion of the gene encoding nitrite reductase in Rhodobacter sphaeroides 2.4.3. J Bacteriol 179:1090 –1095.
61. Velasco L, Mesa S, Delgado MJ, Bedmar EJ. 2001. Characterization of the nirK gene encoding the respiratory, Cu-containing nitrite reductase of Bradyrhizobium japonicum. Biochim Biophys Acta 1521:130 –134.http: //dx.doi.org/10.1016/S0167-4781(01)00279-2.
62. Laratta WP, Shapleigh JP. 2003. Site-directed mutagenesis of NnrR: a transcriptional regulator of nitrite and nitric oxide reductase in Rhodobac-ter sphaeroides. FEMS Microbiol Lett 229:173–178.http://dx.doi.org/10 .1016/S0378-1097(03)00821-8.