https://doi.org/10.4224/8913931
READ THESE TERMS AND CONDITIONS CAREFULLY BEFORE USING THIS WEBSITE.
https://nrc-publications.canada.ca/eng/copyright
Vous avez des questions? Nous pouvons vous aider. Pour communiquer directement avec un auteur, consultez la
première page de la revue dans laquelle son article a été publié afin de trouver ses coordonnées. Si vous n’arrivez pas à les repérer, communiquez avec nous à [email protected].
Questions? Contact the NRC Publications Archive team at
[email protected]. If you wish to email the authors directly, please see the first page of the publication for their contact information.
Archives des publications du CNRC
For the publisher’s version, please access the DOI link below./ Pour consulter la version de l’éditeur, utilisez le lien DOI ci-dessous.
Access and use of this website and the material on it are subject to the Terms and Conditions set forth at
Canadian human computer interaction research profile
Singer, Janice; Patrick, Andrew; Vinson, Norman
https://publications-cnrc.canada.ca/fra/droits
L’accès à ce site Web et l’utilisation de son contenu sont assujettis aux conditions présentées dans le site LISEZ CES CONDITIONS ATTENTIVEMENT AVANT D’UTILISER CE SITE WEB.
NRC Publications Record / Notice d'Archives des publications de CNRC:
https://nrc-publications.canada.ca/eng/view/object/?id=13263d0b-ce49-457c-969c-f2870a49d6a4 https://publications-cnrc.canada.ca/fra/voir/objet/?id=13263d0b-ce49-457c-969c-f2870a49d6a4
Research Profile
Prepared for: Institute for Information Technology, Human
Computer Interaction Program
Prepared by: Janice Singer, Ph.D., Andrew S. Patrick, Ph.D.,
Norman Vinson, Ph.D.
Survey created and data collected by: Ilona Posner
December 10, 2003
Executive Summary
In the spring of 2001, the HCI program of the Institute for Information Technology at the National Research Council Canada undertook a survey of Canada’s HCI research community. The goal of the survey was twofold: first, to help the IIT’s HCI program set strategic directions, and second, to profile the Canadian HCI community and determine its demographics, strengths, weaknesses, and needs. There was also a desire to help the community ameliorate some of the problems with conducting research in Canada, and achieve greater national and global
recognition.
The survey was focused on research, as that is the mandate of the NRC, so in this report,
whenever HCI professionals or HCI are mentioned, it is with respect to HCI research. The survey identified many interesting characteristics of the community along with several barriers that it faces. The most interesting of these are outlined below in bullet format (in no particular order) with greater detail given in the report.
• HCI is not well defined. There is not one specific job description or job type that clearly dominates the field, although most people who self-identify as HCI professionals have conducted research in usability.
• The survey confirmed that HCI professionals in Canada are highly qualified personnel with a very high Ph.D and Masters Degree rate and an average of 14 years of relevant experience. Additionally, HCI professionals possess a broad range of experience and come from a variety of different fields.
• HCI professionals are broadly represented across Canada (geographically) in the academic, government and corporate sectors.
• The field is growing (all three sectors report job growth in the future).
• At the time of the survey, only two organizations offered formal HCI degrees, although there appears to be a number of opportunities for further education in both the academic and corporate sectors.
• 53% of responding organizations have a formally recognized HCI group.
• HCI research is funded from a wide variety of government and corporate sponsors. • There is a great diversity in the HCI research thrust across Canada.
• The HCI research community is unaware of its strengths (and in general unaware of what is happening across Canada in HCI research).
• There does not appear to be a consistent vision of how to make Canada a global power in HCI research.
• There are a number of barriers to conducting HCI research, chief among them being a lack of funding and a lack of awareness of HCI and its value.
• Sixty-one percent of the respondents wanted a national organization, with an additional 17% interested given certain conditions (e.g., no new research forum).
One possibility to address some of the concerns raised in this research is the creation of a
Canadian HCI research organization. While there currently exists several ACM SIGCHI chapters across Canada, these are not related and do not necessarily cross-communicate. A national organization would give researchers the opportunity to network, while at the same time formulating approaches to marketing HCI in Canada. If the community can come together and represent itself as a coherent community to external interests (industry, funding bodies, governmental organizations), then many of the barriers facing its growth can start to be addressed.
http://groups.yahoo.com/group/canadahci/
Here you can download this report, post messages and files, engage in discussions, and keep in contact with what’s happening in the Canadian HCI community.
The report can also be downloaded at:
Introduction
As reported in Computerworld, 28% of all online purchases fail. Fifty percent of those failed transactions result from users not being able to find a product on the website. Ten percent of all experienced online shoppers have given up on a purchase because of usability problems. On the other hand, Boeing was able to reduce the number of pilots from 3 to 2 for 575s and 767s by using user-centered design to improve the cockpit. Another large company saved $6.7 million through an initial investment of $68,000 in usability design for logging in to their system - an ROI of nearly 1000%. Clearly, usability can have a major impact on productivity and economic viability.
Including usability, the field of Human Computer Interaction (HCI) encompasses a broad range of research activities. For instance, HCI involves creating better ways of navigating huge amounts of data or information; modelling human behaviour with the goal of reducing errors in safety-critical systems; creating hardware for improved information and data input; understanding the social implications of mobile computing; leveraging an understanding of collaborative processes to improve distance-education, etc. Given this list of topics, HCI is an important field for the new economy. As stated earlier, usability or user-centred design affects ROI. Just as important, however, the field of HCI is concerned with innovation through the creation of new ways of interacting with the world. This involves applying knowledge from physiological, sociological and psychological understanding of experience to new ways of envisioning our interaction with technology.
In this broadening field of HCI, Canada has the unique opportunity to foster world-class scientific innovation and excellence. Several converging factors can work together to make this goal a reality. Chief among the factors is our growing pool of highly qualified Canadian HCI researchers. Almost all universities in Canada employ at least one Ph.D. researcher in HCI. Additionally, there are government and corporate researchers in HCI giving broad coverage and good possibilities for inter-sector collaboration. The researchers are also geographically dispersed throughout Canada providing a unique opportunity to explore distance and Internet collaboration technologies as it is directly affected by our national geography. Furthermore, Canada’s
multilingual heritage gives us an opportunity to exploit cultural richness in creating unique technologies. Canadian HCI researchers are multidisciplinary and represented in a number of different faculties across Canada. This provides a unique opportunity for fueling innovation. Finally, the field is experiencing growth. All three sectors (government, industry, and academia) plan on expanding their HCI personnel in the future.
The focus for the HCI community in developing itself nationally, however, must start with understanding its basic demographics, concerns, facilitators, and barriers. This survey was undertaken with these goals in mind. This is only intended, however, to be the first step. A discussion group has been created at:
http://groups.yahoo.com/group/canadahci/
to start a national discussion on HCI related issues and also to serve as a central point to exchange information related to Canadian HCI. This survey report, along with other relevant documents, can be found there.
This profile report is divided into two sections:Methodology discusses the basic method for the survey, while Results outlines the results. Note that, for the most part, statistical significances are
not reported, as they are inappropriate given the data. However, wherever possible, averages are given.
Methodology
Participants
The list of Canadian HCI researchers was compiled in stages. Ilona Posner (the chief contractor) started with a list of personal contacts. This list was combined with a list of names generated via a web search to ensure all the Canadian universities with HCI related programs were represented along with all known corporate contacts. On December 21, 2001 introductory emails were sent to this initial list of 54 people describing the project and asking them to recommend colleagues that should be added to the mailing list. The research team decided to maintain an inclusive policy for this list and all participants who were recommended by their peers were accepted. As new names started to pour in, each new addition was sent an introductory email and was asked to add their colleagues to the list. By January 11, 2003, the list had grown to 157 names and it was distributed to all participants, with a final invitation to add their colleagues to the list. The end result was a list of 254 HCI researchers who were invited to participate in the study. The 254 invitees were divided according to the following employment groupings: 108 university academics, 21 Government employees, and 127 Corporate participants. Several individuals reported to have more than one employer, however, each individual was assigned to a single group according to the primary employer.
Survey Development
An initial draft of the survey was circulated on January 11th to 22 researchers soliciting their
feedback. A set of 11 recommendations for changes were received and incorporated. (See the Yahoo Groups website (http://groups.yahoo.com/group/canadahci/) for a copy of the final survey.)
Procedure
Using email, the survey was sent to the 254 identified HCI professionals. To increase the response rate, all participants were sent two reminders. Personal reminders were also sent to community members known especially for their significant HCI research accomplishments.
Detailed Results and Discussion
Response Rate
A total of 78 people responded to the call for participation, corresponding to a response rate of 30%. Additionally, 2 people were interviewed. The participation rate by group is shown in Table 1 below.
Total University Gov Corp
Number of Responses 78 42 10 28
Response rate of class 30% 39% 48% 22%
Demographics
Employers
The employer information has been grouped into three categories: university, government, and corporate.
The university responders (n=42) were drawn from 15 different Canadian institutions and 2 U.S. universities. Participants were invited from eight other universities with no responses.
The 10 participants from government agencies represented three different employers. This represents participation from each invited government agency.
A total of 28 people responded from the corporate sector representing 13 well-known companies and several smaller consulting firms. Invitations were sent to people at 16 other companies with no responses received.
Job Titles
Respondents listed a wide variety of job titles reflecting the diversity of employment situations under which Canadian HCI workers find themselves. The job titles included: Dean of Science, Chief Research Scientist, Director of a Research Institute, Professor, Associate Professor, Assistant Professor, Ph.D. Candidate, Defense Scientist, Research Officer, Retired Scientist, Manager, Industrial Technology Advisor, Consultant, and Specialist in User Interfaces, User Centered Design, Human Factors, System Architecture, Product Design, and Development.
Education
Participants were asked about the education they received. The results are summarized in Table 2. Overall, the respondents were well educated, with the majority (76%) holding a Ph.D. degree. The proportion of Ph.D.-level responders was highest in universities, and lowest in corporate.
Graduate Degrees Held
Total University Gov Corporate
PhD rate 76% 90% 80% 50%
MA/MS rate 92% 98% 100% 81%
Notes: 2 PhD's no MA/MS All at least MA/MS
2 PhD no MA/MS 5 BA only 2 No Answers
Table 2. The education levels attained by the respondents
Years of Experience
The average number of years of experience in the HCI field was 14.3 years, with a range from 2 to 35 years. Participants in a university setting had the most experience (15.6 years), followed by corporate (13.1 years) and government (12.6 years) participants.
Areas of Research
Participants were asked to indicate the areas of research they have participated in at anytime during their careers as well as those they are currently participating in. They were provided with a list of 14 research areas to choose from, or were invited to write-in a research area that was not included in the list. Some of the areas were fairly general (e.g., user interfaces), while some were specific sub-areas (e.g., haptic interfaces). The results of these questions are shown in Table 3.
The most common research areas are interfaces, usability analysis, user-centered design, navigation, and ergonomics/human factors. The respondents also listed a number of other research areas, with some of the most common being mobile devices, intelligent systems, virtual reality, and ubiquitous computing. Overall, the results from these questions indicate a very wide range of HCI research topics.
Research Area Career Currently
User Interface, Graphical Interface 81% 54%
Usability Analysis, Evaluation 72% 50%
User Centered Design 65% 46%
Navigation 59% 36%
Ergonomics, Human Factors 58% 28%
Cognitive Models, Cognitive Science 46% 27%
Multimedia Communications, Multimedia Information Research 46% 21% Groupware, Computer Supported Collaborative Work (CSCW) 45% 21% Learning: Computer Supported Learning, Distance Learning 44% 22%
Computer Mediated Communication 37% 17%
Visualization, Scientific Visualization 36% 24%
Information Architecture 33% 18%
Speech and Auditory interfaces 27% 10%
Haptic Interfaces 23% 12%
Table 3: The percentage of respondents who have worked, or are currently working, in each HCI research area.
Laboratories and Equipment
Sixty percent of the responding organizations included a dedicated HCI laboratory. Universities were much more likely to have lab facilities (87%) than government organizations (67%), and specialized laboratories were rare in corporate settings (25%). The equipment available in HCI labs ranged from empty rooms used for focus groups or simple observations, to fully equipped usability labs with video recording and analysis capabilities.
HCI Courses & Degrees
Participants were asked if their organization offered HCI-related courses. Overall, 16 organizations (53%) reported some HCI courses, with courses being common at universities (87%). Three corporations (25%) reported offering professional development courses, while none of the government organizations offered any courses. Although most universities offered one or more HCI courses, only two universities represented by the respondents (Toronto and Carleton) offer HCI degrees. It is not known if this list is exhaustive, or if broadening the definition to include other related course/degree areas, such as human factors or interface design, might provide different results.
HCI Groups & Students
In a related question, respondents were asked if their institution had a distinct HCI group or program. Overall, 53% of organizations include an HCI group. Such groups were common at universities (73%) and government sites (67%), but were rare for corporations (25%). Thus, although most universities lack an HCI degree, they do contain a distinct HCI group or program.
Participants were also asked how many current and past graduate students they have mentored. The results indicate that there are about 125 Masters and Ph.D. students currently being supervised and about 200 students previously graduated from HCI-related research programs. These findings suggest that even though there is a lack of formal HCI degrees, there are a large number of students receiving training in HCI.
Current Projects
Respondents were asked to indicate their current number of projects. Overall, the average was 3.73 projects, with the highest number of projects reported by university researchers (4.59), followed by government workers (3.38), and corporate responders (2.40). These differences may be due to the different work environments in these situations, with corporate workers perhaps concentrating on fewer, shorter-term projects in comparison to university researchers. The survey also included questions about the details of the current projects. Some of the respondents (about 10%) did not answer these questions citing the need for confidentiality, and this concern was most common in the corporate category. Those respondents that did describe their projects outlined a very diverse research field. The topics involved many different areas of HCI, including:
augmented reality, eGovernment, eCommerce, eHealth, eLearning, ePresence,
documentation studies, work environment studies, military visualizations, comparative hardware display studies, distance learning, automotive telematics, safety critical systems, 3D interactions, virtual reality, modeled interfaces, intelligent agents, security systems, wearable computing systems, computer supported collaborations, attention and multi-tasking, input and control devices, web authoring tools, interactive narrative interfaces, collaborative visualization techniques, mobile way finding devices, computer mediated interactions, auditory interfaces, 3d information visualizations, 3d intelligent environment sensing, impacts of internet study, knowledge management studies, intelligent interfaces.
The durations of the projects ranged from a few months to more than 5 years, and the funds involved included small projects (less than $1,000) and very large collaborations ($5.5 million over two years).
Sources of Funding
Respondents to this survey reported receiving funding from a variety of government and corporate sponsors. These included:
Government agencies: Natural Sciences and Engineering Research Council of Canada (NSERC), Social Sciences and Humanities Research Centre of Canada (SSRHC), Canarie, International Development Research Centre, HRDC, CSER, CITO, Ontario Educational Authority (TVO), National Research Council (NRC), IRAP,
IRIS_PRECARN, NewMIC, Colligo, CFI, ORDCF, CIHR, NSBRI, CRESTech, FCAR, OLT, Atomic Energy Control Board of Canada, Defense and Civil Institute for
Environmental Medicine (DCIEM), Government of Ontario, Ministry of Energy, Science, and Technology, National Science Foundation (NSF in the US), ASERC, National Centres of Excellence (NCE), Interactive Broadcast Ontario, Ontario TAP.
Corporate sponsors: Nissan Motor Company, Mitel, Nortel Networks, Microsoft Research, AECL Research, Alias|Wavefront, Asea Brown Boveri (ABB) Corporate Research - Heidelberg, Honeywell Technology Center, Japan Atomic Energy Research Institute, Microsoft, Mitsubishi Heavy Industries, Nova Chemical, Rotoflex International, Sytronics, Westinghouse Science & Technology Center, Bell University Labs, IBM.
Collaborations
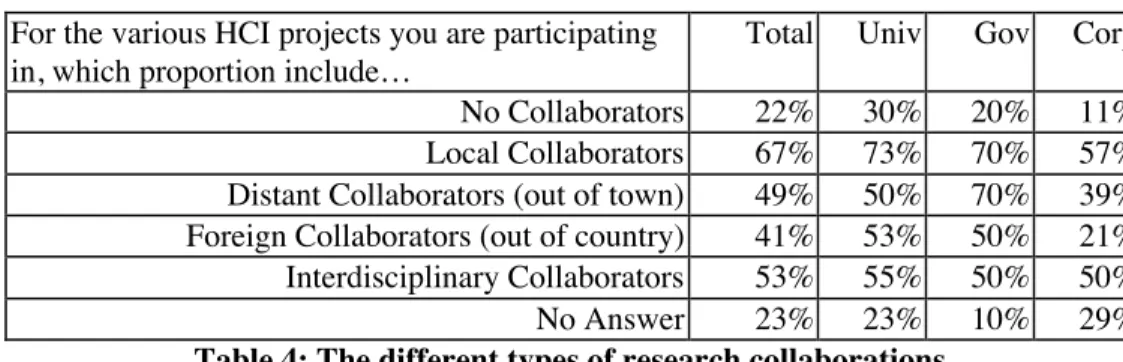
HCI researchers were asked about collaborative projects. The proportion of projects that involved working with collaborators, and the types of collaborators, are summarized in Table 4. Twenty-two percent of projects overall involve no collaborators, with university researchers working alone more often (30% of projects) than the other groups. When there are collaborators, they are most likely to be local to the researcher, but distant collaborations are also common. It is interesting to note that many projects involve foreign collaborations. These results suggest that Canadian HCI researchers have developed good relationships in other countries.
It is also interesting to note the rate of interdisciplinary collaboration. All of the respondent groups reported that at least half of their projects involved some form of interdisciplinary collaboration. The collaborators included subject matter experts in military matters, commerce, computer science, engineering, kinesiology, psychology, sociology, architecture, virtual reality, robotics, artificial intelligence, computer vision, and multimedia.
For the various HCI projects you are participating in, which proportion include…
Total Univ Gov Corp No Collaborators 22% 30% 20% 11% Local Collaborators 67% 73% 70% 57% Distant Collaborators (out of town) 49% 50% 70% 39% Foreign Collaborators (out of country) 41% 53% 50% 21% Interdisciplinary Collaborators 53% 55% 50% 50%
No Answer 23% 23% 10% 29%
Table 4: The different types of research collaborations.
Please note, the columns in this table do not add up to 100% because these choices are not independent but overlapping. Also, some respondents did not provide accurate proportions, as asked, but just gave Yes/No answers to the various collaboration types.
Choosing Projects
Participants in this study were also asked how they choose the projects that they work on. This was a rating question in which respondents were asked to rate 11 different factors on a scale ranging from "least important" (1) to "most important" (5). The results for this question are summarized in Table 5, which shows the average importance rating for each factor for all the participants, and for each employment group separately. The most important factor for choosing projects for all of the respondents was personal interest in a new area. This was followed by personal interest and expertise in a familiar area, funding opportunities, and interesting ideas. These findings suggest that overall, within funding constraints, the respondents were able to choose projects that were interesting to them.
Looking at the employment groups separately, the university respondents had the same top-four choice factors as was seen in the overall findings (as would be expected because they are the largest group of responders). For the corporate workers, it is not surprising the most important factor when choosing a project was the strategic direction of the employer. It is interesting to note, however, that the factors of personal interest, expertise, and funding opportunities are also
important for this group, although these factors received lower importance ratings than for the university group. These results suggest corporate workers do, to some extent, get to choose projects in which they have interest or experience.
The results for the government group are also interesting. These respondents also rated the strategic direction of their employer as the most important factor. They differed from the other groups, however, by giving relatively high ratings to importance and visibility within the HCI field. These results suggest that the government participants may be choosing projects more strategically in an attempt to facilitate developments within the field of HCI. It should be noted, however, that all of the importance ratings for the government group were low relative to the ratings of the other groups and the overall ratings (with no score greater than 4). This suggests that some factors not covered in the current question might be important for the government workers. Unfortunately, this group did not choose to use the "other" option to indicate different factors.
Project Choice Factor All Uni Gov Cor Personal interest in a new area of research 4.15 4.61 3.17 3.64 Personal interest and expertise in a familiar research area 3.98 4.37 3.00 3.57
Funding opportunities 3.59 3.77 2.83 3.50
An interesting idea I had 3.52 4.08 2.17 3.00
Perceived importance to the HCI field in general 3.28 3.46 3.33 2.85 Potential for visibility (publish-ability) of this project among the HCI
research community 3.17 3.41 3.33 2.62
Strategic direction of your employer 3.06 2.04 3.83 4.47
Identifiable and available collaborators with expertise in this area 2.87 3.11 2.50 2.57 Potential for visibility of this project among colleagues and your
employer 2.61 2.35 2.50 3.14
A subject that appeals to a graduate student 2.58 3.08 1.60 2.00
An idea that a colleague proposed 2.43 2.77 1.83 2.00
Table 5: Importance ratings for factors that influence a researcher's choice of project. NOTE: Highlight entries represent the top four factors for that group.
Strengths & Weaknesses
Strengths
Respondents were asked what they believed to be the current Canadian HCI research strengths. Of the 80 respondents, 26 (32.5%) did not name any strength. Seven of these respondents (27%) indicated that their null response was due to their lack of awareness of HCI research in Canada, rather than a perceived absence of strengths. The ability to name at least one strength varied by respondent group: respondents from academia seemed more likely than the others to provide at least one strength (see Table 6.), but this difference only approached significance (χ2 = 5.08, df =
2, p < 0.08).
At Least 1 Strength Total University Government Corporate
Number of respondents 54 33 6 15
% 67.5% 78.6% 60.0% 53.6%
The 54 respondents, each of whom named at least one strength, together named a total of 149 strengths, an average of 2.76 strengths per respondent. The highest number of strengths named by a single respondent was 10 strengths.
Of course, there was overlap in the 149 responses, in that some individual strengths were
identified by more than one respondent. A conservative categorization of these strengths based on response key words (mainly research areas) resulted in 77 strength categories (plus one category for no response). These categories were then collapsed into 17 Research Areas (including artificial intelligence, augmented reality, and information policy) and 6 other categories: an “other” category for research areas that could not be classified into one of the 17 research areas, a “none” category indicating that no strength was named, and 4 other categories relating to
responses that did not refer to a single research area (such as “ties to industry”). The distribution of strength categories is displayed in Figure 1. Additionally, Table 7 shows each of the strengths that were only mentioned one time.
Research Area Strengths
0.00 0.02 0.04 0.06 0.08 0.10 0.12 0.14 0.16 0.18 0.20 none commu nity org anisa tion CSC W (9 ) UI & GI (1 ) visu alisa tion (7) hapt ics & inpu t (1 3) other lear ning (8) AI usa bilit y (2 ) hum an fa ctor s (5) use r ce ntre d de sign (3) augm ente d re ality many infra stru cture mul timed ia (1 0) privat e se ctor spee ch & audi o (1 4) Strengths Pr o p o rti o n o f F re q u e n c y o f Me n ti o n
Figure 1: Proportions of frequency of mention of research area strengths in respondent answers.
Academic Support Funding Methodology
Agents General HCI Mobile Text Entry
AI Hand-Held Multilingual Interfaces
Attention & Eye Tracking HCI Education Multimodal Interfaces
Aviation Industrial Presence Musical Interfaces
Canadian IT Strength Information Retrieval NCEs
Close-Knit Innovative New Interface Design
Communications Intelligent User Interface Nonverbal Cues Complex Safety-Critical Systems Interactive Graphics Office Systems
Decision Support Interoperability Standards People Tracking Technology
Devices Kinesiology Public Displays
Displays (Small) Knowledge Management Social HCI
eCommerce Lively Technical
Education Media Spaces Telehealth
Educational Software Meta-Theory Ubiquitous Computing
Usability Testing
Table 7. 49 Strengths mentioned only once
The data across all respondents show a wide variety of responses, without much consensus on a core set of strengths. However, Figure 1 does show a discontinuous drop in frequency of mention between “UI & GI” and “visualisation”. This suggests that Canada’s HCI research strengths lie mainly in CSCW and “UI & GI” areas. The “UI & GI” category is fairly broad, including mobile HCI, graphics and web-based interfaces. Note that the most frequently mentioned strengths were not research areas but community characteristics: “people” and “community organisation” (see Table 8 for a description of the categories).
Note also that the “other” category figures highly in the Figure 1. The “other” category is composed of items that could not be classified into one of the Research Areas. We examined whether a more accommodative research area category structure would show more focussed agreement on a few strengths. Accordingly, we re-categorized the strength categories in a bottom-up fashion, placing each of the 77 strength categories into a set of broader categories, 14 of which focussed on a particular research area. The results of this re-categorization were substantially the same as the initial scheme’s, except that CSCW gained slightly more prominence, due mainly to lower frequencies of mention for other research area categories.
Research Area Description
Community Organisation Any strength involving traits or attributes of HCI researchers, or of the HCI community. Any strength regarding issues requiring community agreement or organised effort.
Category elements included:
Close-Knit Lively
Innovative Multidisciplinary
Interoperability Standards People
International Reputation Ties to Industry
CSCW Any strength involving collaboration, except eLearning, which was placed into “learning”.
Category elements included:
Collaboration Groupware
Collaborative Environments Telehealth
CSCW Telepresence
UI & GI Any strength involving small device design, graphical interfaces, or user interface design (but excluding usability, evaluation, and user-centred design techniques).
Category elements included:
Devices Mobile
eCommerce New Interface Design
Graphics UI
Hand-Held Web Design
Interactive Graphics
Table 8. Description of the most frequent research area strengths
Three results lead us to conclude that members of the Canadian HCI community suffer from a lack of awareness of HCI research activities in Canada. First, over 32% of the respondents did not name any Canadian HCI research strength. Moreover, seven of these respondents cited lack of awareness as the reason for their null response. Second, the other respondents named a wide variety of research areas as strengths showing little agreement as to which of these areas constituted true strengths, except CSCW, and the fairly broad “UI & GI”. Third, the most prevalent strengths (“community organisation” and “people”) were unrelated to a specific research area.
Canada’s role in the world
Eighteen (22.5%) of the respondents did not provide an answer to the question, “Where can Canada play an important part in worldwide HCI research in the future?” This is similar to the “no response” rate to the previous question (32.5%). The remaining 62 respondents provided a total of 149 items regarding the potential for Canada to play a global role. Some of these
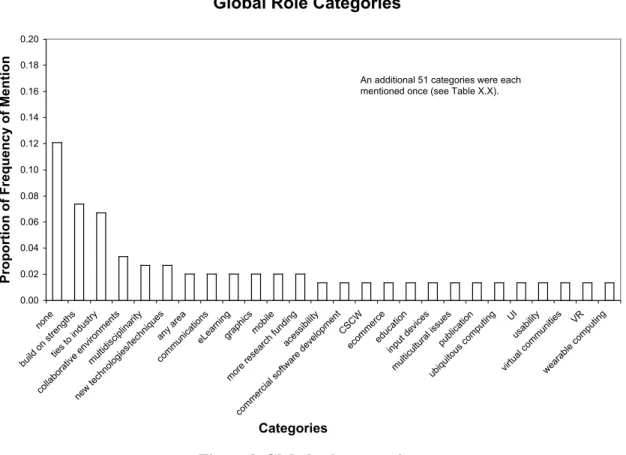
responses did not specify areas of research but rather means by which Canada could strengthen its global HCI role. For example, one respondent suggested increasing the strength of university-based HCI programs. As above, the responses were categorized university-based on key words, producing 76 categories, with one extra category for null responses. Note that some respondents referred us to the strengths they had provided in response to the previous question. We categorized these responses as we had for the previous question and, for each, added one count to the “build on strengths” category. To these 17, we added one category for null responses, one “other” category for research areas that could not be classified elsewhere, and 6 other categories unrelated to research areas. The distributions of responses across the categories are shown in Figures 2 and Table 9.
Figure 2. Global role categories
As with the previous question, the null response was also the most frequent response at 12.1%. Following the null response, the most frequent response was building on strengths at 7.4%, and increasing ties to industry at 6.7%.
Broad Category Description
Community Organisation Any item involving traits or attributes of HCI researchers, or of the HCI community. Any item regarding issues requiring community agreement or organised effort.
Role categories included: Focus on issues of global
importance Increase ties to Europe Follow a non-corporate
agenda Increase ties to industry
Follow a non-military agenda
Increase university/industry partnerships
Hold a Canadian HCI conference
Integration of HCI and software engineering Increase basic research Multidisciplinarity Increase international ties Publish
Increase the global visibility of Canadian HCI
UI & GI Any role involving small device design, graphical interfaces, or user interface design (but excluding usability, evaluation, and
Global Role Categories
0.00 0.02 0.04 0.06 0.08 0.10 0.12 0.14 0.16 0.18 0.20 none build on stre ngth s ties to in dust ry colla bora tive envi ronme nts mu ltidi scipl inari ty new tech nolo gies/ tech nique s any area commun icatio ns eLea rning graph ics mobi le more rese arch fund ing ace ssibi lity commerci al so ftware deve lopmen t CS CW eco mm erce educa tion inpu t de vice s mu lticu ltural issu es publ ication ubiqui tous compu ting UI usab ility virtu al co mm unities VR wea rabl e co mp utin g Categories Pr o p o rti o n o f F re q u e n c y o f Me n ti o n
An additional 51 categories were each mentioned once (see Table X.X).
user-centred design techniques). Role categories included
eGovernment Games
Additional items shown in Table 8.
CSCW Any role involving collaboration, except eLearning, which was placed into “learning”.
Role categories included
Shared knowledge Virtual communities Additional items shown in Table 8.
User Centred Design Any role involving an investigation of the user (e.g. user needs assessment) or the user’s activities (e.g. task analysis).
Role categories included
Accessibility Multicultural issues Aging issues Multilingual interfaces Community dynamics Organisational development Internationalisation Social HCI
More human centric
Table 9. Descriptions and category elements of the most prevalent global role research areas.
In sum, the most frequently cited ways to increase Canada’s global role in the area of HCI were related to community organisation. Respondents additionally believe that we should focus on the areas of: user interface and graphic interface design, including the design of small mobile devices and web-based interfaces, CSCW, and that we should follow a user-centred approach.
How to create a world class HCI environment
Several of the questions in the survey required free text responses. For these questions, a qualitative analysis using N-Vivo was undertaken
The factors listed as necessary for Canada to create and maintain a world class HCI environment were clustered into two distinct groups: community organization and infrastructure. Table 10 below shows counts of answers in each of the two broad categories. Table 11 then further subdivides the categories into several distinct types of answers.
Number of Responses Percentage Community organization 64 44% Infrastructure 68 46% Unclear 15 10%
Table 10. Broad factors to focus on to create a world class HCI environment in Canada.
Number Percentage Community Organization
Better Understanding of Discipline 22 15%
More Multidisciplinarity 11 7%
More People Networking 10 7%
Better ties to Industry 10 7%
Better International Ties 4 3% Infrastructure
Better Funding 27 25%
Academic Support
New University Programs 13 9%
More Researchers/Professors 5 3%
More Students 2 1%
More Basic Research 2 1%
General Support 5 3%
NCE 4 3%
Unclear 15 10%
Table 11. Specific factors to focus on to create a world class HCI environment in Canada.
The greatest perceived need in making Canada a world-class innovator in HCI is the need for better funding. Over 25% of the responses indicated that better funding was a necessary pre-requisite to being world-class. The second greatest perceived need is the need for better public, governmental, academic, and industry understanding of the field and its value. The following responses are typical of the responses in this category:
“It seems to me that HCI often falls in the cracks between university
departments, such as Psychology, Computer Science, and perhaps Business. It also seems to fall through the cracks in the funding agencies, sometimes being most relevant to NSERC, or SSHRC, or other.”
“More recognition from the general public and industry, and most important from the government.”
“Recognition of HCI must be raised. Once recognition is higher, industry support, and funding will follow.”
HCI growth in Canada
At the time the survey was carried out, 19 of the 42 (45.2%) Canadian organizations at which the respondents worked had openings in the area of HCI (see Table 12.)
Total University Government Corporate
Number of orgs w/ openings 19 9 1 9
% of orgs w/ openings 45.2% 50% 33% 42.9%
Number of openings 55.5 to 67.5 34 to 37 5 to 10 16.5 to 20.5
Table 12. HCI openings in Canada
In many instances, several people from the same organisation indicated that there were job openings in their organization. We made the conservative assumption that all respondents from the same organization referred to the same openings. For example, if respondent X stated there were 3 openings and respondent Y sated there were 2, we counted only 3 openings for that organization. We counted 3 rather than 2 under the assumption that one respondent was aware of an opening about which the other respondent had no knowledge. Some respondents provided ranges (e.g. “2 to 4”), which resulted in the ranges shown in the table.
Barriers to HCI research
Respondents were asked to rate on a scale of 1 to 5 the most significant barriers to conducting HCI research, with 5 indicating a more significant barrier. Figure 3 shows the responses with 95% confidence intervals indicated.
Barriers to HCI Research
(Mean and 95% CI)
1.00 2.00 3.00 4.00 5.00 Questions All 3.82 2.74 3.37 3.42 3.81 3.11 2.80 3.24 University 3.91 2.34 3.31 2.92 3.71 3.22 2.96 3.38 Gvt 3.75 4.00 2.63 3.43 3.86 3.00 2.63 2.86 Corporate 3.69 2.75 3.93 4.27 3.94 2.92 2.50 3.14
Funding Collaborators Recognition Employer support Industry recognition Industry collaborators Dept. recognition Multidisc. support Most Important: - lack of funding
- lack of industry recognition Group Differences:
- govt vs. others on expert collaborators - univ/corp on employer support - govt/corp on recognition greatest
least
Figure 3. Barriers to HCI research
It appears that lack of funding and industry recognition are the most important barriers to research. Government researchers also indicated that they have difficulty finding expert collaborators, though this was not the case in industry or academia. Those in industry felt that HCI research was also hindered by lack of support from their employers and possibly by a lack of national recognition of the importance of HCI research.
Frustrations
Survey respondents were asked to "list other frustrations faced by Canadian HCI researchers". The most frequent frustration (mentioned 7 times) was a lack of appreciation for the value of HCI, including a lack of respect for the discipline within the university community. The large distances between researchers in Canada, because of the sparse population and large geographic area, was mentioned 5 times. Mentioned four times was frustration with the level of funding at academic and industrial locations. The lack of national or regional HCI organizations was also mentioned 4 times. A lack of good students was mentioned (3 times), as was a lack of
Facilitators
Respondents also had the opportunity to describe "what could be done to facilitate your HCI research endeavors" and they produced numerous suggestions. By far the most frequent
suggestion (mentioned 21 times) was increased funding, and particular areas of concern included funding for technical and administrative support, and problems with Canada's funding agencies. The next most frequent facilitator was increasing the recognition of the HCI discipline (12 times), through increased understanding of the work and results. Marketing efforts were also included in this category. Increasing the training of students was also seen as a facilitator (9), and the lack of dedicated HCI programs was mentioned. Another facilitator was improving the quality of HCI research (8), which included increasing the amount of basic research. Increasing opportunities for collaboration and garnering support for interdisciplinary work were each mentioned 5 times. Reducing teaching loads in universities and building stronger university/industry relations were mentioned (3 times each). Finally, a national HCI organization was mentioned by 3 respondents.
Ideal Setting
Where
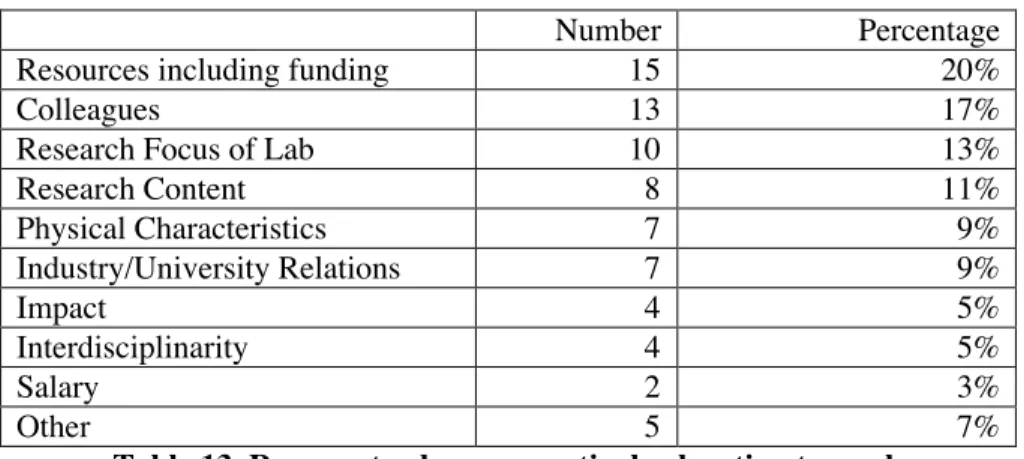
Answers to the question, “If you had an opportunity to participate in an HCI research project anywhere in the world, in any academic institution or any corporate research setting, where would you choose to be and why?” were categorized qualitatively using N-Vivo. The answers were categorized according to where to conduct research and why that particular place, and they are summarized in Table 13.
Echoing the responses from earlier questions, the most important reason to conduct research in a particular place revolves around resources, including funding. Colleagues and the research atmosphere of the lab were also important. Research content was also relatively important for choosing a specific lab to work in. Other reasons focused on the physical characteristics of the environment (sunny, green, skiing, etc.), the impact that the work would generate, the
interdisciplinary nature of the research team, salary, and other.
Number Percentage
Resources including funding 15 20%
Colleagues 13 17%
Research Focus of Lab 10 13%
Research Content 8 11% Physical Characteristics 7 9% Industry/University Relations 7 9% Impact 4 5% Interdisciplinarity 4 5% Salary 2 3% Other 5 7%
Table 13. Reasons to choose a particular location to work
As to where to work, HCI researchers focused on specific labs much more frequently than geographical locations (see Table 14). The labs named were Microsoft, Xerox PARC, CMU, and MIT. As a location, Canada was chosen more than other physical locations, but researchers really did focus on particular labs. There did not seem to be much preference for university versus industry.
Number Percentage of responses Specific Lab 2 64% Canada 8 18% Other 5 11% USA 1 2% University 1 2% Industry 1 2%
Table 14. Where to work
Characteristics
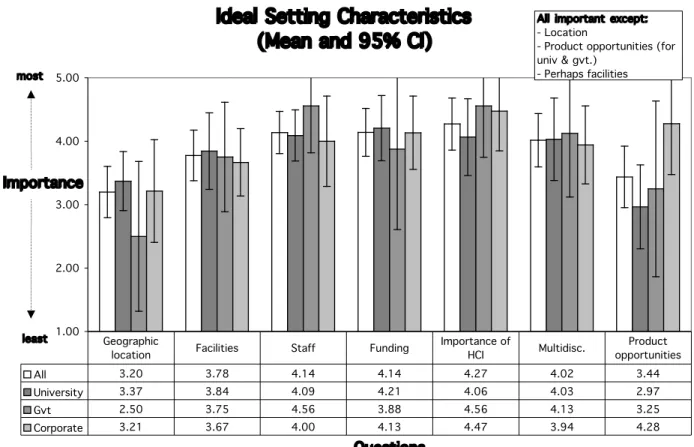
Respondents further rated the characteristics they believed most important to an ideal research setting (see Figure 4).
Figure 4. Ratings for ideal settings
As with the barriers data, 2 respondents’ data were missing. Moreover, 19 respondents rated fewer than 4 of the items, and, as a result, were removed. This left 59 respondents (73.75%) who left 20 items (4.8%) unrated. Overall, 29.8% of the data were either removed or missing.
Respondents indicated that an ideal setting would include recognition of the importance of both HCI and multidisciplinary research, significant sources of funding, and world-class research staff. The facilities were seen as being slightly less important and geography even less so. Respondents
Ideal Setting Characteristics
(Mean and 95% CI)
1.00 2.00 3.00 4.00 5.00 Questions Importance All 3.20 3.78 4.14 4.14 4.27 4.02 3.44 University 3.37 3.84 4.09 4.21 4.06 4.03 2.97 Gvt 2.50 3.75 4.56 3.88 4.56 4.13 3.25 Corporate 3.21 3.67 4.00 4.13 4.47 3.94 4.28 Geographic
location Facilities Staff Funding
Importance of
HCI Multidisc.
Product opportunities All important except: - Location
- Product opportunities (for univ & gvt.)
- Perhaps facilities most
from industry indicated that product development opportunities were important to them, but the respondents from academia rated this item much lower.
Association and Association Focus
Several survey questions were asked regarding the formation and focus of a new national HCI association. First and foremost, the survey ascertained whether there was any interest in the HCI community for forming such an association. Table 15 shows participants’ responses to the question, “Do you think there is a need for a new National HCI research association?”
Yes to Assn Conditional to Assn
No to Assn Percentages 61% (n=43) 17% (n=12) 21% (n=15)
Table 15. Percentage of respondents wanting association
Sixty-one percent of respondents wanted an association, and an additional 17% wanted an association conditional on particular circumstances, such as the focus of the association or whether it would be a part of the CHI structure. Thus there is overwhelming support in the community to create a Canadian HCI association: 78% of respondents were favourable to the formation. This support is strong across academic, industrial and government sectors. Table 16 shows the responses categorized by sector.
University Government Corporate
Yes to Assn 57% (n=20) 56% (n=5) 69% (n=18)
Conditional to Assn 20% (n=7 11% (n=6) 15% (n=4)
No to Assn 23% (n=8) 23% (n=3) 15% (n=4)
Table 16. Interest in HCI association by sector
If an association is created, HCI researchers are interested in joining the association. Table 17 shows participants’ responses by sector to the question, “Would you be interested in joining a Canadian HCI research association?” Overall, it appears that the join rate is higher than the need rate. This is partially explained by the slightly lower number of participants who answered the join question (n=63) as opposed to the need question (n=70).
University Government Corporate
Join Assn 73% (n=22) 67% (n=6) 71% (n=17)
Might join Assn 8% (n=3) 11% (n=1) 4% (n=1)
Wouldn’t join Assn 17% (n=5) 22% (n=2) 25% (n=6)
Table 17. Join rate for an association.
Only 17 participants answered the question, “If you think a Canadian HCI association is a good idea, would you be interested in helping in its formation?” Of those, 47% were willing to help to different degrees, and 53% were not willing to help at all. A similarly low number of participants responded to the question, “Would you be interested in attending a workshop/conference focusing on Canadian HCI research?” Of the 11 respondents, 18% were unconditionally willing to attend, and 82% were willing to attend based on certain conditions, such as no travel necessary. It appears that HCI researchers are willing to benefit from an association, but are not willing to put in the work to create and sustain one, therefore suggesting permanent administrative support is crucial to the creation of an association.
Figure 5 below shows participants’ favored focus for a Canadian HCI research association. Participants were asked to rate on a scale of 1 to 5 several different possible foci with 1 indicating the least important focus and 5 indicating the most important focus. The table below the figure shows the average ratings by sector.
Figure 5. Importance ratings for association focus
Overall, it appears that participants are interested in the first five categories, with much less interest expressed in creating a new research forum. This result is concordant with other questions in the survey and personal interactions with HCI researchers. If the association is created, its primary focus should be along the lines of a lobbying organization - securing funding opportunities for its members, allowing for networking opportunities (especially between academia and industry), and finally increasing awareness of HCI and its value to industry, society, and Canada.
In summary, HCI researchers are interested in forming a new national HCI research association, however, they are not interested in creating yet another venue for reporting research results. Additionally, they are not interested in being responsible for the running of the association.
Discussion
The intent of this survey was to profile the Canadian HCI community, its demographics, strengths, facilitators, and barriers. The survey was undertaken as the first step in starting a national discussion about HCI in Canada.
Focus of Association 1.00 1.50 2.00 2.50 3.00 3.50 4.00 4.50 5.00 Questions All 3.77 4.02 3.86 3.62 3.91 2.77 University 3.65 3.79 4.14 3.97 3.68 2.73 Government 4.50 4.63 3.63 3.38 3.63 2.25 Corporate 3.69 4.08 3.60 3.22 4.28 3.00
Networking Visibility Funding Lobby/Fundi ng
Better I/A relation
Research Forum
The survey has identified some specific barriers and issues that need be addressed. First, there is inadequate funding of HCI research in Canada. Part of this problem arises from the very strength of HCI’s multidisciplinarity. It is neither psychology, nor computer science, nor sociology, nor anthropology, etc. In fact, researchers conducting HCI research need to identify themselves with respect to another field because neither NSERC nor SSHRC recognize HCI as a distinct research domain. This multidiscipinarity also causes problems within academic faculties. Specific faculties do not recognize the value of HCI research because it does not always fit into traditional
academic models for conducting research. Related to the above, there is not enough recognition of the value of HCI as a distinct field. Because of the disbursement of HCI researchers across a wide geographical and conceptual area, there is a lack of communication within the field and lack of a coherent representation of the field to external interests. Canadian HCI research needs to be become more visible, both in its potential, and its successes. Finally, related to the above, education opportunities need to be expanded. HCI needs to be a degree-based program in more than the two universities.
On the other hand, HCI research is alive and vibrant in Canada. There are a large number of researchers in different sectors conducting interesting and useful research. The community is flourishing in that it has access to funds and graduate students, and the three sectors are each planning on hiring more HCI professionals.
To continue this discussion, and interpretation of results, a discussion forum has been created at:
http://groups.yahoo.com/group/canadahci/
After joining the group, you can post messages, download this report, upload files, etc. Additionally, the community can debate the usefulness of creating an association, its focus, its values, etc. This document was intended to be owned by the HCI community to help start this dialogue, but it is incumbent upon the community to continue the dialogue via other means. If enough interest is generated in the discussion forum, the HCI program of the NRC’s IIT is willing to help organize events, seek funding for an organization, create a better web-based community to exchange ideas, etc. However, we will not move forward on our own. Let’s get together and make Canada recognized locally, nationally, and internationally as an exciting, cohesive, and productive location for conducting HCI research.