HAL Id: hal-01734922
https://hal-amu.archives-ouvertes.fr/hal-01734922
Submitted on 20 Mar 2018HAL is a multi-disciplinary open access archive for the deposit and dissemination of sci-entific research documents, whether they are pub-lished or not. The documents may come from teaching and research institutions in France or abroad, or from public or private research centers.
L’archive ouverte pluridisciplinaire HAL, est destinée au dépôt et à la diffusion de documents scientifiques de niveau recherche, publiés ou non, émanant des établissements d’enseignement et de recherche français ou étrangers, des laboratoires publics ou privés.
Long-term high fructose and saturated fat diet affects
plasma fatty acid profile in rats
Fabrice Tranchida, Léopold Tchiakpe, Zo Rakotoniaina, Valérie Deyris,
Olivier Ravion, Abel Hiol
To cite this version:
Fabrice Tranchida, Léopold Tchiakpe, Zo Rakotoniaina, Valérie Deyris, Olivier Ravion, et al.. Long-term high fructose and saturated fat diet affects plasma fatty acid profile in rats. Journal of Zhejiang University Science B, Springer Verlag (Germany), 2012, 13 (4), pp.307-317. �10.1631/jzus.B1100090�. �hal-01734922�
Long-term high fructose and saturated fat diet
affects plasma fatty acid profile in rats
Fabrice TRANCHIDA1, Léopold TCHIAKPE2, Zo RAKOTONIAINA1, Valérie DEYRIS1, Olivier RAVION3, Abel HIOL†‡3
(1Institute of Molecular Sciences of Marseilles, iSm2 UMR 7313, CNRS, Aix-Marseille University, 13397 Marseilles Cedex 20, France)
(2Laboratory of Nutrition-Dietetics, Faculty of Pharmacy, Aix-Marseille University, 13385 Marseilles Cedex 5, France)
(3Food Sciences, Department of Biotechnology Engineering, Institute of Technology, University of the French West Indies and Guiana, Saint-Claude 97120, France)
†E-mail: [email protected]
Abstract: As the consumption of fructose and saturated fatty acids (FAs) has greatly increased in western diets and
is linked with an increased risk of metabolic syndrome, the aim of this study was to investigate the effects of a mod-erate (10 weeks) and a prolonged (30 weeks) high fructose and saturated fatty acid (HFS) diet on plasma FA com-position in rats. The effects of a few weeks of HFS diet had already been described, but in this paper we tried to es-tablish whether these effects persist or if they are modified after 10 or 30 weeks. We hypothesized that the plasma FA profile would be altered between 10 and 30 weeks of the HFS diet. Rats fed with either the HFS or a standard diet were tested after 10 weeks and again after 30 weeks. After 10 weeks of feeding, HFS-fed rats developed the metabolic syndrome, as manifested by an increase in fasting insulinemia, total cholesterol and triglyceride levels, as well as by impaired glucose tolerance. Furthermore, the plasma FA profile of the HFS group showed higher proportions of monounsaturated FAs like palmitoleic acid [16:1(n-7)] and oleic acid [18:1(n-9)], whereas the proportions of some polyunsaturated n-6 FAs, such as linoleic acid [18:2(n-6)] and arachidonic acid [20:4(n-6)], were lower than those in the control group. After 30 weeks of the HFS diet, we observed changes mainly in the levels of 16:1(n-7) (decreased) and 20:4(n-6) (increased). Together, our results suggest that an HFS diet could lead to an adaptive response of the plasma FA profile over time, in association with the development of the metabolic syndrome.
Key words: High fructose and saturated fatty acid diet, Metabolic syndrome, Plasma fatty acids, Adaptive response,Rats
1 Introduction
Over recent decades, fructose consumption has increased dramatically in industrialized countries as manufacturers have turned to using fructose instead of sucrose to sweeten processed foods and beverages. Similarly, the intake of saturated fat has risen during the same period. It has been reported that the current high dietary intake of fructose and saturated fat
con-tributes to the epidemic of the metabolic syndrome (Astrup and Finer, 2000; Malik et al., 2006), which is generally considered to be an association of impaired glucose tolerance, hypertension, dyslipidemia, hy-peruricemia, and central obesity (Balkau et al., 2002; Chen et al., 2007). Rodents fed with high-fructose and/or high-fat diets develop metabolic abnormalities such as hyperinsulinemia, insulin resistance (IR), and dyslipidemia (Basciano et al., 2005; Buettner et al., 2007; Abdullah et al., 2009). Many studies have shown that IR is directly associated with lipid disor-ders like an increase in plasma fatty acid (FA) levels
or changes of FA composition in the cell membrane. Both induce alterations in insulin action and the sig-naling pathway (Griffin et al., 1999). The proportions of plasma and tissue FA depend on various processes, e.g., dietary intake, intestinal absorption, endogenous synthesis, metabolism, and storage (Ma et al., 1995), in which different enzymes such as desaturases and elongases play a major role (Kim and Ntambi, 1999). The composition of plasma FA can be used as a risk indicator of disease (Aro, 2003), since an altered FA composition has been related to metabolic and car-diovascular disorders (Riccardi et al., 2004). There is evidence that dyslipidemia in fructose and saturated fat fed rats is accompanied by an increase in saturated fatty acids (SFAs) and monounsaturated fatty acids (MUFAs) and by a decrease in polyunsaturated fatty acids (PUFAs) (Girard et al., 2005). However, how the metabolic syndrome affects the lipid profile of plasma and which FA mainly contributes to its de-velopment, remain to be investigated. A comprehen-sive understanding of the plasma FA profile may provide more insights into metabolic syndrome pro-gression associated with a high fructose and saturated fatty acid (HFS) diet. As far as we know, no previous study has determined the changes in plasma FA composition induced by a prolonged HFS diet (30 weeks). We hypothesized that after an HFS diet pro-longed to 30 weeks, changes in plasma FA may occur concomitantly with the development of the metabolic syndrome. This fat- and fructose-rich diet largely mimics that of Western societies (Grundy, 1998). Consequently, the aim of this study was to investigate the effects of short-term (10 weeks) and long-term (30 weeks) HFS consumption on plasma biochemical parameters and FA profiles in response to IR development.
2 Materials and methods 2.1 Animal feeding design
Young male Sprague-Dawley rats (180–200 g) purchased from Janvier (Le Genest-St. Isle, France) were maintained in a temperature- and humidity- controlled environment and fed ad libitum. After one week of adaptation under feeding with a standard diet [3.32 kcal/g (l kcal=4.187 kJ); SAFE, Augy, France], the rats were divided into two groups: a control group
fed with a standard diet for 30 weeks and an HFS group fed with an identical diet except that the total carbohydrates and lipids present in the control diet were replaced by 61.7% fructose and 12% lard, re-spectively (4.3 kcal/g, SAFE, Augy, France) (Table 1). The animals received the same weight of food once a day, with free access to food and tap water. All the experiments were conducted in compliance with the Centre National Recherche Scientifique guidelines for animal ethics.
2.2 Reagents
Butylated hydroxytoluene (BHT) from Sigma- Aldrich was added to methanol (50 µg BHT/ml methanol) to prevent FA oxidation. The internal standard 23:0 methyl ester (Sigma-Aldrich) was dis-solved in the methanol-BHT mixture at 100 µg/ml. A standard mixture of 37-component fatty acid methyl esters (FAME) purchased from Supelco was used as the external standard.
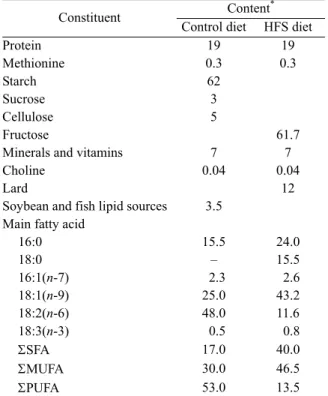
Table 1 Composition of the diets, including their fatty acid profiles
Constituent Content
*
Control diet HFS diet
Protein 19 19 Methionine 0.3 0.3 Starch 62 Sucrose 3 Cellulose 5 Fructose 61.7
Minerals and vitamins 7 7
Choline 0.04 0.04
Lard 12
Soybean and fish lipid sources 3.5 Main fatty acid
16:0 15.5 24.0 18:0 – 15.5 16:1(n-7) 2.3 2.6 18:1(n-9) 25.0 43.2 18:2(n-6) 48.0 11.6 18:3(n-3) 0.5 0.8 SFA 17.0 40.0 MUFA 30.0 46.5 PUFA 53.0 13.5
* The content of each constituent is expressed as g/100 g dry weight;
The proportion of each fatty acid is expressed as weight percentage in total fatty acids. HFS: high fructose and saturated fatty acid; SFA: total saturated fatty acids; MUFA: total monounsatured fatty acids; PUFA: total polyunsatured fatty acids
2.3 Sample collection and biochemical analysis After overnight fasting, blood was collected from the tail vein of each rat and the plasma was fractionated. Plasmatic levels of total cholesterol, triglyceride (TG), and glucose were determined using an automated analyzer (DXC, Beckman) and kits from Sigma Diagnostic (France). Plasma insulin was assessed using a rat insulin immunoassay kit (Mer-codia, France).
2.4 Glucose tolerance test
The intraperitoneal glucose tolerance test (IPGTT) was performed after 12 h of fasting. Briefly, glucose (1 g/kg body weight) was injected intraperi-toneally and glucose levels were determined with an automated glucometer (Ascensia BRIO, Bayer Di-agnostics, France) before injection and 30, 60, 90, 120, and 180 min after injection.
2.5 Determination of FA by gas chromatography The one-step transesterification reaction was performed as described by Masood et al. (2005). Briefly, 1.7 ml of methanol, 100 µl of acetyl chloride, 100 µl of the internal standard solution (containing 10 µg of 23:0 methyl ester), and 50 µl of plasma were combined in screw-capped glass tubes. The samples were incubated for 60 min at 100 °C in a water bath. After cooling to room temperature, 0.75 ml of hexane was added to the samples. After vortexing, the upper organic phase was collected. This step was repeated twice. The combined organic phases were evaporated to dryness under nitrogen and the lipids were resus-pended in 60 µl of hexane prior to analysis. Analyses were performed using a Hewlett-Packard 5890 gas chromatography (GC) equipped with a fused silica capillary column (60 m×0.25 mm i.d., 0.20 µm film thickness; Supelco SP-2340, USA) and a flame ioni-zation detector. Nitrogen was used as the carrier gas and the injection and detection temperatures were set to 270 and 260 °C, respectively. The initial oven temperature was set to 140 °C. After 25 min the oven temperature was increased from 140 to 240 °C at a rate of 4 °C/min and was then maintained at 240 °C for 20 min. The relative amount of each FA was ex-pressed as a percentage of the total FAs and was de-termined by integrating the area under the peak and dividing the result by the sum of the areas under the peaks corresponding to all FAs present in the sample.
2.6 Estimation of desaturase activity
The product/substrate [18:1(n-9)/18:0] and [16:1(n-7)/16:0] ratios, the [20:3(n-6)/18:2(n-6)] ratio, and the [20:4(n-6)/20:3(n-6)] ratio were used to es-timate the activities of delta-9 desaturase (∆9D), delta-6 desaturase (∆6D), and delta-5 desaturase (∆5D), respectively (Clore et al., 2000).
2.7 Statistical analyses
All data are expressed as mean±standard error of the mean (SEM). Student’s t-test was used to compare the mean values. Statistical analysis of the data was carried out using the SigmaStat 3.11 software (Systat Software Inc., USA). Differences were considered significant at P<0.05.
3 Results
3.1 Characteristics of metabolic syndrome in HFS-fed rats
The body weight of rats fed with HFS for 30 weeks decreased by 11% relative to the control group, while no significant difference in body weight was observed after 10 weeks of HFS diet (Table 2). The fasting glucose and plasma insulin levels were significantly higher in the HFS group irrespective of the diet duration. Furthermore, the IPGTT revealed a significant increase in bloodglucose levels in HFS rats vs. control rats, irrespective of the post-injection time and diet duration (Fig. 1). Plasma TG and cho-lesterol levels increased in HFS groups relative to the control group (Table 2), suggesting that the HFS intake contributes to dyslipidemia.
3.2 Modification of plasma FA distribution fol-lowing a prolonged HFS diet
In all experimental groups, the major plasma FAs were palmitic acid (16:0), palmitoleic acid [16:1(n-7)], stearic acid (18:0), oleic acid [18:1(n-9)], vaccenic acid [18:1(n-7)], linoleic acid [18:2(n-6)], arachidonic acid [AA; 20:4(n-6)] and docosahex-aenoic acid [DHA; 22:6(n-3)] (Table 3). Compared to the control group, significant differences were ob-served in the HFS group. The level of 18:1(n-9) was more than doubled after 10 and 30 weeks, while the level of 16:1(n-7), another product of ∆9D, doubled only after 10 weeks. Among n-6 PUFA, 18:2(n-6)
Table 2 Body weight and blood metabolic parameters in rats fed with the standard diet or the high fructose and saturated fat (HFS) diet for 10 and 30 weeks
Diet and feeding time Body weight (g) (mmol/L) Glucose Insulin (ng/L) Triglyceride (mmol/L) Cholesterol (mmol/L) Standard diet 10 weeks 472±8 5.6±0.63 225±12.5 1.4±0.1 1.25±0.12 HFS diet 10 weeks 456±13 8.66±0.43a 480±21.1a 2.1±0.15a 1.67±0.12a
Standard diet 30 weeks 610±11.6 5.4±0.78 229±13.5 1.76±0.1 1.37±0.12 HFS diet 30 weeks 544±8.2a 8.06±0.65a 715±33.8a 2.46±0.1a 1.66±0.12a
Data are expressed as mean±SEM with 8–20 rats in each group. a P<0.05 vs. the standard diet
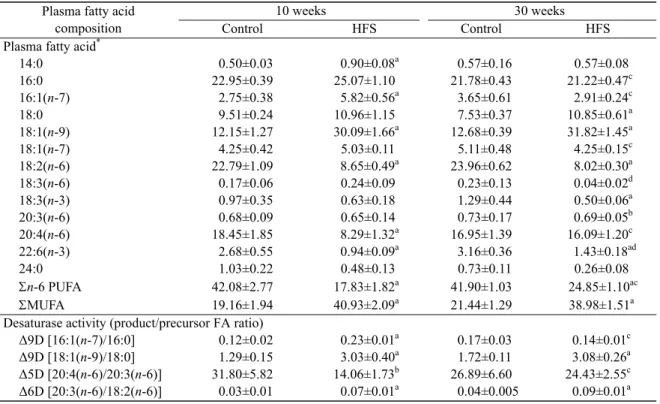
Table 3 Plasma fatty acid composition in rats fed with the standard diet or the high fructose and saturated fat (HFS) diet for 10 or 30 weeks
Plasma fatty acid composition
10 weeks 30 weeks
Control HFS Control HFS
Plasma fatty acid*
14:0 0.50±0.03 0.90±0.08a 0.57±0.16 0.57±0.08 16:0 22.95±0.39 25.07±1.10 21.78±0.43 21.22±0.47c 16:1(n-7) 2.75±0.38 5.82±0.56a 3.65±0.61 2.91±0.24c 18:0 9.51±0.24 10.96±1.15 7.53±0.37 10.85±0.61a 18:1(n-9) 12.15±1.27 30.09±1.66a 12.68±0.39 31.82±1.45a 18:1(n-7) 4.25±0.42 5.03±0.11 5.11±0.48 4.25±0.15c 18:2(n-6) 22.79±1.09 8.65±0.49a 23.96±0.62 8.02±0.30a 18:3(n-6) 0.17±0.06 0.24±0.09 0.23±0.13 0.04±0.02d 18:3(n-3) 0.97±0.35 0.63±0.18 1.29±0.44 0.50±0.06a 20:3(n-6) 0.68±0.09 0.65±0.14 0.73±0.17 0.69±0.05b 20:4(n-6) 18.45±1.85 8.29±1.32a 16.95±1.39 16.09±1.20c 22:6(n-3) 2.68±0.55 0.94±0.09a 3.16±0.36 1.43±0.18ad 24:0 1.03±0.22 0.48±0.13 0.73±0.11 0.26±0.08 n-6 PUFA 42.08±2.77 17.83±1.82a 41.90±1.03 24.85±1.10ac MUFA 19.16±1.94 40.93±2.09a 21.44±1.29 38.98±1.51a
Desaturase activity (product/precursor FA ratio)
Δ9D [16:1(n-7)/16:0] 0.12±0.02 0.23±0.01a 0.17±0.03 0.14±0.01c
Δ9D [18:1(n-9)/18:0] 1.29±0.15 3.03±0.40a 1.72±0.11 3.08±0.26a
Δ5D [20:4(n-6)/20:3(n-6)] 31.80±5.82 14.06±1.73b 26.89±6.60 24.43±2.55c
Δ6D [20:3(n-6)/18:2(n-6)] 0.03±0.01 0.07±0.01a 0.04±0.005 0.09±0.01a
Data are expressed as mean±SEM with 4–6 rats per group. * The proportion of each fatty acid is expressed as weight percentage in total
fatty acids. n-6 PUFA: total n-6 polyunsatured fatty acids; MUFA: total monounsatured fatty acids; Δ: desaturase activity. Samples were measured in duplicate.Significantly different from the control group at the same time point: a P<0.01, b P<0.05; Significantly
different from 10-week HFS group: c P<0.01, d P<0.05. The main FA are tabulated
Fig. 1 Results of the intraperitoneal glucose tolerance test (IPGTT) of rats fed with either the standard diet or the high fructose and saturated fat (HFS) diet for 10 (a) and 30 (b) weeks
Blood glucose was measured after overnight fasting (t=0) then at 30, 60, 90, 120, 150, and 180 min following intraperi-toneal glucose injection. Data are expressed as mean±SEM with 12 rats per group. * P<0.05 vs. the standard diet
decreased by 62% and by 68% after 10 and 30 weeks of HFS diet, respectively. However, the level of its elongation and desaturation product, 20:4(n-6) strongly decreased only after 10 weeks. An HFS diet also caused a decrease in the level of n-3 PUFA, 18:3(n-3), only after 30 weeks and a decrease in the level of 22:6(n-3) after 10 and 30 weeks. The [18:1(n-9)/18:0] and [20:3(n-6)/18:2(n-6)] ratios, used respectively to estimate the ∆9D and ∆6D ac-tivities, increased after 10 and 30 weeks, while the ∆9D activity [16:1(n-7)/16:0] significantly increased only after 10 weeks. A decrease in ∆5D activity [20:4(n-6)/20:3(n-6)] was observed only after 10 weeks.
The plasma FA composition was not altered in rats fed with the standard diet for 10 and 30 weeks. In contrast, after 30 weeks of HFS diet, we observed significant changes in the plasma FA profiles, com-pared to 10 weeks of HFS diet. Indeed, the proportion of 16:1(n-7) and that of its precursor 16:0 signifi-cantly decreased (−50% and −15%, respectively) between 10 and 30 weeks of the diet, while the pro-portion of 18:1(n-9) and that of its precursor 18:0 did not change. The FA 18:1(n-7), resulting from an elongation of 16:1(n-7), decreased by 16% after 30 weeks of HFS diet compared with the level at 10 weeks. Among n-6 PUFA, 18:2(n-6) was un-changed and 20:4(n-6) showed a two-fold increase between 10 and 30 weeks of the HFS diet. The pro-portion of 18:3(n-6), the desaturation product of 18:2(n-6), after 30 weeks of HFS diet decreased by 84% compared to the level at 10 weeks. Furthermore, after 30 weeks of HFS diet, total n-6 PUFA increased by 40% while total MUFA was unaltered. Concerning
n-3 PUFA, no significant changes in the proportions
of 18:3(n-3) and 22:6(n-3) were observed between 10
and 30 weeks of the HFS diet. The ∆9D
[18:1(n-9)/18:0] and ∆6D [20:3(n-6)/18:2(n-6)] ac-tivities were unchanged between 10 and 30 weeks in the HFS group. In contrast, ∆9D [16:1(n-7)/16:0] activity significantly decreased after 30 weeks of HFS diet while ∆5D [20:4(n-6)/20:3(n-6)] activity increased.
4 Discussion
In this study, we showed that HFS consumption for 30 weeks leads to an increase in glycemia,
insu-linemia, TG, and cholesterol levels and to abnormal IPGTT. These results are in accordance with previous studies showing that fructose and SFA diets induce impaired glucose tolerance, dyslipidemia, and hy-perinsulinemia (Thorburn et al., 1989; Girard et al., 2005; Abdullah et al., 2009). The coexistence of glucose intolerance and fasting hyperinsulinemia in HFS-fed rats strongly suggests the establishment of IR throughout the study period. The consumption of HFS affects the hepatic production of FA and leads to an FA imbalance. Indeed, absorbed fructose is deliv-ered to the liver through the portal vein and, once phosphorylated into fructose-1-phosphate, it is either converted to glycerol or metabolized in the glycolytic pathway and then induces an enhancement in the rate of de novo lipogenesis and TG synthesis (Mayes, 1993; Mittendorfer and Sidossis, 2001). More im-portantly, fructose bypasses the main control point in glycolysis, 6-phosphofructokinase and, unlike glu-cose, is not limited by feedback inhibition by citrate and adenosine triphosphate (ATP) (Basciano et al., 2005). The increase in the availability of gluconeo-genic substrates such as pyruvate, lactate, and glyc-erol and the accumulation of acetyl CoA resulting from an increase in FA oxidation have been suggested to be the major cause of fasting hyperglycemia in HFS-fed rats. This has been confirmed by the high level of fructose-1,6-bisphosphatase, a key glu-coneogenic enzyme (Storlien et al., 1993; Thresher et
al., 2000). Furthermore, an increase in circulating FA
leads to IR through the inhibition of the insulin sig-naling system (Dresner et al., 1999). The hyper-triglyceridemia induced by a high-fructose and/or high-fat diet is due to an increase in the production of very low density lipoproteins (VLDLs) and/or to a decrease in TG clearance (Zammit et al., 2001; Ab-dullah et al., 2009). The increase in total cholesterol induced by both lard and high fructose intake (Bantle
et al., 1986; Abdullah et al., 2009) results from a
higher cholesterol synthesis and/or an alteration of cholesterol metabolism. Furthermore, a moderate duration (10 weeks) of HFS diet induced similar weight gains in both groups, in agreement with pre-vious researches (Girard et al., 2005; Abdullah et al., 2009). In contrast, after a lengthy diet (30 weeks), the weight gain was lower in the HFS group than that in the standard group, even though the HFS diet pro-vides additional calories. This weight difference has
previously been reported in long-term high-fructose diets (Comte et al., 2004) and could be explained by a reduction in food intake in HFS rats, since no diarrhea or changes in physical activity were observed in rats of the HFS group. This observation may indicate an interaction between a high-fructose diet and the regulation of food intake, involving insulin, leptin, and ghrelin hormones (Havel, 2005). Consumption of HFS induces metabolic disorders that are not ac-companied by obesity, contrary to consumption of a high energy-starch diet (Berkane et al., 2007).
It is well known that the HFS diet modifies liver and plasma FA distribution (Girard et al., 2005; Ab-dullah et al., 2009). However, the effects induced on plasma FA distribution by a prolonged diet have not previously been investigated. We showed changes in plasma FA compositions after 10 and 30 weeks of the HFS diet. Indeed, the plasma FA profile in HFS-fed rats was characterized by a higher proportion of SFA and MUFA, notably ∆9D products [16:1(n-7) and 18:1(n-9)], as well as by a lower proportion of n-6 PUFA [18:2(n-6) and 20:4(n-6)]. This profile is con-sistent with liver and plasma FA composition studies in rats fed with high-fructose and/or saturated-fat diets (Comte et al., 2004; Girard et al., 2005; Abdul-lah et al., 2009). After 30 weeks of the HFS diet, we observed significant changes in plasma MUFA and
n-6 PUFA. Indeed, 16:1(n-7) levels decreased and
20:4(n-6) levels increased between 10 and 30 weeks of the HFS diet while 18:1(n-9) and 18:2(n-6) levels were unchanged. Our results also showed that altera-tions of SFA and unsaturated FA levels in HFS-fed rats affect desaturase activities, as estimated from the product/precursor FA ratios. These enzymes
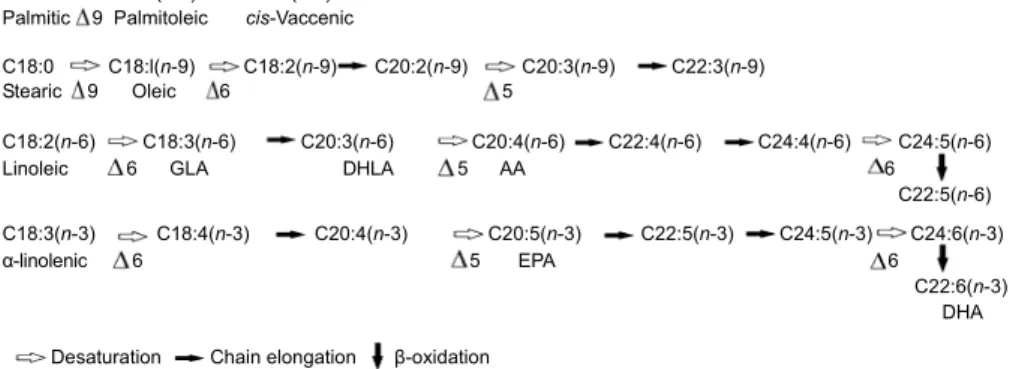
introduce a double bond at the ∆9, ∆6, or ∆5 position of the FA carbon chain (Nakamura and Nara, 2004) and therefore catalyze with elongases the synthesis of long chain MUFA and PUFA (Fig. 2). Furthermore, ∆9D indexes [also known as stearoyl-CoA desaturase (SCD)], estimated from plasma or tissues, were cor-related with the expression of the SCD mRNA in several studies (Attie et al., 2002; Hulver et al., 2005; Sjögren et al., 2008). We found that after 10 weeks, an HFS diet induces an increase in ∆9D and ∆6D activities and a decrease in ∆5D activity. Between 10 and 30 weeks of the HFS diet, ∆9D [18:1(n-9)/18:0] and ∆6D activities were unchanged while ∆9D [16:1(n-7)/16:0] decreased and ∆5D increased. The hepatic activity of ∆9D, which is directly linked to the proportion of SFA substrates, mainly 16:0, is re-pressed by dietary PUFA intake (Ntambi, 1995). The PUFA regulation of SCD activity allows cellular unsaturated FA balance to be maintained. The main role of SCD is to increase membrane unsaturation in response to an elevation of saturated fat or carbohy-drate dietary intake and to reduce the availability of 16:0 by converting it into 16:1(n-7). Palmitic acid (16:0) is the main component of phospholipids in membranes and it has been shown to mediate altera-tions of the insulin signaling pathway, causing IR through an activation of de novo ceramide synthesis (Schmitz-Peiffer et al., 1999). Additionally, 16:0 induces a decrease in the proliferative capacity of rodent and human β-cells, and promotes β-cell apoptosis while 16:1(n-7) counteracts the toxic ef-fects of 16:0 (Maedler et al., 2001; 2003). Chronic exposure of pancreatic islets to 16:0 completely abolishes acute glucose-stimulated insulin secretion,
Fig. 2 Fatty acid metabolism
C16:0 C16:l(n-7) C18:l(n-7) Palmitic 9 Palmitoleic cis-Vaccenic
C18:0 C18:l(n-9) C18:2(n-9) C20:2(n-9) C20:3(n-9) C22:3(n-9)
Stearic 9 Oleic 6 5
C18:2(n-6) C18:3(n-6) C20:3(n-6) C20:4(n-6) C22:4(n-6) C24:4(n-6) C24:5(n-6)
Linoleic 6 GLA DHLA 5 AA 6
C22:5(n-6)
C18:3(n-3) C18:4(n-3) C20:4(n-3) C20:5(n-3) C22:5(n-3) C24:5(n-3) C24:6(n-3)
α-linolenic 6 5 EPA 6
C22:6(n-3) DHA Desaturation Chain elongation β-oxidation
and addition of 16:1(n-7) partly restores such glucose stimulation (Maedler et al., 2001; 2003). Palmitoleic acid has a protective role against both pancreatic β-cell cytotoxicity and the deleterious effects on glucose-stimulated insulin release induced by palmitic acid. Our results showed that the protective effects of 16:1(n-7) declined when the HFS diet du-ration increased to 30 weeks. The availability of palmitic acid could also be reduced by increasing its elongation to 18:0, which could subsequently be de-saturated to 18:1(n-9). Our results showed that the proportion of 18:1(n-9) increased after 10 weeks and remained high after 30 weeks of HFS suggesting a sustained activation of ∆9D. The higher proportion of MUFA observed in HFS-fed rats was directly related to the increase in ∆9D activity. Indeed, the HFS diet promotes a higher proportion of MUFA in plasma FA profiles because of its fructose and lard content. Fructose is highly lipogenic. It has been observed in several studies that hepatic de novo FA synthesis (including the desaturation stage) is stimulated after acute fructose ingestion, with fructose providing carbon atoms for both the glycerol and the fatty-acyl parts of TGs (Clark et al., 1974; Chong et al., 2007; Parks et al., 2008). Fructose may also increase the expression of key lipogenic enzymes in the liver. It has been shown to induce the expression of the factor of transcription sterol regulatory element binding protein 1c (SREBP-1c), the principal activator of lipogenic genes including those coding for SCD (Shimomura et al., 1999; Matsuzaka et al., 2004; Miyazaki et al., 2004). Moreover, numerous investi-gations have shown an enhancement of MUFA pro-duction in fructose administration, due to an increase in hepatic SCD (Waters and Ntambi, 1994). Fur-thermore, dietary saturated fat strongly induces SCD expression involving the activation of the lipogenic transcription factors liver X receptor (LXR) and SREBP-1c (Sampath et al., 2007). An HFS diet that contains high proportions of palmitic acid (16:0) and stearic acid (18:0) may be likely to increase SCD activity. Indeed, the increase in palmitoleic acid [16:1(n-7)] as MUFA, which was found to be asso-ciated with IR and related disorders, does not directly reflect the proportion of this FA in the HFS diet. The content of palmitoleic acid was very small in the HFS diet and not different from that of the control diet. Rather, it reflects increased endogenous desaturation
of palmitic acid (16:0) by SCD [leading to increased 16:1(n-7)], as a consequence of the HFS diet. Thus, the increased proportion of 16:1(n-7) in the HFS group after 10 weeks, does not reflect the dietary proportion of this FA, but is due not only to an in-crease in substrate availability but also to an inin-crease in SCD, activity as indicated by the significantly increased ratio of [16:1(n-7)/16:0] used as a surrogate measure of this activity. Regarding oleic acid [18:1(n-9)], a large proportion of this FA in plasma is probably of dietary origin, given the high dietary abundance of 18:1(n-9) in the HFS diet. Nevertheless, other observations reveal that endogenous 18:1(n-9) synthesized by SCD, provides a more readily acces-sible FA pool than the dietary pool for the synthesis of TGs and cholesterol esters in the liver (Miyazaki et al., 2001; Ntambi and Miyazaki, 2004). In addition, Attie
et al. (2002) showed that the plasma ratio 18:1(n-9)/
18:0 used as a desaturation index was correlated with SCD activity. Furthermore, the ∆9-desaturation product of 18:0, 18:1(n-9), was required for fructose induction of lipogenic gene expression through de-pendent and indede-pendent mechanisms of SREBP-1c (Miyazaki et al., 2004). In the liver and in skeletal muscle, high ∆9D activity increases the production of malonyl-CoA which is a substrate for de novo lipo-genesis and a potent inhibitor of carnitine palmitoyl-transferase I (CPT1), the rate-limiting enzyme of FA β-oxidation (Dobrzyn et al., 2004; Hulver et al., 2005). Therefore, elevated levels of SCD influence the partitioning of FA towards synthesis and storage of TGs and away from β-oxidation. Elevated SCD activity is found in a wide range of disorders includ-ing diabetes, atherosclerosis, obesity, and the meta-bolic syndrome (Ntambi et al., 2002).
Among PUFA, linoleic acid [18:2(n-6)] and AA [20:4(n-6)] decreased by more than 50% after 10 weeks of HFS diet relative to the control group. Be-tween 10 and 30 weeks of the HFS diet, 18:2(n-6) levels were unchanged, while 20:4(n-6) exhibited a two-fold increase and γ-linolenic acid [GLA; 18:3(n-6)] decreased dramatically. ∆6D and ∆5D are required for the conversion of 18:2(n-6) to 20:4(n-6) and of α-linolenic acid [18:3(n-3)] to n-3 PUFA [ei-cosapentaenoic acid (EPA), docosahexaenoic acid (DHA)] (Fig. 2). The production of AA from linoleic acid requires the formation of two FA intermediates, GLA and dihomo-γ-linolenic acid [DHLA; 20:3(n-6)].
The first step is the ∆6-desaturation of linoleic acid to GLA followed by the elongation of GLA into DHLA. Finally, a ∆5-desaturation of DHLA leads to AA production (Fig. 2). High consumption of fructose during 30 weeks compared to 10 weeks induced an increase in ∆5D activity whereas ∆6D activity was unchanged. ∆6D is the rate-limiting enzyme involved in the conversion of linoleic acid to AA (Vessby, 2000). Thus, the generation rate for 18:3(n-6) and its elongation to 20:3(n-6) might still be regulated by ∆6D. Lower ∆5D levels could be responsible for the decrease in 20:4(n-6) levels in different tissues from diabetic rats (Hu et al., 1994). In diabetic patients, 20:4(n-6) levels increased or decreased depending on the tissues considered (Simopoulos, 1997; Clifton and Nestel, 1998). Metabolic pools of 20:4(n-6) seem to be tissue-specific. 20:4(n-6) is the precursor of n-6 eicosanoids, including the two-series prostaglandins which have greater biological activity than the three-series prostaglandins derived from n-3 PUFA (Hu et al., 1994). This 20:4(n-6) metabolism pathway involves cyclooxygenase and lipoxygenase that use molecular oxygen to generate reactive oxygen species (ROS) that are implicated in IR development and in impaired insulin secretion (Evans et al., 2003). Also, excessive production of n-6 eicosanoids from 20:4(n-6), such as the two-series prostaglandins, may give rise to pathophysiological signaling (Rustan et
al., 1997). The lower proportion of 20:4(n-6) that we
observed after 10 weeks of the HFS diet compared to the proportion after 30 weeks seems to be due to a decline in ∆5D activity (Table 3) rather than to an increase in prostaglandin production. The decrease in 18:3(n-6) levels between 10 and 30 weeks of the HFS diet could be explained by an increase in 20:4(n-6) production correlated with an increase in ∆5D activity. On the other hand, 20:4(n-6) is one of the most oxidation-prone FAs (Vazquez et al., 1998) and it activates nicotinamide adenine dinucleotide phos-phate (NADPH) oxidase (Shiose and Sumimoto, 2000), generating ROS. The stimulation of neutrophil NADPH oxidase by advanced glycation end-products could be mediated by an increase in 20:4(n-6) pro-duction resulting from phospholipase A2 activation (Wong et al., 2003). Furthermore, the lower levels of
n-6 PUFA and 20:4(n-6) after 10 weeks of HFS diet
compared to the levels after 30 weeks might prevent lipid peroxidation. However, after 30 weeks of the
HFS diet, 20:4(n-6) levels increased, suggesting that this prevention declines over time. Interestingly, other studies have reported an adaptive response of blood pressure and an enzyme adaptation in lipid and car-bohydrate metabolism among the long-term effects of a high-fructose diet (Vraná et al., 1978; Mayes and Laker, 1986; Park and Meyer, 1992; Dai and McNeill, 1995; Takagawa et al., 2001).
5 Conclusions
In summary, our results showed changes in the plasma FA composition in rats fed for 10 or 30 weeks with HFS, especially in 16:1(n-7) (MUFA) and 20:4(n-6) (n-6 PUFA). These disruptions, associated with the appearance of hyperinsulinemia, could be linked to the development of IR. It remains to be determined whether these FA modifications contrib-ute to IR or are initiated in response to IR. Neverthe-less, 16:1(n-7) levels observed after 10 weeks of HFS could counteract the toxicity induced by an excess of palmitic acid and 20:4(n-6) could prevent lipid per-oxidation. These changes in FA profile could be considered as preventive mechanisms against fuel excess, as observed in the early stages of IR, rather than as a deleterious response. After 30 weeks of HFS diet, the protective responses of 16:1(n-7) and 20:4(n-6) seem to decrease or disappear with the development of IR associated with the deleterious effects of glucolipotoxicity. It could be hypothesized that, after an HFS diet prolonged to 30 weeks, rats are not able to develop a sustained response that ade-quately compensates for IR. Further experiments are required to elucidate this phenomenon.
Acknowledgements
The authors thank Mr. Ben S. ABDOU- RAHAMANE for technical assistance, Dr. Fabienne GUILLAUMOND for precious advice, and Dr. Corinne DELAURENT and Dr. Claude AUBERT for performing the GC analysis of plasma FA.
References
Abdullah, M.M., Riediger, N.N., Chen, Q., Zhao, Z., Azor-degan, N., Xu, Z., Fischer, G., Othman, R.A., Pierce, G.N., Tappia, P.S., et al., 2009. Effects of long-term
consumption of a high-fructose diet on conventional car-diovascular risk factors in Sprague-Dawley rats. Mol.
Cell. Biochem., 327(1-2):247-256. [doi:10.1007/s11010-
009-0063-z]
Aro, A., 2003. Fatty acid composition of serum lipids: is this marker of fat intake still relevant for identifying meta-bolic and cardiovascular disorders? Nutr. Metab.
Car-diovasc. Dis., 13(5):253-255. [doi:10.1016/S0939-4753
(03)80028-5]
Astrup, A., Finer, N., 2000. Redefining type 2 diabetes: ‘dia-besity’ or ‘obesity dependent diabetes mellitus’? Obes.
Rev., 1(2):57-59. [doi:10.1046/j.1467-789x.2000.00013.x] Attie, A.D., Krauss, R.M., Gray-Keller, M.P., Brownlie, A.,
Miyazaki, M., Kastelein, J.J., Lusis, A.J., Stalenhoef, A.F.H., Stoehr, J.P., Hayden, M.R., et al., 2002. Rela-tionship between stearoyl-CoA desaturase activity and plasma triglycerides in human and mouse hypertriglyc-eridemia. J. Lipid Res., 43(11):1899-1907. [doi:10.1194/ jlr.M200189-JLR200]
Balkau, B., Charles, M.A., Drisvsholm, T., Borch-Johnsen, K., Wareham, N., Yudkin, J.S., Morris, R., Zavaroni, I., van Dam, R., Feskins, E., et al., 2002. Frequency of the WHO metabolic syndrome in European cohorts, and an alter-native definition of an insulin resistance syndrome.
Dia-betes Metab., 28(5):364-376.
Bantle, J.P., Laine, D.C., Thomas, J.W., 1986. Metabolic effects of dietary fructose and sucrose in types I and II diabetic subjects. JAMA, 256(23):3241-3246. [doi:10. 1001/jama.1986.03380230065027]
Basciano, H., Federico, L., Adeli, K., 2005. Fructose, insulin resistance, and metabolic dyslipidemia. Nutr. Metab.,
2(1):5. [doi:10.1186/1743-7075-2-5]
Berkane, A.A., Nguyen, H.T.T., Tranchida, F., Waheed, A.A., Deyris, V., Tchiakpe, L., Fasano, C., Nicoletti, C., Desseaux, V., Ajandouz, E.H., et al., 2007. Proteomic of lipid rafts in the exocrine pancreas from diet-induced obese rats. Biochem. Biophys. Res. Commun., 355(3): 813-819. [doi:10.1016/j.bbrc.2007.02.037]
Buettner, R., Scholmerich, J., Bolheimer, L.C., 2007. High-fat diets: modeling the metabolic disorders of human obesity in rodents. Obesity, 15(4):798-808. [doi:10.1038/oby. 2007.608]
Chen, L.Y., Zhu, W.H., Chen, Z.W., Dai, H.L., Ren, J.J., Chen, J.H., Chen, L.Q., Fang, L.Z., 2007. Relationship between hyperuricemia and metabolic syndrome. J. Zhejiang
Univ.-Sci. B, 8(8):593-598. [doi:10.1631/jzus.2007.
B0593]
Chong, M.F., Fielding, B.A., Frayn, K.N., 2007. Mechanisms for the acute effect of fructose on postprandial lipemia.
Am. J. Clin. Nutr., 85(6):1511-1520.
Clark, D.G., Rognstad, R., Katz, J., 1974. Lipogenesis in rat hepatocytes. J. Biol. Chem., 249(7):2028-2036.
Clifton, P.M., Nestel, P.J., 1998. Relationship between plasma insulin and erythrocyte fatty acid composition.
Prostag-landins Leukot. Essent. Fatty Acids, 59(3):191-194. [doi: 10.1016/S0952-3278(98)90062-X]
Clore, J.N., Harris, P.A., Li, J., Azzam, A., Gill, R., Zuelzer,
W., Rizzo, W.B., Blackard, W.G., 2000. Changes in phosphatidylcholine fatty acid composition are associated with altered skeletal muscle insulin responsiveness in normal man. Metabolism, 49(2):232-238. [doi:10.1016/ S0026-0495(00)91455-0]
Comte, C., Bellenger, S., Bellenger, J., Tessier, C., Poisson, J.P., Narce, M., 2004. Effects of streptozotocin and die-tary fructose on delta-6 desaturation in spontaneously hypertensive rat liver. Biochimie, 86(11):799-806. [doi:10. 1016/j.biochi.2004.10.002]
Dai, S.K., McNeill, J.H., 1995. Fructose-induced hypertension in rats is concentration- and duration-dependent. J.
Pharmacol. Toxicol. Methods, 33(2):101-107. [doi:10.
1016/1056-8719(94)00063-A]
Dobrzyn, P., Dobrzyn, A., Miyazaki, M., Cohen, P., Asilmaz, E., Hardie, D.G., 2004. Stearoyl-CoA desaturase 1 defi-ciency increases fatty acid oxidation by activating AMP- activated protein kinase in liver. PNAS, 101(17): 6409-6414. [doi:10.1073/pnas.0401627101]
Dresner, A., Laurent, D., Marcucci, M., Griffin, M.E., Dufour, S., Cline, G.W., Slezak, L.A., Andersen, D.K., Hundal, R.S., Rothman, D.L., et al., 1999. Effects of free fatty acids on glucose transport and IRS-1-associated phos-phatidylinositol 3-kinase activity. J. Clin. Invest., 103(2): 253-259. [doi:10.1172/JCI5001]
Evans, J.L., Goldfine, I.D., Maddux, B.A., Grodsky, G.M., 2003. Are oxidative stress-activated signaling pathways mediators of insulin resistance and β-cell dysfunction?
Diabetes, 52(1):1-8. [doi:10.2337/diabetes.52.1.1] Girard, A., Madani, S., El Boustani, E.S., Belleville, J., Prost,
J., 2005. Changes in lipid metabolism and antioxidant defense status in spontaneously hypertensive rats and Wistar rats fed a diet enriched with fructose and saturated fatty acids. Nutrition, 21(2):240-248. [doi:10.1016/j.nut. 2004.04.022]
Griffin, M.E., Marcucci, M.J., Cline, G.W., Bell, K., Barucci, N., Lee, D., Goodyear, L.J., Kraegen, E.W., White, M.F., Shulman, G.I., 1999. Free fatty acid-induced insulin re-sistance is associated with activation of protein kinase C θ and alterations in the insulin-signaling cascade. Diabetes,
48(6):1270-1274. [doi:10.2337/diabetes.48.6.1270] Grundy, S.M., 1998. Multifactorial causation of obesity:
im-plications for prevention. Am. J. Clin. Nutr., 67(3): 563S-572S.
Havel, P.J., 2005. Dietary fructose: implications for dysregu-lation of energy homeostasis and lipid/carbohydrate me-tabolism. Nutr. Rev., 63(5):133-157. [doi:10.1111/j.1753- 4887.2005.tb00132.x]
Hu, Q., Ishii, E., Nalagawa, Y., 1994. Differential changes in relative levels of arachidonic acid in major phospholipids from rat tissues during the progression of diabetes. J.
Biochem., 115(3):405-408.
Hulver, M.W., Berggren, J.R., Carper, M.J., Miyazaki, M., Ntambi, J.M., Hoffman, E.P., Thyfault, J.P., Stevens, R., Dohm, G.L., Houmard, J.A., et al., 2005. Elevated stearoyl-CoA desaturase-1 expression in skeletal muscle contributes to abnormal fatty acid partitioning in obese
humans. Cell Metab., 2(4):251-261. [doi:10.1016/j.cmet. 2005.09.002]
Kim, Y.C., Ntambi, J.M., 1999. Regulation of stearoyl-CoA desaturase genes: role in cellular metabolism and preadipocyte differentiation. Biochem. Biophys. Res.
Commun., 266(1):1-4. [doi:10.1006/bbrc.1999.1704]
Ma, J., Folsom, A.R., Shahar, E., Eckfeldt, J.H., for the Atherosclerosis Risk in Communities (ARIC) Study In-vestigators, 1995. Plasma fatty acid composition as an indicator of habitual dietary fat intake in middle-aged adults. Am. J. Clin. Nutr., 62(3):564-571.
Maedler, K., Spinas, G.A., Dyntar, D., Moritz, W., Kaiser, N., Donath, M.Y., 2001. Distinct effects of saturated and monounsaturated fatty acids on β-cell turnover and func-tion. Diabetes, 50(1):69-76. [doi:10.2337/diabetes.50. 1.69]
Maedler, K., Oberholzer, J., Bucher, P., Spinas, G.A., Donath, M.Y., 2003. Monounsaturated fatty acids prevent the deleterious effects of palmitate and high glucose on hu-man pancreatic β-cell turnover and function. Diabetes,
52(3):726-733. [doi:10.2337/diabetes.52.3.726]
Malik, V.S., Schulze, M.B., Hu, F.B., 2006. Intake of sugar- sweetened beverages and weight gain: a systematic re-view. Am. J. Clin. Nutr., 84(2):274-288.
Masood, A., Stark, K.D., Salem, N.Jr., 2005. A simplified and efficient method for the analysis of fatty acid methyl es-ters suitable for large clinical studies. J. Lipid Res.,
46(10):2299-2305. [doi:10.1194/jlr.D500022-JLR200] Matsuzaka, T., Shimano, H., Yahagi, N., Amemiya-Kudo, M.,
Okazaki, H., Tamura, Y., Iizuka, Y., Ohashi, K., Tomita, S., Sekiya, et al., 2004. Insulin-independent induction of sterol regulatory element-binding protein-1c expression in the livers of streptozotocin-treated mice. Diabetes,
53(3):560-569. [doi:10.2337/diabetes.53.3.560]
Mayes, P.A., 1993. Intermediary metabolism of fructose. Am.
J. Clin. Nutr., 58(5):754S-765S.
Mayes, P.A., Laker, M.E., 1986. Effects of acute and long- term fructose administration on liver lipid metabolism.
Prog. Biochem. Pharmacol., 21:33-58.
Mittendorfer, B., Sidossis, L.S., 2001. Mechanism for the increase in plasma triacylglycerol concentrations after consumption of short-term, high-carbohydrate diets. Am.
J. Clin. Nutr., 73(5):892-899.
Miyazaki, M., Kim, Y.C., Ntambi, J.M., 2001. A lipogenic diet in mice with a disruption of the stearoyl-CoA desaturase 1 gene reveals a stringent requirement of endogenous monounsaturated fatty acids for triglyceride synthesis. J.
Lipid Res., 42(7):1018-1024.
Miyazaki, M., Dobrzyn, A., Man, W.C., Chu, K., Sampath, H., Kim, H.J., Ntambi, J.M., 2004. Stearoyl-CoA desaturase 1 gene expression is necessary for fructose-mediated in-duction of lipogenic gene expression by sterol regulatory element-binding protein-1c-dependent and -independent mechanisms. J. Biol. Chem., 279(24):25164-25171. [doi:10.1074/jbc.M402781200]
Nakamura, M.T., Nara, T.Y., 2004. Structure, function, and dietary regulation of Δ6, Δ5, and Δ9 desaturases. Annu.
Rev. Nutr., 24(1):345-376. [doi:10.1146/annurev.nutr.24. 121803.063211]
Ntambi, J.M., 1995. The regulation of stearoyl-CoA desaturase (SCD). Prog. Lipid Res., 34(2):139-150. [doi:10.1016/ 0163-7827(94)00010-J]
Ntambi, J.M., Miyazaki, M., 2004. Regulation of stearoyl- CoA desaturases and role in metabolism. Prog. Lipid Res.,
43(2):91-104. [doi:10.1016/S0163-7827(03)00039-0] Ntambi, J.M., Miyazaki, M., Stoehr, J.P., Lan, H., Kendziorski,
C.M., Yandell, B.S., Song, Y., Cohen, P., Friedman, J.M., Attie, A.D., 2002. Loss of stearoyl-CoA desaturase-1 function protects mice against adiposity. PNAS, 99(17): 11482-11486. [doi:10.1073/pnas.132384699]
Park, S.K., Meyer, T.W., 1992. The effects of fructose feeding on glomerular structure in the rat. J. Am. Soc. Nephrol.,
3(6):1330-1332.
Parks, E.J., Skokan, L.E., Timlin, M.T., Dingfelder, C.S., 2008. Dietary sugars stimulate fatty acid synthesis in adults. J.
Nutr., 138(6):1039-1046.
Riccardi, G., Giacco, R., Rivellese, A.A., 2004. Dietary fat, insulin sensitivity and the metabolic syndrome. Clin.
Nutr., 23(4):447-456. [doi:10.1016/j.clnu.2004.02.006] Rustan, A.C., Nenseter, M.S., Drevon, C.A., 1997. Omega-3
and omega-6 fatty acids in the insulin resistance syn-drome. Lipid and lipoprotein metabolism and athero-sclerosis. Ann. N. Y. Acad. Sci., 827:310-326. [doi:10. 1111/j.1749-6632.1997.tb51844.x]
Sampath, H., Miyazaki, M., Dobrzyn, A., Ntambi, J.M., 2007. Stearoyl-CoA desaturase-1 mediates the pro-lipogenic effects of dietary saturated fat. J. Biol. Chem., 282(4): 2483-2493. [doi:10.1074/jbc.M610158200]
Schmitz-Peiffer, C., Craig, D.L., Biden, T.J., 1999. Ceramide generation is sufficient to account for the inhibition of the insulin-stimulated PKB pathway in C2C12 skeletal muscle
cells pretreated with palmitate. J. Biol. Chem., 274(34): 24202-24210. [doi:10.1074/jbc.274.34.24202]
Shimomura, I., Bashmakov, Y., Horton, J.D., 1999. Increased levels of nuclear SREBP-1c associated with fatty livers in two mouse models of diabetes mellitus. J. Biol. Chem.,
274(42):30028-30032. [doi:10.1074/jbc.274.42.30028] Shiose, A., Sumimoto, H., 2000. Arachidonic acid and
phos-phorylation synergistically induce a conformational change of p47phox to activate the phagocyte NADPH oxidase. J. Biol. Chem., 275(18):13793-13801. [doi:10. 1074/jbc.275.18.1379]
Simopoulos, A.P., 1997. Omega-6/omega-3 fatty acid ratio and trans fatty acids in non-insulin-dependent diabetes mellitus. Ann. N. Y. Acad. Sci., 827:327-338. [doi:10. 1111/j.1749-6632.1997.tb51845.x]
Sjögren, P., Sierra-Johnson, J., Gertow, K., Rosell, M., Vessby, B., de Faire, U., Hamsten, A., Hellenius, M.L., Fisher, R.M., 2008. Fatty acid desaturases in human adipose tissue: relationships between gene expression, desatura-tion indexes and insulin resistance. Diabetologia, 51(2): 328-335. [doi:10.1007/s00125-007-0876-9]
Storlien, L.H., Pan, D.A., Kriketos, A.D., Baur, L.A., 1993. High fat diet-induced insulin resistance. Lessons and
implications from animal studies. Ann. N. Y. Acad. Sci.,
683:82-90. [doi:10.1111/j.1749-6632.1993.tb35694.x] Takagawa, Y., Berger, M.E., Hori, M.T., Tuck, M.L., Golub,
M.S., 2001. Long-term fructose feeding impairs vascular relaxation in rat mesenteric arteries. Am. J. Hypertens.,
14(8):811-817. [doi:10.1016/S0895-7061(01)01298-5] Thorburn, A.W., Storlien, L.H., Jenkins, A.B., Khouri, S.,
Kraegen, E.W., 1989. Fructose-induced in vivo insulin resistance and elevated plasma triglyceride levels in rats.
Am. J. Clin. Nutr., 49(6):1155-1163.
Thresher, J.S., Podolin, D.A., Wei, Y., Mazzeo, R.S., Pagli-assotti, M.J., 2000. Comparison of the effects of sucrose and fructose on insulin action and glucose tolerance. Am.
J. Physiol. Regul. Integr. Comp. Physiol.,
279(4):R1334-R1340.
Vazquez, M., Merlos, M., Adzet, T., Laguna, J., 1998. Influ-ence of lipid profile and fatty acid composition on the oxidation behavior of rat and guinea pig low density lipoprotein. Comp. Biochem. Physiol. B. Biochem. Mol.
Biol., 119(2):311-316. [doi:10.1016/S0305-0491(97)00
331-3]
Vessby, B., 2000. Dietary fat and insulin action in humans. Br.
J. Nutr., 83(S1):S91-S96. [doi:10.1017/S000711450000
101X]
Vraná, A., Fabry, P., Kazdová, L., 1978. Liver glycogen syn-thesis and glucose tolerance in rats adapted to diets with a high proportion of fructose or glucose. Nutr. Metab.,
22(5):262-268. [doi:10.1159/000176221]
Waters, K.M., Ntambi, J.M., 1994. Insulin and dietary fructose induce stearoyl-CoA desaturase 1 gene expression of diabetic mice. J. Biol. Chem., 269(44):27773-27777. Wong, R.K., Pettit, A.I., Quinn, P.A., Jennings, S.C., Davies,
J.E., Ng, L.L., 2003. Advanced glycation end products stimulate an enhanced neutrophil respiratory burst medi-ated through the activation of cytosolic phospholipase A2 and generation of arachidonic acid. Circulation, 108(15): 1858-1864. [doi:10.1161/01.CIR.0000089372.64585.3B] Zammit, V.A., Waterman, I.J., Topping, D., McKay, G., 2001.
Insulin stimulation of hepatic triacylglycerol secretion and the etiology of insulin resistance. J. Nutr., 131(8): 2074-2077.
Recommended reading
Zhao, Z., Wu, T., Tang, H., Zhang, J., 2008. Influence of die-tary conjugated linoleic acid on growth, fatty acid com-position and hepatic lipogenesis in large yellow croaker (Pseudosciaena crocea R.). J. Zhejiang Univ.-Sci. B,
9(9):691-700. [doi:10.1631/jzus.B0820181]
Liu, W., Lai, S., Lu, L., Shi, F., Zhang, J., Liu, Y., Yu, B., Tao, Z., Shen, J., Li, G., Wang, D., Li, J., Tian, Y., 2011. Effect of dietary fatty acids on serum parameters, fatty acid compositions, and liver histology in Shaoxing laying ducks. J. Zhejiang Univ.-Sci. B (Biomed. & Biotechnol.),