Comparison of printed glycan array, suspension array
and ELISA in the detection of human anti-glycan antibodies
Tatiana Pochechueva&Francis Jacob&Darlene R. Goldstein&Margaret E. Huflejt&Alexander Chinarev&Rosemarie Caduff&Daniel Fink&Neville Hacker& Nicolai V. Bovin&Viola Heinzelmann-Schwarz
Received: 11 May 2011 / Revised: 25 August 2011 / Accepted: 30 August 2011 / Published online: 23 September 2011 # The Author(s) 2011. This article is published with open access at Springerlink.com
Abstract Anti-glycan antibodies represent a vast and yet insufficiently investigated subpopulation of naturally occur-ring and adaptive antibodies in humans. Recently, a variety of glycan-based microarrays emerged, allowing high-throughput profiling of a large repertoire of antibodies. As there are no direct approaches for comparison and evaluation of multi-glycan assays we compared three multi-glycan-based immuno-assays, namely printed glycan array (PGA), fluorescent microsphere-based suspension array (SA) and ELISA for their efficacy and selectivity in profiling glycan anti-bodies in a cohort of 48 patients with and without ovarian cancer. The ABO blood group glycan antigens were selected as well recognized ligands for sensitivity and specificity
assessments. As another ligand we selected P1, a member of the P blood group system recently identified by PGA as a potential ovarian cancer biomarker. All three glyco-immunoassays reflected the known ABO blood groups with high performance. In contrast, anti-P1 antibody binding profiles displayed much lower concordance. Whilst anti-P1 antibody levels between benign controls and ovarian cancer patients were significantly discriminated using PGA (p= 0.004), we got only similar results using SA (p=0.03) but not for ELISA. Our findings demonstrate that whilst assays were largely positively correlated, each presents unique characteristic features and should be validated by an independent patient cohort rather than another array
tech-Nicolai V. Bovin and Viola Heinzelmann-Schwarz contributed equally. T. Pochechueva
:
F. Jacob:
V. Heinzelmann-SchwarzTranslational Research Group, University Hospital Zurich, Zurich, Switzerland
F. Jacob
:
V. Heinzelmann-SchwarzGynaecological Cancer Group, Lowy Cancer Research Centre, Prince of Wales Clinical School and School of Women’s and Children’s Health, University of New South Wales, Sydney, Australia
D. R. Goldstein
Institut de Mathématiques, Ecole Polytéchnique Fédérale, Lausanne, Switzerland
D. R. Goldstein
Swiss Institute of Bioinformatics, Lausanne, Switzerland
M. E. Huflejt
Department of Cardiothoracic Surgery,
Division of Thoracic Surgery and Thoracic Oncology, New York University School of Medicine,
New York, NY, USA
A. Chinarev
:
N. V. BovinShemyakin-Ovchinnikov Institute of Bioorganic Chemistry, Russian Academy of Sciences,
Moscow, Russian Federation R. Caduff
Institute of Clinical Pathology, University Hospital Zurich, Zurich, Switzerland
D. Fink
Department of Gynecology, University Hospital Zurich, Zurich, Switzerland
N. Hacker
:
V. Heinzelmann-SchwarzGynecological Cancer Centre, Royal Hospital for Women and School of Women’s and Children’s Health,
Sydney, Australia
V. Heinzelmann-Schwarz (*)
Gynaecological Cancer Group, Adult Cancer Program, UNSW, C25,
Kensington, NSW 2052, Australia e-mail: viola@heinzelmann.ch
nique. The variety between methods presumably reflects the differences in glycan presentation and the antigen/antibody ratio, assay conditions and detection technique. This indicates that the glycan-antibody interaction of interest has to guide the assay selection.
Keywords Glycan array . Carbohydrate . Multiplex assay . Ovarian cancer
Abbreviations
AUC Area under the curve
Atri(GalNAcα1-3(Fucα1-2)Galβ-) A trisaccharide
BG Blood group
Btri(Galα1-3(Fucα1-2)Galβ-) B trisaccharide
CCC Concordance
correlation coefficient
Glyc-PAA Conjugate of glycan
with poly
[N-(2-hydroxyethyl) acrylamide]
Glyc-PAA-biot1 End biotin labeled
conjugate of glycan with poly[N-(2-hydroxyethyl) acrylamide]
ELISA Enzyme linked
immunosorbent assay
Glyc Glycan
MFI Median fluorescent
intensity
medTSI Median total signal
intensities
OD Optical density
PBS Phosphate buffered
saline
PGA Printed glycan array
ROC Receiver operating
characteristics
RT Room temperature
SA Suspension array
TACA Tumor associated
carbohydrate antigens
Introduction
Interactions of glycans, namely complex oligosaccharides attached to a protein or lipid mediate many important biological processes, such as pathogen recognition [1], malignant transformation [2], autoimmune disease [3], neurological disorders [4] and host-versus-graft rejection [5]. Naturally occurring and adaptive anti-glycan antibodies are currently the object of both basic research [6, 7] and biomarker discoveries [8–12].
Ovarian cancer is the sixth most common cause of cancer-related death of women and the leading cause of death from gynaecological malignancies [13]. Despite considerable efforts to improve early detection and advan-ces in chemotherapy, intra-abdominal metastasis remains a major challenge in the clinical management of undifferen-tiated high FIGO (International Federation of Gynecology and Obstetrics) stage serous ovarian cancers with an overall five-year survival of 20%. This poor overall prognosis is due to multiple factors including a lack of early symptoms and specific screening methods, ineffective therapy for advanced or recurrent disease, and from limited under-standing of the early-initiating events and stages of ovarian cancer development. Therefore, there is an urgent clinical need for a reliable, non-invasive and affordable serum-based screening test for ovarian cancers.
In a previous study we used the first custom-made high throughput printed glycan array (PGA, Cellexicon, San Diego, USA) and identified specific anti-glycan antibody patterns in blood of ovarian cancer patients compared to healthy controls [11]. Whilst it is known that aberrant glycosylations are found in most cancers, only a limited number of human antibodies towards tumor associated carbohydrate antigens (TACA) have been evaluated for their potential significance in cancer biology. The printed glycan array [6, 14] consists of a library of over 200 glycans, including well known TACA. Linear modelling revealed 24 carbohydrate structures for which the amount of anti-glycan antibodies was significantly lower in the above mentioned non-mucinous ovarian borderline and cancer cohort as compared to the healthy patient cohort. The glycan structure with the most significant discrimina-tory ability was P1(Galα1-4Galβ1-4GlcNAcβ; P<0.001), a member of the P blood group system.
In recent years a number of glycan based microarray platforms, based on specific (covalent or non-covalent) immobilization of chemically conjugated glycans on a modified surface, have been developed for high-throughput investigations of the glycome [15]. Glycan-based arrays vary in ligand presentation, glycan origin (isolated from natural sources or chemically synthesized), assay conditions, detec-tion method, microspheres (suspension array) and immobili-zation on flat surfaces (printed glycan array, ELISA); all of which contribute to the affinity and selectivity of binding [16,
17]. There is a crucial need for standardization and comparison between various forms of glycan microarrays, especially taking into account their proven scientific potential for translational research and subsequent clinical applications. The increasing number of high-throughput glycan array studies requires the application of different bioinformatical analyses for validation and comparison of datasets. However, to date, only a few reports comparing glycan microarrays and conventional ELISA have been performed. Most of these
studies only investigated them in terms of sample size, dynamic range and sensitivity of measurement (detection limits) [2,18–20].
In this present study, which is in line with our previous development of a glycan-based suspension array, we compared three glycan-immunoassays for the detection of the most complicated glycan-binding protein class; anti-bodies in human plasma. These assays include (1) printed glycan array; (2) multiplex flow cytometric suspension assay; and (3) regular direct ELISA, the most established method. Printed Glycan Array (PGA) as one of the newest high-throughput microarray technologies [6,14] allows the automated detection of an unlimited number of natural and synthesized glycans in one experimental setting. It is characterized by high sensitivity and a significant reduction of reagent consumption. The second approach, multiplex flow cytometric suspension assay (SA), incorporating fluorescent microspheres with distinct spectral addresses as a solid support for ligands, was recently developed for profiling of anti-glycan antibodies [9,21]. The advantage of this assay is reflected by the flexibility and simultaneous detection of multiple ligands in one sample with minimal reagent consumption. The third method, conventional direct ELISA [7, 19, 22, 23], which allows assessment of a limited number of glycan-protein interactions, is well established and currently the most widely used method for this type of application. In both the PGA and ELISA glycans are positioned onto a flat surface; in PGA glycans are covalently attached to the surface of a glass slide in a monovalent form as ω-alkyl glycosides (Glyc-sp-NH2), whereas in ELISA they are physically adsorbed to polystyrene in multivalent form, as conjugates with a polyacrylamide or albumin carrier. In the case of suspension array (SA), glycans are coupled as end-biotinylated glycopolymers [24] via streptavidin-biotin reaction to pre-modified fluorescent beads. All three glycan immunoassays display various detection specificities resulting in specific advantages and limitations. ELISA is most relevant for the investigation of a limited panel of glycans, and would be suitable for a preliminary survey of new glycan-binding partners. Printed glycan array allows broad glycan library screening, and suspension assay has advantages for the rapid and flexible multiplex detection of up to several dozen samples. Therefore, all three glycan assays could be used to study different aspects of glycan-antibody interactions.
We performed a comparative analysis using three glycan-based immunoassays for a cohort of 48 patients with and without ovarian cancer. Two target anti-glycan antibodies were selected, anti-blood group A/B trisaccharides [6,25–27] and our previously identified candidate P1in order to investigate the expected anti-glycan antibody distribution in plasma for each assay.
Material and methods
Clinical cohort
Blood samples were collected prospectively from 48 patients at the Department of Gynaecology, University Hospital Zurich, after written informed consent was given (Table 1). Ethical approval for this study was granted by the appropriate Ethical Board in 2006 (to V.H.S., SPUK Canton of Zurich, Switzerland). Two venous blood samples (12 mL) were collected pre-operatively per patient in EDTA blood tubes (BD Vacutainer®, 0.184M EDTA, BD Diagnostics, Franklin Lakes, US) and stored on ice until further processing. Blood samples were centrifuged at 3000g at 4°C for 10 min, and aliquots of the supernatant plasma frozen at −80°C. All collected blood samples were processed using the same protocol and within 3 h of their collection.
ELISA NUNC MaxiSorp 96-well immunoplates (Thermo Fisher Scientific, Roskilde, Denmark) were coated with Glyc-PAA (Lectinity Holdings, Moscow, Russia), 10 μg/ mL, 100μl per well in carbonate buffer (50 mM Na2CO3/ NaHCO3, pH 9.6) for 12 h at 4°C. Carbohydrate-free PAA was applied as negative control. Plates were blocked with 1% (w/v) BSA (Sigma-Aldrich Chemie GmbH, Buchs, Switzerland) in PBS for 40 min at 37°C and washed four times with PBS containing 0.5% (v/v) Tween-20 after incubation. Plasma samples were diluted 1:1000 in incuba-tion buffer (PBS, 0.3% (w/v) BSA, 0.02% (v/v) Tween 20), added to plates in duplicate and incubated for 60 min at 37°. Between each of the following steps plates were washed four times with PBS containing 0.5% (v/v) Tween-20: incubation with 100μl per well of goat anti-human Ig (IgA + IgG + IgM) conjugated to long chain biotin for 60 min at 37° (Pierce, Rockford, IL, USA, 0.16μg/mL in incubation buffer); streptavidin horse raddish peroxidase conjugate for 60 min at 37°C (Southern Biotechnology Associates, Inc., Birmingham, AL, USA, 0.083 μg/mL in Table 1 Clinicopathological characteristics. Patient numbers and percentage (in brackets)
Patient cohort (n=48)
Controls 24 (50.0)
Healthy controls 15 (31.3) Benign tumours 9 (18.7)
Cancers 24 (50.0)
Serous cancer Ovarian 16(31.3) Peritoneal 5 (10.4)
Tubal 3 (6.3)
FIGO Stage Stage I / II 3 (6.3) Stage III / IV 20 (41.7)
incubation buffer); and chromogen substrate 3,3′,5,5′-tetramethylbenzidine (Sigma-Aldrich Chemie GmbH, Buchs, Switzerland) for 5 min at RT. The peroxidase reaction was stopped by addition of equal volumes of 1M H2SO4. Absorbance was measured at 450 nm using a TECAN plate reader (Tecan Spectrafluor Plus, Tecan Trading AG, Männedorf, Switzerland).
Suspension array (SA) The Bio-Plex Suspension Array (Bio-Rad Laboratories, Hercules, CA, USA) is a multiplex analysis system that permits the simultaneous analysis of up to 100 different biomolecules in a single microplate well. The constituents of each well are drawn up into the flow-based Bio-Plex array reader, which quantifies each specific reaction based on its bead color using fluorescently labeled reporter molecules specific for each target protein followed by Bio-Plex Manager software data analysis. A 96-well Multiscreen HTS filter plate (Millipore Corp., Billerica, MA, USA) was soaked in 100 μl of antibody diluent for 5 min (PBS-0.05 M Tris, pH 7.2, 0.25% BSA, Sigma-Aldrich Chemie GmbH, Buchs, Switzerland). Antibody diluent incorporating 2000 beads/well (50 μl/well) was added. The plate was washed three times with 100 μl of washing buffer (PBS-0.05 M Tris, pH 7.2) using a vacuum manifold (Bio-Rad, Munich, Germany). Human samples were added in duplicates to wells (in antibody diluent 1:40 (50 μl/well)) and agitated at 1,100 rpm for 30 s on a microplate shaker before incubation on a shaker (200– 300 rpm) for 1 h at RT in the dark. After incubation, the plate was washed three times using washing buffer. Secondary antibodies (R-phycoerythrin conjugated goat anti-human Ig (IgM + IgG + IgA, H + L; Southern Biotechnology Associates Inc., Birmingham, AL, USA, 25 ng/well) were added and incubated for 30 min on the plate shaker in the dark. The plate was washed three times with washing buffer, beads were then resuspended and shaken for 30 s at 1,100 rpm in 100μl of washing buffer before being analyzed on the Bio-Plex array reader. Data were acquired in real time analyzing 100 beads by their median fluorescence intensitiy (MFI) using a computer software package (Bio-Plex Manager 4.1; Bio-Rad Laboratories, Hercules, CA, USA).
Coupling procedure The end-biotinylated glycopolymers for coupling to fluorescent microspheres, Glyc-PAA-biot1, were produced in-house (Laboratory of Carbohydrates, Shemyakin-Ovchinnikov Institute of Bioorganic Chemistry, Russian Academy of Sciences, Moscow, Russian Federation). Biotinylated glycopolymers were coupled to fluorescent carboxylated beads of 5.5μm diameter with distinct spectral “addresses” (Bio-Rad Laboratories Inc., Hercules, CA, USA). Each set of beads was embedded with a precise ratio of red and infrared fluorescent dyes allowing its identification by
measuring the intensities of the two classifier fluorochromes. The stock vial of microspheres (1.25×10⁷microspheres/mL) was vortexed for 30 s and sonicated for 30 s in a water bath prior its use. Bead suspension (100 μl; 1.25×10⁶ micro-spheres, 0.2 nmol –COOH groups in total, according to the supplier’s information) was centrifuged for 4 min, 14,000 g at RT. The pellet was resuspended in bead wash buffer (100μl; Bio-Plex amine coupling kit, Bio-Rad Laboratories Inc., Hercules, CA, USA) by vortexing and sonication, and washed by centrifugation as described above. After gentle removal of supernatant, the pellet was resuspended in 80μl of bead activation buffer (Plex amine coupling kit, Bio-Rad Laboratories Inc., Hercules, CA, USA), vortexed and sonicated. Sulfo-N-hydroxysuccinimide sodium salt (S-NHS) and 1-ethyl-3-[3,3-dimethylaminopropyl]carbodiimide hydro-chloride (EDC; Pierce Biotechnology, Rockford, IL, USA, both 50 mg/mL in activation buffer) were prepared immedi-ately prior to use, and 10μl of each solution was added to the bead suspension, followed by vortexing for 30 s. Beads were incubated on a vertical rotor in the dark for 20 min at RT. The activated beads were centrifuged and supernatant removed. The pellet was resuspended in 150μl biotin-solution (0.1 M NaHCO3, pH 8.3, containing 1μg (≈ 2 nmol) of biotin-NH (CH2)6NH2. Lectinity Holdings, Moscow, Russia) and incu-bated on a vertical rotor with medium speed for 2 h at RT in the dark. Obtained biotinylated beads were pelleted by centrifugation and resuspended in 150 μl of 50 mM ethanolamine (Sigma-Aldrich Chemie GmbH, Buchs, Swit-zerland) in 0.1 M NaHCO3, pH 9.0 to quench unbound activated groups. Beads, protected from light, were agitated on a rotator for 30 min at RT and centrifuged. The pellet was washed twice with 500μl PBS, pH 7.4 and resuspended in streptavidin-solution (400 pmol streptavidin in 150 μl PBS; Bio-Rad Laboratories Inc., Hercules, CA, USA). Suspended bead were vortexed and agitated on a rotator in the dark for 2 h at RT or 12 h at 4°C. Beads were washed twice with 500 μl PBS followed by centrifugation. Glyc-PAA-biot1 solutions in water (20 pmol end-biotin labeled Glyc-PAA, ∼30 kDa, Glyc contents - 20% mol) [24], were added with 1.25×10⁶ streptavidin-coated beads in 150 μl PBS to the reaction tubes. The mixture was protected from light and agitated on a rotator for 6 h at RT. Modified microspheres were centrifuged, supernatant removed and beads washed twice with 500 μl of bead storage buffer (Bio-Rad Laboratories Inc., Hercules, CA, USA). Beads were centrifuged and resuspended in 100 μl of bead storage buffer and concentration determined using a hemocytometer (Roth AG, Karlsruhe, Germany) before storing at 4°C, protected from light.
Printed glycan array (PGA) Printed glycan array slide fabrication and high-throughput profiling was performed as previously described [6, 11, 14]. Briefly, monomeric
glycans as ω-aminopropyl glycosides of 95–98% purity (Lectinity Holdings, Moscow, Russia) were diluted in 300 mM phosphate buffer pH 8.5, containing 0.005% Tween 20 and printed by robotic pin deposition on N-hydroxysuccinimide activated glass slides (Nexterion Slide H, Schott, Jena, Germany). Glycans were printed at a 50 μM concentration in eight replicates. Free N-hydrox-ysuccinimide activated groups were blocked with 50 mM ethanolamine in 50 mM borate buffer at a final pH of 9.2. Slides were then rinsed with deionized water, dried and stored at room temperature in a desiccator. Each plasma sample was diluted 1:15 with PBS containing 0.1% v/v Tween20 and 3% w/v BSA, thoroughly vortexed for 15 s and incubated at 37°C for 15 min to dissolve potential lipid aggregates. Samples were transferred to the array slides and gently rocked in a sealed humidified incubator for 2 h at 37°C. Unbound sample components were washed with a series of 0.1% and 0.001% Tween-20 in PBS. Antibody solution and goat anti-human IgA + IgG + IgM conjugated to long chain biotin (Pierce Biotechnology, Rockford, IL, USA, 1:100 (20μg/mL) in PBS containing 0.1% Tween-20 and 3% BSA) was added. Slides were incubated at RT in a humidified chamber for 45 min and then washed. Bound antibodies were visualized by incubating slides with fluorescent dye streptavidin solution (Alexa Fluor555, Molecular Probes, Invitrogen, Carlsbad, CA, USA, 1:1000 in PBS/0.1% Tween-20) at RT for 30 min. Fluorescence signals corresponding to glycan-bound antibodies were measured and quantified using ImaGene analysis software version 6.1 and 7.5 (BioDiscovery, El Segundo, USA). Signals were measured as total signal intensity (medTSI) per glycan and were expressed as median across eight intra-array replicates. In a prior discovery approach we screened plasma of non-mucinous ovarian cancer patients in com-parison to healthy controls and revealed anti-P1antibodies to be the most specific differentiating anti-glycan antibody. Apart from the standard ABO blood group system we have therefore used anti-P1 in this comparative analysis as an example of a new biomarker identified by PGA only.
Controls and validation procedures
Due to the known high expression levels in healthy controls α-rhamnose was used as a “positive biological control” in the PGA experiments [10]. Aminoglucitol, an opened reduced form of D-glucose which is not present as a structural component of regular glycosylation, has shown to be negative for anti-glycan binding at similar values to the technical background [6, 11]. We therefore used it as a negative biological control in both PGA and SA experi-ments, where MFI signals for aminoglucitol binding did not exceed 200 and were close to the technical cut-off in all
individual samples (data not shown). A glycan-free poly-mer (PAA) was used in ELISA as a control for non-specific binding and displayed lower signals than the lowest signals for Glyc-PAA coating in all cases (data not shown). Human polyclonal antibodies against A/B blood group antigens were used to test the coupling effectiveness in SA. Anti-glycan antibodies were purified from pooled human plasma of the same blood group using affinity chromatography as previously described [7, 21]. Polyclonal glycan anti-bodies bound to cognate glycans in a dose-dependent manner displayed no or very low cross-reactivity to other glycans in both SA and ELISA (data not shown).
Anti-A/B antibody screening
The well known ABO blood group carbohydrate antigens were used as a model for the comparison of our three glycan immunoassays. ABO-specific antibodies (isohaemagglutinins) belong to a group of naturally occurring antibodies [28] which can be detected by the haemagglutination test, ELISA [22,
23] and flow cytometry [29]. Blood group information was available for 31 patients, of whom 13 patients had blood group A (41.9%), 6 patients blood group B (19.3%), 2 patients blood group AB (6.4%) and 10 patients blood group O (32.2%). Antibody profiles for Atri(GalNAcα1-3 (Fucα1-2)Galβ) and Btri (Galα1-3(Fucα1-2)Galβ) blood group antigens were generated using SA, ELISA and PGA. Raw data were acquired for all technologies in different units; values varied from 74 to 13595 (MFI, SA), from 0.152 to 2.305 (OD, 450 nm, ELISA) and from 0 to 51.28*105 (medTSI, PGA). Anti-A/B antibody levels were calculated as distribution of the median and additional median absolute deviation.
Statistical analysis
In the combination of three different immuno-assays one of the major problems is the absence of a ‘gold’ standard method, which means there is no experimental approach available, which can be taken as a norm of measuring anti-glycan antibodies. Neither has an internal standard nor a background threshold been established , and the data values achieved in each method are independent from each other, which make the direct comparison impossible: (A) ELISA values reflect the oxidized product of the chromogen TMB (3, 3′, 5, 5′-tetramethylbenzidine) and is a substrate conversion based on an enzymatic reaction; (B) printed glycan array (PGA) and suspension array (SA) (R-phyco-erythrin) results are achieved due to fluorescence measure-ments. These differences lead to data values, which require data mining before method comparison. When dealing with parameters of different units and scales it is very important to standardize or normalize data in order to allow for a
reliable comparison. Here we used standardization of data as it transforms datasets into a mean zero and a unit variance and keeps ranges similar and variables different. This is also the most commonly used method for normalization and compar-ison of methods incorporating differing datasets. Whilst PGA data were pre-processed [6], SA raw data were log-transformed to improve interpretability and visualization. To solve the problem of different data values, all data sets were standardized as follows: z=(xi– xmean)/xsd.Standardized data (z) were generated for each vector data set (xi) by subtraction by their mean (xmean) and division of their standard deviation (xsd), and called ‘standardized antibody measurements’ (SAM). Combined graphical and statistical interpretations of method-comparison studies were performed and included scatter plots combined with correlation and regression analysis [30]. Data analysis, including calculation of mean, median, standard deviation and coefficient of variation was performed using the open source statistical programming language R (http://CRAN.R-project.org/, version 2.8.1). Statistically sig-nificant differences were proved for each method by the Wilcoxon rank sum test or student t test. Concordance correlation coefficients (rCCC) [31], which evaluate the degree to which pairs of observations fall on the 45° line through the origin, were calculated and compared within all independent methods (R package epiR). Direct comparison of two methods was performed using parametric linear regression [32,33]. Non-parametric testing of median signals among all known blood groups was measured using the Kruskal-Wallis rank sum test. For comparisons of high versus low anti-glycan antibody levels in correlation with known blood groups, sensitivity, specificity and area under the curve (AUC) were calculated for each method (R package ROCR [34]). The best cut-off between observed false negative and false positive values was described as the “precision-recall break-even point” [34], the point at which precision equals recall and predictions are made due to the prevalence within the data given. All p-values<0.05 were taken as significant.
Results
Detection of anti-A and anti-B antibodies
Using PGA, we observed higher antibody binding levels for Btri than for Atri with higher individual variability of the latter, consistent with the literature [6]. The same pattern was observed in ELISA, followed by lower individual variability of both anti-glycan antibodies, indicated by median absolute deviation (data not shown). In contrast to PGA and ELISA, data using SA revealed no significant difference between general levels of anti-A and anti-B antibody binding, accompanied by higher individual variability in anti-A antibody binding.
Direct comparison of all three methods, based on scatter plots and linear regression model revealed a pattern of positive correlation, ranging from moderate to high (Fig.1). The observations were found to be subject (here: glycan) independent, which was indicated by absence of difference in both linear regression models in all three binary comparisons. The highest Concordance Correlation Coef-ficients (rccc) was observed between PGA and SA (Fig. 1, with rccc 0.83 for Atri and 0.70 for Btri). These positive correlations were displayed by the proximity of linear regression lines to the equality line for both antigens. Moderate correlation was observed for ELISA and SA in Atri and Btri antigens (rccc 0.68 and 0.71, respectively, Fig. 1), with the weakest correlation between ELISA and PGA (rccc of 0.54 (Atri) and 0.41 (Btri)). Anti-glycan antibody levels correlated significantly with each other across all three methods (p<0.05). In PGA vs. SA and ELISA vs. PGA the correlation characteristics were slightly more pronounced for A antigen than for B antigen, which is indicated by higher rcccvalues (rcccof 0.83 vs. 0.7 in PGA vs. SA and 0.54 vs. 0.41 in ELISA vs. PGA, Fig.1).
Discrimination between ABO blood groups
To define how various assays distinguish between blood groups, we performed non-parametric tests for all three data sets. All glycan-based immunoassays were able to distin-guish between blood groups (Fig. 2). As expected, highly significant differences (p<0.01) between the known blood group antigens A and B were found in each applied method (SA, ELISA and PGA). Strong discrimination of antibody levels for Atri was observed in all three methods with the highest detected by suspension array (SA, p<0.0001; PGA, p=0.0004; ELISA, p=0.0004). Less significant discrimina-tion in all three assays were found for Btri(SA, p=0.0058; PGA, p=0.006, ELISA p=0.013). Distribution of anti-A/B antibodies using a pool of immunoglobulin subtypes (IgG, IgA, and IgM) were concordant with classical haemagglu-tination data [35]. The accuracy of all applied assays to discriminate between expected anti-glycan antibody levels was evaluated by ROC curves. Based on Atrias a binary classifier, data from blood groups with low anti-A antibody levels (BG A and AB) were combined, as were the data from BG with higher anti-A antibody levels (BG B and O). In contrast, data from blood groups B and AB versus blood groups A and O were combined for comparison, based on Btrias the binary classifier. Sensitivity, specificity and Area Under the Curve (AUC) were calculated for each assay as a measure for discriminatory power. Hereby, SA revealed the best discrimination between low and high anti-A antibody levels with excellent selectiveness (sensitivity 93.3%, specificity 93.7%, AUC 0.96; Fig.2c). An equal sensitivity, specificity and AUC of 0.95 was achieved for ELISA; PGA
revealed a comparably lower sensitivity (86.7%), specificity (87.5%) and AUC (0.93). Interestingly, the overall pattern changed in anti-B antibody levels, and sensitivity, specificity and AUC values decreased for all three methods (PGA, AUC 0.85; SA, AUC 0.87; ELISA, AUC 0.78, respectively) (Fig.2d).
Expression of ovarian cancer biomarker P1trisaccharide
Based on the findings that anti-A and anti-B antibody profiles represent an assay independent pattern we further investigated one potential ovarian cancer biomarker, which was previously identified by us using PGA in a discovery Fig. 1 Comparison of glycan-based immunoassays using ABO blood
groups. Scatter plots demonstrating the correlation between printed glycan array, suspension array and ELISA. The x- and y- axes represent standardized signals for each method, the dashed line indicates linear regression for Atri(empty dots) and dotted line for Btri(filled dots). The
solid line indicates intercept of 0 and slope of 1. Each dot is represented by two-method measurement of one plasma sample (n=31). Rccc
represents concordance correlation coefficient per blood group including the 95% confidence interval in brackets
Fig. 2 Binding of plasma anti-A/B antibodies to Atriand Btri. Boxplots
generated for SA (suspension array), PGA (printed glycan array) and ELISA, demonstrate the distribution of anti-glycan antibodies to glycans Atri(a) and Btri(b). Blood groups are shown on the x-axis, standardized
signals for each method are on the y-axis. Kruskal-Wallis p-values
indicate the equality of population medians among blood groups. ROC curves for blood groups A and AB (low anti-A antibody levels) versus B and O (high anti-A antibody levels) were determined by SA, PGA and ELISA (c). Data from blood group B and AB versus blood group A and O were combined respectively (d)
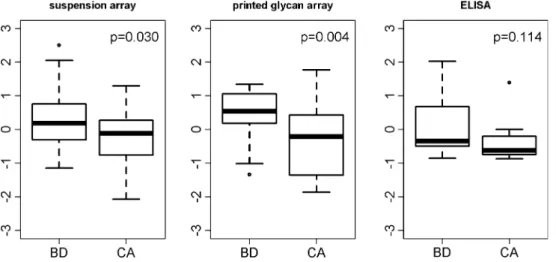
approach; antigen P1 (Galα1-4Galβ1-4GlcNAcβ) [11]. In order to approach this question with appropriate com-parative numbers, we increased the cohort of 31 patients where blood groups were known to a cohort of 48 samples, including 23 undifferentiated serous cancer patients of ovarian, tubal and peritoneal origin, totaling to 24 benign and 24 cancer cases (Table1). Glycan-based assays were plotted against each other and their relation-ship determined by linear regression analysis. In compar-ison to the ABO assays, anti-P1 correlations across the three assays appeared to be much weaker. The comparison between PGA and SA showed the highest correlation (rccc = 0.55 for the entire cohort, 0.58 for benign and 0.43 for malignant samples, Fig. 3). The discrimination between control and cancer patients showed the same trend in both SA and PGA with lower anti-P1 antibody levels in the cancer cohort (p = 0.03 and p = 0.004, respectively, Fig.3). No improvement in discrimination could be achieved in the comparisons of PGA or SA with ELISA assay (Fig.3).
Discussion
In the current study, which is in continuity of two previous publications of ours using both a newly described PGA and SA [11, 21], we investigated the efficacy and selectivity of three custom-developed immunoassays to profile anti-glycan antibodies in individual human plasma samples. All three methods adequately reflected the known serological isohaemagglutinin distribution within ABO blood groups, with the best being SA and PGA. The correlation between all three assays was more distinctive for the detection of anti A-antibodies than for anti-B antibodies. Our results indicate that anti-A/B blood group
antibodies positively correlated with each other and that all glycan immunoassays could detect these with statistical significance. They demonstrated method-independent ten-dencies due to their high affinity, which reflects their strong biological importance even in a small patient cohort [26].
In contrast, anti-P1 correlations across the three assays were considerably less pronounced although it was primarily detected by PGA with the highest discriminative power in a discovery approach in non-mucinous ovarian cancers. Nevertheless, with equal control to cancer patient numbers we did improve the correlation of this cancer-specific marker for the comparison of PGA and SA.
The discrepancy between PGA and the other two glycan immunoassays could reflect differences in the assay design, like glycan display, density and surface presentation, as well as the various assay conditions such as temperature, serum dilution, static/dynamic characteristics, and antigen/ antibody ratio (Table 2). The most dramatic difference between all three assays appears to be the antibody/antigen ratio. There is an excess of antibodies over antigen in PGA only, whereas in ELISA and SA the ratio of antigen/ antibody is opposite (Table 2). As a result, in these two assays all antibodies of a particular specificity are allowed to bind to their glycan ligands on the array. Thus, ELISA and SA are more susceptible to promiscuous binding than PGA, where a competition between antibodies takes place. Additional factors, which play a role in the different binding patterns of the three methods include: 1) temper-ature; 2) polyethylene glycol (PEG) linking of glycans (in PGA) reducing nonspecific binding similarly to a“stealth” effect in PEGylated liposomes [36]; 3) flow conditions of SA; 4) random mutual orientation of glycans in a polymeric display (SA and ELISA) in contrast to more restricted
Fig. 3 Anti-P1 antibody levels in suspension array and printed
glycan array. Boxplots demonstrate the distribution of anti-glycan antibodies directed to P1in benign control (n = 24; BD) and cancer
plasma samples (n = 24; CA) for suspension and printed glycan arrays as well as ELISA
orientation of glycans in a PGA monolayer (Table2). This could indicate that PGA has advantages compared to the other two glycan immunoassays; certainly it demonstrates that each method strongly depends on the task it is used for, taking into account the advantages as well as limitations. SA and PGA both require a lower amount of glycans (at least three orders of magnitude) and SA needs even lower quantities of glycan-binding proteins. Whilst SA and ELISA have a broader flexibility and allow assay reconfigurations, PGA is exceptionally convenient for screening large numbers of yet biologically unknown glycans besides demonstrating low background and a wide dynamic range. Whilst PGA is ideal for a discovery approach, suspension array, which is based on glycosylated fluorescent beads [21] seems ideal for the diagnostic analysis of human plasma anti-bodies in a clinical setting. In biomarker discovery studies
the use of only one assay with appropriate sensitivity, specificity and reproducibility might be sufficient if validation is performed in a second independent patient cohort. In contrast, crucial conclusions based on data from one assay might not be sufficient in the case of basic research, as each glycan could be showing physiologically important patterns only in one of the other assays. As each method allows a different view into the investigation and specificity of glycan binding patterns [6, 37] or motif-based analysis of specific glycan-binding proteins [38], the cumulative method approach seems more preferable. Whilst in datasets obtained with a discovery PGA approach, ELISA and SA assays might be suggested as validation methods, they should be considered as highly controversial and not concordant due to essential differ-ences in assaying conditions.
Table 2 Comparative conditions of anti-glycan immunoassays
Glycan Glycan Glycan poly[N-(2-hydroxyethyl)acrylamide] Glycan Glycan Glycan -Glycan NHS coated surface
Glycan Glycan Glycan Glycan Glycan GlycanGlycan GlycanGlycan GlycanGlycan GlycanGlycan GlycanGlycan GlycanGlycan Glycan Glycan Glycan Glycan Glycan Glycan fluorescent microspheres streptavidin biotin Glycan Glycan Glycan Glycan Glycan Glycan Glycan Glycan Glycan Glycan Glycan Glycan Glycan Glycan fluorescent microspheres streptavidin 37°C 37°C 20°C
static static flow
polymeric dense monomeric polymeric ~10 glycans 200-400 glycans ~10-20 glycans
1:1,000 1:15 1:40
10 fmol/mL 700 fmol/mL 250 fmol/mL
0.1 fmol 100 fmol 10 fmol
10,000 fmol per
well*** 10 fmol per spot
1,000 fmol per well (2000 beads)
1:100,000 10:1 1:100
*According to experiments on glycan affinity isolation the range of highest rank human antibodies lies in 1–10 microgram per mL interval (P. Obukhova et al., Glycoconj J, submitted)
**Calculated for 0.1 mL well in ELISA, 1 mL working volume of sample applied onto microchip, and 50μl of sample for SA ***[39]
Acknowledgments This work was supported by Oncosuisse (02115-08-2007 to V.H.S.); Swiss National Foundation (320000-12543 to V.H.S.; PBZHP3-133289 to F.J.); European Science Foundation (V.H.S.); Cancer Institute NSW (09/CRF/2-02 to V.H.S.); Mary Elizabeth Courier Research Scholarship, RANZCOG (to V.H.S.); William Maxwell Trust (to V.H.S.); Cellexicon, Inc. La Jolla, CA, USA (to M.E.H.); National Cancer Institute, USA, grant 1U01CA128526 (to M.E.H); RAS Presidium Program‘Molecular and Cell Biology’ (to N.V.B.) and State grant #2011-1.2-512-013-008 (to N.V.B.).
Open Access This article is distributed under the terms of the Creative Commons Attribution Noncommercial License which permits any noncommercial use, distribution, and reproduction in any medium, provided the original author(s) and source are credited.
References
1. de Boer, A.R., Hokke, C.H., Deelder, A.M., Wuhrer, M.: Serum antibody screening by surface plasmon resonance using a natural glycan microarray. Glycoconj. J. 25(1), 75–84 (2008)
2. Wang, C.C., Huang, Y.L., Ren, C.T., Lin, C.W., Hung, J.T., Yu, J. C., Yu, A.L., Wu, C.Y., Wong, C.H.: Glycan microarray of Globo H and related structures for quantitative analysis of breast cancer. Proc. Natl. Acad. Sci. U. S. A. 105(33), 11661–11666 (2008) 3. Dotan, I., Fishman, S., Dgani, Y., Schwartz, M., Karban, A.,
Lerner, A., Weishauss, O., Spector, L., Shtevi, A., Altstock, R.T., Dotan, N., Halpern, Z.: Antibodies against laminaribioside and chitobioside are novel serologic markers in Crohn’s disease. Gastroenterology 131(2), 366–378 (2006)
4. Brettschneider, J., Jaskowski, T.D., Tumani, H., Abdul, S., Husebye, D., Seraj, H., Hill, H.R., Fire, E., Spector, L., Yarden, J., Dotan, N., Rose, J.W.: Serum anti-GAGA4 IgM antibodies differen-tiate relapsing remitting and secondary progressive multiple sclerosis from primary progressive multiple sclerosis and other neurological diseases. J. Neuroimmunol. 217(1–2), 95–101 (2009)
5. Galili, U.: Significance of anti-Gal IgG in chronic xenograft rejection. Transplant. Proc. 31(1–2), 940–941 (1999)
6. Huflejt, M.E., Vuskovic, M., Vasiliu, D., Xu, H., Obukhova, P., Shilova, N., Tuzikov, A., Galanina, O., Arun, B., Lu, K., Bovin, N.: Anti-carbohydrate antibodies of normal sera: findings, surprises and challenges. Mol. Immunol. 46(15), 3037–3049 (2009)
7. Obukhova, P., Rieben, R., Bovin, N.: Normal human serum contains high levels of anti-Gal alpha 1-4GlcNAc antibodies. Xenotransplantation 14(6), 627–635 (2007)
8. Blixt, O., Clo, E., Nudelman, A.S., Sorensen, K.K., Clausen, T., Wandall, H.H., Livingston, P.O., Clausen, H., Jensen, K.J.: A high-throughput O-glycopeptide discovery platform for seromic profiling. J. Proteome. Res. 9(10), 5250–5261 (2010)
9. Bovin, N.V., Huflejt, M.E.: Unlimited glycochip. Trends Glycosci. Glycotechnol. 20(115), 245–258 (2008)
10. Dotan, N., Altstock, R.T., Schwarz, M., Dukler, A.: Anti-glycan antibodies as biomarkers for diagnosis and prognosis. Lupus 15 (7), 442–450 (2006)
11. Jacob, F., Goldstein, D.R., Bovin, N.V., Pochechueva, T., Spengler, M., Caduff, R., Fink, D., Vuskovic, M.I., Huflejt, M.E., Heinzelmann-Schwarz, V.: Serum anti-glycan antibody detection of non-mucinous ovarian cancers by using a printed glycan array. Int. J. Cancer epub, (2011)
12. Wandall, H.H., Blixt, O., Tarp, M.A., Pedersen, J.W., Bennett, E.P., Mandel, U., Ragupathi, G., Livingston, P.O., Hollingsworth, M. A., Taylor-Papadimitriou, J., Burchell, J., Clausen, H.: Cancer biomarkers defined by autoantibody signatures to aberrant O-glycopeptide epitopes. Cancer Res. 70(4), 1306–1313 (2010)
13. Ries, L.A.G., Harkins, D., Krapcho, M., Mariotto, A., Miller, B. A., Feuer, E.J., Clegg, L., Eisner, M.P., Horner, M.J., Howlader, N., Hayat, B.F., Hankey, B.F., Edwards, B.K.: SEER Cancer Statistics Review, 1975–2000. National Cancer Institute. Bethesda, MD.http://seer.cancer.gov/csr/1975_2003/(2006) 14. Blixt, O., Head, S., Mondala, T., Scanlan, C., Huflejt, M.E., Alvarez,
R., Bryan, M.C., Fazio, F., Calarese, D., Stevens, J., Razi, N., Stevens, D.J., Skehel, J.J., van Die, I., Burton, D.R., Wilson, I.A., Cummings, R., Bovin, N., Wong, C.H., Paulson, J.C.: Printed covalent glycan array for ligand profiling of diverse glycan binding proteins. Proc. Natl. Acad. Sci. U. S. A. 101(49), 17033–17038 (2004)
15. Culf, A.S., Cuperlovic-Culf, M., Ouellette, R.J.: Carbohydrate microarrays: survey of fabrication techniques. Omics 10(3), 289– 310 (2006)
16. Lewallen, D.M., Siler, D., Iyer, S.S.: Factors affecting protein-glycan specificity: effect of spacers and incubation time. ChemBioChem 10 (9), 1486–1489 (2009)
17. Oyelaran, O., Li, Q., Farnsworth, D., Gildersleeve, J.C.: Microarrays with varying carbohydrate density reveal distinct subpopulations of serum antibodies. J. Proteome Res. 8(7), 3529–3538 (2009) 18. de Jager, W., Rijkers, G.T.: Solid-phase and bead-based cytokine
immunoassay: a comparison. Methods 38(4), 294–303 (2006) 19. Galanina, O.E., Mecklenburg, M., Nifantiev, N.E., Pazynina, G.V.,
Bovin, N.V.: GlycoChip: multiarray for the study of carbohydrate-binding proteins. Lab Chip 3(4), 260–265 (2003)
20. Willats, W.G., Rasmussen, S.E., Kristensen, T., Mikkelsen, J.D., Knox, J.P.: Sugar-coated microarrays: a novel slide surface for the high-throughput analysis of glycans. Proteomics 2(12), 1666– 1671 (2002)
21. Pochechueva, T., Chinarev, A., Spengler, M., Korchagina, E., Heinzelmann-Schwarz, V., Bovin, N., Rieben, R.: Multiplex suspension array for human anti-carbohydrate antibody profiling. Analyst 136(3), 560–569 (2010)
22. Buchs, J.P., Nydegger, U.E.: Development of an ABO-ELISA for the quantitation of human blood group anti-A and anti-B IgM and IgG antibodies. J. Immunol. Methods 118(1), 37–46 (1989) 23. Rieben, R., Buchs, J.P., Fluckiger, E., Nydegger, U.E.: Antibodies
to histo-blood group substances A and B: agglutination titers, Ig class, and IgG subclasses in healthy persons of different age categories. Transfusion 31(7), 607–615 (1991)
24. Chinarev, A.A., Galanina, O.E., Bovin, N.V.: Biotinylated multi-valent glycoconjugates for surface coating. Methods Mol. Biol. 600, 67–78 (2010)
25. Oyelaran, O., McShane, L.M., Dodd, L., Gildersleeve, J.C.: Profiling human serum antibodies with a carbohydrate antigen microarray. J. Proteome Res. 8(9), 4301–4310 (2009)
26. Watkins, W.M.: The ABO blood group system: historical background. Transfus. Med. 11(4), 243–265 (2001)
27. Yamamoto, F.: Review: ABO blood group system–ABH oligosac-charide antigens, anti-A and anti-B, A and B glycosyltransferases, and ABO genes. Immunohematology 20(1), 3–22 (2004) 28. Landsteiner, K.: Ueber Agglutinationserscheinungen normalen
menschlichen Blutes. Wiener klinische Wochenschau 14, 1132– 1134 (1901)
29. Stussi, G., Huggel, K., Lutz, H.U., Schanz, U., Rieben, R., Seebach, J.D.: Isotype-specific detection of ABO blood group antibodies using a novel flow cytometric method. Br. J. Haematol. 130(6), 954–963 (2005)
30. Westgard, J.O., Hunt, M.R.: Use and interpretation of common statistical tests in method-comparison studies. Clin. Chem. 19(1), 49–57 (1973)
31. Lin, L.I.: A concordance correlation coefficient to evaluate reproducibility. Biometrics 45(1), 255–268 (1989)
32. Chambers, J.: Linear models. Chapter 4 of Statistical Models in S. Wadsworth & Brooks/Cole, (1992)
33. Wilkinson, G.N., Rogers, C.: Symbolic descriptions of factorial models for analysis of variance. Appl. Stat. 22, 392–399 (1973) 34. Sing, T., Sander, O., Beerenwinkel, N., Lengauer, T.: ROCR:
visualizing classifier performance in R. Bioinformatics 21(20), 3940–3941 (2005)
35. Brecher, M.E.: American association of blood banks, technical manual, 14th edn. American Association of Blood Banks, Bethesda (2002) 36. Wattendorf, U., Merkle, H.P.: PEGylation as a tool for the
biomedical engineering of surface modified microparticles. J. Pharm. Sci. 97(11), 4655–4669 (2008)
37. Gout, E., Garlatti, V., Smith, D.F., Lacroix, M., Dumestre-Perard, C., Lunardi, T., Martin, L., Cesbron, J.Y., Arlaud, G.J.,
Gaboriaud, C., Thielens, N.M.: Carbohydrate recognition properties of human ficolins: glycan array screening reveals the sialic acid binding specificity of M-ficolin. J. Biol. Chem. 285(9), 6612–6622 (2010)
38. Porter, A., Yue, T., Heeringa, L., Day, S., Suh, E., Haab, B.B.: A motif-based analysis of glycan array data to determine the specificities of glycan-binding proteins. Glycobiology 20(3), 369–380 (2010)
39. Shilova, N.V., Galanina, O.E., Pochechueva, T.V., Chinarev, A.A., Kadykov, V.A., Tuzikov, A.B., Bovin, N.V.: High molecular weight neoglycoconjugates for solid phase assays. Glycoconj. J. 22, 43–51 (2005)