HAL Id: inserm-00663936
https://www.hal.inserm.fr/inserm-00663936
Submitted on 27 Jan 2012
HAL is a multi-disciplinary open access
archive for the deposit and dissemination of
sci-entific research documents, whether they are
pub-lished or not. The documents may come from
teaching and research institutions in France or
abroad, or from public or private research centers.
L’archive ouverte pluridisciplinaire HAL, est
destinée au dépôt et à la diffusion de documents
scientifiques de niveau recherche, publiés ou non,
émanant des établissements d’enseignement et de
recherche français ou étrangers, des laboratoires
publics ou privés.
Blanca Herrera, Helen Lockstone, Jennifer Taylor, Quin Wills, Pamela
Kaisaki, Amy Barrett, Carme Camps, Christina Fernandez, Jiannis Ragoussis,
Dominique Gauguier, et al.
To cite this version:
Blanca Herrera, Helen Lockstone, Jennifer Taylor, Quin Wills, Pamela Kaisaki, et al..
MicroRNA-125a is over-expressed in insulin target tissues in a spontaneous rat model of Type 2 Diabetes.. BMC
Medical Genomics, BioMed Central, 2009, 2 (1), pp.54. �10.1186/1755-8794-2-54�. �inserm-00663936�
Open Access
Research article
MicroRNA-125a is over-expressed in insulin target tissues in a
spontaneous rat model of Type 2 Diabetes
Blanca M Herrera
†1,2, Helen E Lockstone
†1, Jennifer M Taylor
1, Quin F Wills
3,
Pamela J Kaisaki
1, Amy Barrett
2, Carme Camps
1, Christina Fernandez
1,
Jiannis Ragoussis
1, Dominique Gauguier
1,4, Mark I McCarthy
1,2and
Cecilia M Lindgren*
1,2Address: 1Wellcome Trust Centre for Human Genetics, University of Oxford, Roosevelt Drive, Oxford, OX3 7BN, UK, 2Oxford Centre for Diabetes, Endocrinology and Metabolism, The Churchill Hospital, Headington, Oxford, OX3 7LJ, UK, 3Department of Statistics, 1 South Parks Road, Oxford, OX1 3TG, UK and 4INSERM U872, Centre de Recherche des Cordeliers, Rue de l'Ecole de Medecine, 75006 Paris, France
Email: Blanca M Herrera - blanca@well.ox.ac.uk; Helen E Lockstone - hel23@well.ox.ac.uk; Jennifer M Taylor - jmtaylor@well.ox.ac.uk; Quin F Wills - wills@stats.ox.ac.uk; Pamela J Kaisaki - pamela.kaisaki@well.ox.ac.uk; Amy Barrett - amy.barrett@drl.ox.ac.uk;
Carme Camps - carme.camps@well.ox.ac.uk; Christina Fernandez - cristina.fernandez@well.ox.ac.uk;
Jiannis Ragoussis - oannisr@well.ox.ac.uk; Dominique Gauguier - gdomi@well.ox.ac.uk; Mark I McCarthy - mark.mccarthy@drl.ox.ac.uk; Cecilia M Lindgren* - celi@well.ox.ac.uk
* Corresponding author †Equal contributors
Abstract
Background: MicroRNAs (miRNAs) are non-coding RNA molecules involved in
post-transcriptional control of gene expression of a wide number of genes, including those involved in glucose homeostasis. Type 2 diabetes (T2D) is characterized by hyperglycaemia and defects in insulin secretion and action at target tissues. We sought to establish differences in global miRNA expression in two insulin-target tissues from inbred rats of spontaneously diabetic and normoglycaemic strains.
Methods: We used a miRNA microarray platform to measure global miRNA expression in two
insulin-target tissues: liver and adipose tissue from inbred rats of spontaneously diabetic (Goto-Kakizaki [GK]) and normoglycaemic (Brown-Norway [BN]) strains which are extensively used in genetic studies of T2D. MiRNA data were integrated with gene expression data from the same rats to investigate how differentially expressed miRNAs affect the expression of predicted target gene transcripts.
Results: The expression of 170 miRNAs was measured in liver and adipose tissue of GK and BN
rats. Based on a p-value for differential expression between GK and BN, the most significant change in expression was observed for miR-125a in liver (FC = 5.61, P = 0.001, Padjusted = 0.10); this overexpression was validated using quantitative RT-PCR (FC = 13.15, P = 0.0005). MiR-125a also showed over-expression in the GK vs. BN analysis within adipose tissue (FC = 1.97, P = 0.078,
Padjusted = 0.99), as did the previously reported miR-29a (FC = 1.51, P = 0.05, Padjusted = 0.99). In-silico tools assessing the biological role of predicted miR-125a target genes suggest an over-representation of genes involved in the MAPK signaling pathway. Gene expression analysis identified 1308 genes with significantly different expression between GK and BN rats (Padjusted < Published: 18 August 2009
BMC Medical Genomics 2009, 2:54 doi:10.1186/1755-8794-2-54
Received: 2 October 2008 Accepted: 18 August 2009 This article is available from: http://www.biomedcentral.com/1755-8794/2/54
© 2009 Herrera et al; licensee BioMed Central Ltd.
This is an Open Access article distributed under the terms of the Creative Commons Attribution License (http://creativecommons.org/licenses/by/2.0), which permits unrestricted use, distribution, and reproduction in any medium, provided the original work is properly cited.
0.05): 233 in liver and 1075 in adipose tissue. Pathways related to glucose and lipid metabolism were significantly over-represented among these genes. Enrichment analysis suggested that differentially expressed genes in GK compared to BN included more predicted miR-125a target genes than would be expected by chance in adipose tissue (FDR = 0.006 for up-regulated genes; FDR = 0.036 for down-regulated genes) but not in liver (FDR = 0.074 for up-regulated genes; FDR = 0.248 for down-regulated genes).
Conclusion: MiR-125a is over-expressed in liver in hyperglycaemic GK rats relative to
normoglycaemic BN rats, and our array data also suggest miR-125a is over-expressed in adipose tissue. We demonstrate the use of in-silico tools to provide the basis for further investigation of the potential role of miR-125a in T2D. In particular, the enrichment of predicted miR-125a target genes among differentially expressed genes has identified likely target genes and indicates that integrating global miRNA and mRNA expression data may give further insights into miRNA-mediated regulation of gene expression.
Background
MicroRNAs (miRNAs) are short (~22 nucleotides) non-coding RNA molecules that regulate gene expression at a post-transcriptional level through sequence alignment mechanisms. MiRNA molecules bind to the 3' untrans-lated region (UTR) of their target mRNAs and can cause either mRNA degradation or translational repression, resulting in reduced protein expression [1] or transla-tional activation depending on cell cycle stage [2]. Degra-dation of mRNA seems to be favoured if the binding occurs with perfect sequence complementarity and is widely observed in plant miRNAs [3,4]. A variety of stud-ies have demonstrated that regulation at the mRNA level also occurs for animal miRNAs [5,6]. Microarray-based experiments have shown that overexpression of specific miRNAs in human cells down-regulates many transcripts predicted to bind the miRNA molecule [6-8]. Conversely, silencing of endogenous miR-122 in mice caused the pref-erential up-regulation of transcripts containing miR-122 binding sites [9].
MiRNA expression levels are thought to contribute to tis-sue-specific gene expression patterns [10] and computa-tional approaches to integrating miRNA and gene expression data have provided insights into miRNA-mRNA interactions [11,12]. A single miRNA molecule can affect the expression of many target genes and therefore miRNAs are thought to be involved in the regulation of a wide variety of normal biological processes [13].
Type 2 diabetes (T2D) is characterized by hyperglycaemia that arises via combined defects in insulin secretion (beta-cell dysfunction) and insulin action (in target tissues like adipose tissue, liver and skeletal muscle). Specific miRNAs involved in various aspects of glucose and lipid metabo-lism have been identified in recent years [14,15]. In par-ticular, using murine models, miR-9 and miR-375 are reported to be involved in regulation of insulin secretion [16,17], while miR-124a2 has recently been implicated in
pancreatic beta-cell development and function [18]. Despite the growing evidence that miRNAs may be impor-tant in T2D, only one study of global miRNA expression in insulin target tissues has been published to date. He et
al. (2007) [19] profiled miRNA expression in skeletal
muscle in the Goto-Kakizaki (GK) rat, a well-characterized model of T2D, and compared it to normal Wistar rats; miR-29 paralogs were found to be over-expressed in the GK rat. The widely-studied GK rat has several features that make it a good model for T2D as hyperglycaemia appears as early as 2–4 weeks of age, and it is relatively lean [20]. In the present study, we aim to identify differential liver and adipose tissue miRNA expression in rats of the GK strain and a genetically distant normoglycaemic strain (Brown-Norway (BN)). The GK strain is extensively used to study genetic determinants of T2D phenotypes [21], while the BN strain is widely used for comparison with GK and most congenic strains with a BN background. Addi-tionally, we assessed mRNA expression levels in the same tissues from the same rats to investigate the downstream effects of altered miRNA expression on target gene expres-sion; the approach is illustrated in additional File 1 [Addi-tional file 1].
Methods
Experimental animals
The GK rat is a lean and spontaneously type 2 diabetic ani-mal, while the BN rat serves as a normoglycaemic control. Four-month old rats representative of the GK and BN col-onies have been phenotyped previously. An intra-perito-neal glucose tolerance test (IPGTT) [22] was carried out after a 16–18 h fasting period, and plasma glucose con-centrations were significantly higher in GK compared to BN rats [see Additional file 2]. The current experiments were performed using seven-month-old male rats: four from the GK strain and four from the BN strain, obtained from the Oxford colony (GK/Ox and BN/Ox), and main-tained in accordance with national and institutional guidelines. Rats were fed standard laboratory chow pellets
(B&K Universal, Hull, UK) and kept on 12 h light/dark cycles. Liver and adipose tissue samples were obtained from the rats, snap-frozen in liquid nitrogen and stored at -80°C. Total RNA was extracted from homogenized tissue samples using TRI-Reagent (Sigma, UK) according to the manufacturer's instructions for use in miRNA and mRNA experiments (see below). Animal procedures were approved by the ethical review panel of the University of Oxford and UK Home Office licences.
Microarray analysis
Ambion miRNA arrays
MiRNAs were isolated and purified using mirVana miRNA isolation kit (Ambion). Poly-A tailing was added to 400 ng of each small RNA fraction using Ncode miRNA label-ling system (Invitrogen), which also adds the fluorescent labels Alexa Fluor® 3 and Alexa Fluor® 5. The synthetic
sequence control-1 (Ambion) was spiked in to each BN and GK sample in a ratio of 1:10, just before starting the labelling. For each tissue, eight independent samples (four GK and four BN) were combined in four two-colour hybridisations, with one GK and one BN sample hybrid-ized to each array. Within each tissue, half the arrays had GK samples labelled with Alexa Fluor® 5 and the other half
had BN samples labelled with Alexa Fluor® 5.
Samples were hybridised to Ambion mirVana™ miRNA Probe Set 1564v1 arrays for 4 h at 62°C in dark condi-tions. The array contains 384 unique probes with 16 rep-licates of each probe. Each probe is 42 to 46 nucleotides (nt) long, of which an 18 to 24 nt segment targets a spe-cific miRNA. MiRNA sequences are highly conserved between species, and the Ambion array includes probes for human, rat and mouse miRNAs. A total of 170 probes on the array are able to detect rat miRNAs and these were included in subsequent analyses. After hybridization, arrays were washed and scanned using the GenePix 4000B scanner (Axon Instruments [Molecular Devices]). Gene-Pix Pro 4.0 software (Axon Instruments [Molecular Devices]), was used to obtain raw probe intensities.
Statistical analysis of Ambion miRNA data
Raw data were imported into the R statistical package [23] and processed using the 'marray' package from Biocon-ductor [24]. Raw intensities were adjusted by subtracting the background intensity from each probe, and the data were then summarised by taking the median intensity across the 16 replicates of each probe. Data were normal-ized using the loess regression-based method within arrays to correct for any intensity-dependent dye bias [25]. A between-array normalisation was not required as all arrays showed comparable M-ratio distributions. Due to expected tissue differences in miRNA expression, differen-tial expression between GK and BN rats was assessed in adipose tissue and liver samples separately. The
experi-mental design (see above) generated M-ratios (log-ratio of red and green intensities) representing the log ratio of expression in the two strains. The M-ratios could therefore be used to investigate strain differences, the main objec-tive of this study. We used the limma package from Bio-Conductor [26] to fit a linear model (including a dye effect) to the M-ratio data from the 4 arrays corresponding to each tissue. This generated a list of miRNA probes ranked by p-value for the evidence for differential expres-sion between the GK and BN rats. Raw p-values were adjusted using the method of Benjamini and Hochberg [27] to control the false discovery rate (FDR). Differential expression between liver and adipose tissue could also be investigated using the A-ratios, which represent the aver-age intensity (log scale) of the GK and BN samples hybrid-ised to each array. Assuming strain differences are small in comparison to tissue differences, the fold change (liver vs. adipose tissue) can be estimated as the difference in mean A-ratio between the 4 liver and 4 adipose tissue arrays.
Illumina mRNA arrays
Gene expression profiling of liver and adipose tissue sam-ples from the same rats investigated in the miRNA experi-ment was performed using Sentrix® BeadChip RatRef-12
v1 Whole-Genome Gene Expression Arrays (Illumina Inc., San Diego, California, USA), which contain 22,523 oligo-nucleotides probes (replicated an average of 30 times). Double-stranded cDNA and purified biotin-labelled cRNA were synthesised from 300 ng high quality total RNA using the Illumina® TotalPrep RNA Amplification Kit
(Ambion Inc., Austin, Texas, USA). cRNA concentrations were determined using a NanoDrop spectrophotometer, and cRNA quality and integrity were assessed using an Agilent 2100 Bioanalyser (Agilent Technologies, Wald-bronn, Germany). Hybridisations onto Sentrix® BeadChip
RatRef-12 v1 arrays were carried out using 750 ng of each biotinylated cRNA in a 58°C hybridisation oven for 18 hours. Following washing and staining with Streptavidin-Cy3, the BeadChip Arrays were scanned on the Illumina®
BeadArray Reader (Illumina Inc., San Diego, USA). The quality of the resulting data was checked using the Illu-mina® BeadStudio Application software
Statistical analysis of Illumina mRNA data
Raw intensity data were imported into the R statistical package [23] for further processing. First, an array-specific background measure, based on the average signal from negative control probes, was subtracted from all probes on the array. Data were then transformed and normalized using the vsn2 BioConductor package [28]. Hierarchical clustering showed samples clustered primarily according to tissue, with GK and BN samples forming two sub-clus-ters within the adipose tissue cluster. Differential expres-sion between the GK and BN strains was assessed in liver and adipose tissue samples separately using the limma
package from BioConductor [26]. Raw p-values were adjusted to control the false discovery rate (FDR) using the method of Benjamini and Hochberg [27]; adjusted p-values below 0.05 were considered significant.
The entire datasets (for miRNA and mRNA) described here are available from the Gene Expression Omnibus (GEO, http://www.ncbi.nlm.nih.gov/projects/geo/) through series accession number GSE17060.
Quantitative real-time PCR validation methods
Quantitative real-time PCR was carried out on the remain-der of RNA available from liver tissues using ABI's Taq-Man microRNA assays (Applied Biosystems (ABI), Warrington, Cheshire, UK). Briefly, reverse transcription (RT) was carried out in a total reaction volume of 15 μl containing 5 μl of total RNA (10 ng/ul), 3 μl of reverse transcription primer, 1.50 μl of 10× RT buffer, 1.00 μl MultiScribe Reverse Transcriptase (50 U/μl), 0.15 μl of 100 mM dNTPs (with dTTP), 0.19 μl of RNase Inhibitor, 20 U/μl and 4.16 μl of nuclease-free water. Reactions were incubated as per manufacturer's recommendation. PCRs were performed in triplicate, the 20-μL PCR reaction con-tained: 1.33 μL RT product, 10 μL 2× PCR Master Mix, 1-μL microRNA primer (ABI, UK) and 7.67 μl of nuclease-free water. The reactions were incubated at 95°C for 10 min, followed by 40 cycles of 95°C for 15 s, 60°C for 35 s. The highly conserved snoRNA and 4.5S RNA(H) (rat) were used as normalizing endogenous controls. Fold changes (FC) in expression were calculated using the 2 -(ΔΔCt) method [29]. Stocks of adipose tissue were depleted
when used in the miRNA and mRNA studies, which did not allow for validation using RT-PCR.
In-silico prediction of miRNA target genes
In-silico prediction of miRNA target genes was carried out
using three different prediction algorithms: TargetScan v4.1 [30], PicTar [31] and miRanda [32]. The first two algorithms predict binding sites preferentially based on the 5' end of the 22 nt miRNA sequence, while miRanda predictions are more sensitive to the sequence at the 3' end. Each prediction algorithm generally identifies hun-dreds of potential target genes for any single miRNA and there is relatively little overlap between different algo-rithms. However, TargetScan and PicTar show a higher degree of overlap than either does with miRanda [Addi-tional file 3], as might be expected based on the approaches implemented by the different algorithms. These predicted target lists may also contain a significant proportion of false-positives i.e. the sequences align, but no functional miRNA-mRNA interaction occurs in vivo [33]. With little experimental data, it is difficult to deter-mine which algorithm performs best; thus, all analyses were performed with each list separately as well as with the subset of target genes predicted by at least two of the
three algorithms. The latter list may be more likely to include a higher proportion of true target genes than any one list alone, but will be biased towards TargetScan/Pic-Tar predictions.
In-silico functional analysis
Biological pathways defined by KEGG [34] that are enriched among the predicted target genes of miR-125a and the lists of differentially expressed mRNAs found in liver and adipose tissue were identified using the GENE-CODIS software [35]. This profiling tool uses the hyperge-ometric distribution to determine whether individual pathways or combinations of pathways are significantly over-represented among the genes of interest. P-values computed for each pathway were adjusted using the method of Benjamini and Hochberg [36] to control the false discovery rate (FDR) and adjusted p-values < 0.05 were considered significant.
Enrichment of miR-125a target genes among differentially expressed genes
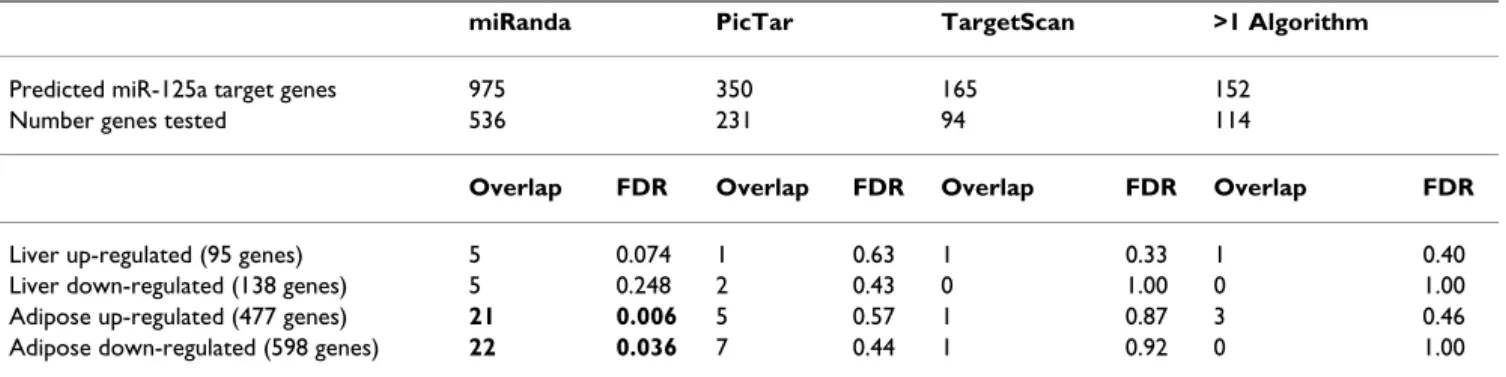
Using the mRNA expression data, we investigated whether predicted miR-125a target genes were differentially expressed in liver or adipose tissue. Since miRNAs can cause degradation of target mRNAs, over-expression of miR-125a in both tissues in the GK rat may down-regulate its target genes in GK relative to BN. As described above, 3 different algorithms were used to generate target gene lists for miR-125a. Each of these lists, together with the subset of 152 genes predicted by more than one algorithm, was tested in this analysis. Only target genes present on the array were included, which typically reduced the list of tar-gets by about 40% (Table 1). We first calculated how many genes in each of the four target gene lists were among the significantly down-regulated genes in adipose tissue (n = 598) and liver (n = 138). Then, a permutation test was used to assess whether the observed overlap was greater than that expected by chance. Specifically, we selected 10,000 random sets of genes that were not pre-dicted targets of miR-125a, with each set containing the same number of genes as predicted targets. The overlap with the down-regulated genes in adipose tissue and liver was calculated for each of the 10,000 random gene sets. The proportion of random gene sets showing equal or greater overlap as the set of miR-125a target genes was used to estimate the false discovery rate. This analysis was carried out 8 times in total (for each of four lists in two tis-sues) and repeated exactly as above for the up-regulated genes.
Results
Differences in miRNA expression between GK and BN rats
The expression of 170 miRNAs in adipose tissue and liver from hyperglycaemic GK and normoglycaemic BN rats was detected using two-colour microarray technology
Table 1: Overlap between predicted miR-125a target genes and genes significantly altered in GK compared to BN rats in adipose tissue and in liver.
miRanda PicTar TargetScan >1 Algorithm
Predicted miR-125a target genes 975 350 165 152
Number genes tested 536 231 94 114
Overlap FDR Overlap FDR Overlap FDR Overlap FDR
Liver up-regulated (95 genes) 5 0.074 1 0.63 1 0.33 1 0.40 Liver down-regulated (138 genes) 5 0.248 2 0.43 0 1.00 0 1.00 Adipose up-regulated (477 genes) 21 0.006 5 0.57 1 0.87 3 0.46 Adipose down-regulated (598 genes) 22 0.036 7 0.44 1 0.92 0 1.00 The number of predicted miR-125a target genes found among the significantly up- and down-regulated genes in each tissue is shown for each algorithm and for the subset of targets predicted by more than one algorithm. In each case, the significance of the overlap (estimated false discovery rate) is calculated as the proportion of 10,000 random sets of non-miR-125 target genes of the same size showing equal or greater overlap.
Relative expression of miR-125a in liver from diabetic GK rats compared to BN rats
Figure 1
Relative expression of miR-125a in liver from diabetic GK rats compared to BN rats. * P = 0.0005 (miR-125a
(Ambion mirVana™ miRNA Probe Set 1564v1). As expected tissue-specific patterns of miRNA expression were detected [Additional file 4]; all subsequent GK vs. BN analyses were carried out within tissues. Differences in miRNA expression across strains were ranked by p-value from an analysis of differential expression using the limma package [26] from BioConductor [24]. Twelve probes in liver and four probes in adipose tissue were dif-ferentially expressed between GK and BN rats at a nomi-nal p < 0.05 significance level (Table 2). Following FDR correction for multiple testing (for 170 probes) none of these remained significant, likely due to the small sample size (4 arrays per tissue). MiR-125a was the most signifi-cant result for GK vs. BN in liver (FC = 5.62, P = 0.001, P
ad-justed = 0.10)), and we confirmed this over-expression of
miR-125a by RT-PCR (FC = 13.15, two-sided t-test P = 0.0005) (Figure 1). The top-ranking miRNA in adipose tis-sue was miR-322 (FC = 1.91, P = 0.029 Padjusted = 0.99) but it did not rank highly in the liver. MiR-29a, which ranked fourth in the adipose GK vs. BN comparison, has been previously reported to be over-expressed in adipose tissue in GK rats when compared to normoglycaemic Wistar controls [19]. The only miRNA that showed some evi-dence of change in expression in both liver and adipose tissue is miR-125a, which ranked top in the liver and fifth in the GK vs. BN comparison in adipose tissue (FC = 1.97,
P = 0.078, Padjusted = 0.99).
Differences in gene (mRNA) expression between GK and BN rats
Gene expression levels in adipose tissue and liver from the same rats used in the miRNA experiment were analysed using the Illumina Rat Ref12 array. We identified 1075 genes differentially expressed (adjusted p < 0.05) in adi-pose tissue in the hyperglycaemic GK rat compared to the normoglycaemic BN rat (477 up-regulated and 598 down-regulated). In liver, we found 233 differentially expressed genes, of which 95 were up regulated in GK rats and 138 were down regulated (Figure 2). A total of 101 genes were significantly altered in both adipose tissue and liver, with the vast majority showing the same direction of change in both tissues (41 up and 55 down). The robustness of gene differential expression is supported by the previously rep-licated array experiments using two well established and technologically different platforms using RNA from the current samples [37]. In-silico functional profiling of the significant genes revealed similar results in both tissues (Table 3), including several pathways related to glucose lipid metabolism: prostaglandin and leukotriene metabo-lism (Padjusted = 0.001 in adipose tissue, Padjusted = 0.002 in liver), glycolysis/gluconeogenesis in adipose tissue (P
ad-justed = 0.003) and fatty acid metabolism in liver (Padjusted =
0.01). A number of amino acid metabolism categories were also significant in both tissues (Table 3). (Details of
Table 2: MiRNA microarray analysis reveals differential expression between hyperglycaemic and normoglycaemic rats
Rank miRNA Fold change
(GK vs. BN) P-value Adjusted P-value Liver 1 miR-125a 5.61 0.001 0.104 2 miR-30e 1.56 0.009 0.522 3 miR-210 1.56 0.013 0.522 4 miR-221 1.60 0.015 0.522 5 miR-223 1.50 0.015 0.522 6 miR-365 1.41 0.029 0.592 7 miR-26b 1.51 0.031 0.592 8 miR-23a 2.30 0.032 0.592 9 miR-222 1.38 0.033 0.592 10 miR-29c 1.52 0.038 0.592 11 miR-30a-3p 1.32 0.045 0.592 12 miR-22 -1.39 0.050 0.592 Adipose tissue 1 miR-322 1.91 0.029 0.999 2 let-7c -2.27 0.040 0.999 3 let-7b -2.17 0.046 0.999 4 miR-29a 1.51 0.049 0.999 5* miR-125a 1.97 0.078 0.999
Differences in miRNA expression levels in 4 hyperglycaemic GK rats compared to 4 normoglycaemic BN rats in liver and adipose tissue. For each tissue, one GK and one BN sample were hybridized to each array in a two-colour experiment (4 arrays per tissue). M-ratios therefore represent the log2 intensity ratio in the two strains. The limma package from BioConductor was used to find miRNAs differentially expressed between GK and BN rats and the top ranking genes for each tissue are shown. * miR-125a is shown in this table to illustrate the potential overlap of signals detected in liver and adipose tissue.
individual genes for all significant categories are given in [Additional file 5]).
Predicted targets for miR-125a and in-silico functional profiling
The miRNA target gene prediction algorithms TargetScan 4.1 [38], PicTar [31] and miRanda [32] generated target gene lists for miR-125a comprising 165, 350 and 975 genes, respectively. Of these, 152 genes were predicted by more than one algorithm [Additional file 3] and only 17 are predicted by all algorithms. The target gene lists were analysed using the GENECODIS tool to investigate the biological pathways (KEGG) that may be affected by over-expression of miR-125a in liver and, to a lesser extent, adi-pose tissue. When the set of 152 miR-125a target genes was tested, mitogen-activated protein kinase (MAPK) sig-naling was the only pathway to show significant over-rep-resentation (Padjusted = 3 × 10⁻⁵). The MAPK signaling
pathway was also significant when each predicted target list was analysed separately, and was the top-ranking pathway for the lists generated by TargetScan and PicTar [Additional file 6]. Other significant pathways of note included insulin signaling (Padjusted = 0.03, PicTar gene list) and, with the miRanda list, glycerolipid metabolism (P
ad-justed = 0.02) and calcium signaling (Padjusted = 0.05).
Enrichment of miR-125a target genes among differentially expressed genes
Given the evidence for miRNA regulation at the mRNA level in animals [6,9,10], integration of miRNA-mRNA expression data was also performed. Since miR-125a was the top-ranking miRNA in liver, and fifth-ranked in adi-pose tissue, we hypothesized that target genes of miR-125a would be differentially expressed between GK and BN rats in both tissues. Specifically, overexpression of miR-125a in these tissues in the GK rat would be expected to down-regulate miR-125a target genes [1,6,39]. Target genes predicted by all algorithms (n = 17), plus the set of 152 genes predicted by more than one algorithm, were tested for enrichment among the 598 genes significantly down-regulated in GK compared to BN rats in adipose tis-sue and among the 138 down-regulated genes in liver (Table 1). Greater overlap than expected by chance (see Methods) was observed in adipose tissue (overlap = 22, FDR = 0.04) but not in liver (overlap = 5, FDR = 0.25) for the set of 536 target genes predicted by the miRanda algo-rithm and present on the Illumina RatRef 12 array. Three miR-125a target genes (Slc35c2, Umps and Ptges2) were significantly down-regulated in GK rats in both tissues. Contrary to expectation, a significant enrichment was also observed when the up-regulated genes were tested (over-lap = 21, FDR = 0.006 in adipose tissue; over(over-lap = 5, FDR = 0.07 in liver). For both up- and down-regulated genes, there was more overlap in adipose tissue compared to
Gene expression analysis of adipose tissue and liver reveals differential expression between hyperglycaemic and normoglycae-mic rats
Figure 2
Gene expression analysis of adipose tissue and liver reveals differential expression between hyperglycaemic and normoglycaemic rats. The number of genes that are significant (adjusted p < 0.05) in the comparison of 4
hyperglycae-mic GK rats and 4 normoglycaehyperglycae-mic BN rats in adipose tissue (477 up; 598 down), liver (95 up; 138 down), and in both tissues (41 up; 55 down). Five genes significant in both tissues showed opposite directions of change and are not included in the adi-pose tissue and liver group.
liver, even though miR-125a showed a higher fold induc-tion in liver.
Neither of the target gene lists generated by PicTar and TargetScan, nor the combined list, showed significant overlap with differentially expressed genes (Table 1). This was because the overlap between differentially expressed genes and miR-125a targets occurred largely for genes uniquely predicted by miRanda. Furthermore, the PicTar and TargetScan lists are more similar to each other than to the miRanda list, and so the combined list is biased toward the genes predicted by these algorithms [Addi-tional file 3]. It should be noted that it is not the greater number of targets predicted by miRanda that produces the significant result, as the size of the target gene list is accounted for in the analysis.
Discussion
The role of altered miRNA expression in a variety of dis-eases is increasingly being recognized but the precise nature and downstream effects of such changes is largely unknown. Previous studies have shown that miRNAs reg-ulate various physiological events relevant to T2D patho-physiology, such as insulin secretion, insulin responsiveness and energy homeostasis. Here, we have characterized differential miRNA and mRNA expression in insulin sensitive tissues of rats of a model of T2D (GK rat) and in normoglycaemic BN controls, a strain combi-nation extensively used to study the genetic determinants of T2D phenotypes in F2 hybrids and congenic strains [21]. In the miRNA data, the most striking finding was the over-expression of miR-125a in both liver and adipose tis-sue (with nearly 6-fold and 2-fold higher expression, respectively) in GK compared to BN rats. This finding was validated by RT-PCR in liver (FC = 13.15, p = 0.0005). The higher sensitivity and dynamic range of the RT-PCR
tech-Table 3: Functional profiling of differentially expressed genes in GK compared to BN rats in adipose tissue (n = 1075) and liver (n = 233) using GENECODIS.
KEGG pathway(s) Number of genes Corrected p-value
Adipose tissue
Prostaglandin and leukotriene metabolism 10 0.001 Focal adhesion | ECM-receptor interaction | Hematopoietic cell lineage | Regulation of actin
cytoskeleton
4 0.002
ECM-receptor interaction | Hematopoietic cell lineage 5 0.002
ECM-receptor interaction 11 0.002
Glycolysis/Gluconeogenesis 9 0.003
Focal adhesion | ECM-receptor interaction 9 0.003
Arginine and proline metabolism 8 0.005
Glycolysis/Gluconeogenesis | Fructose and mannose metabolism 4 0.005 Glycolysis/Gluconeogenesis | Pentose phosphate pathway | Fructose and mannose metabolism 3 0.012
Hematopoietic cell lineage 9 0.015
Cell Communication | Focal adhesion | ECM-receptor interaction 6 0.019
Fructose and mannose metabolism 6 0.019
Porphyrin and chlorophyll metabolism 5 0.029
Folate biosynthesis 5 0.031
Metabolism of xenobiotics by cytochrome P450 7 0.033 Cytokine-cytokine receptor interaction | Focal adhesion 3 0.033
Focal adhesion 14 0.033
Valine, leucine and isoleucine degradation 6 0.033
Cholera – Infection 5 0.033
Fructose and mannose metabolism | Galactose metabolism 3 0.033 Urea cycle and metabolism of amino groups 4 0.033 Glycine, serine and threonine metabolism 5 0.044 Liver
Arginine and proline metabolism 7 2.17E-06
Alanine and aspartate metabolism | Arginine and proline metabolism 3 2.09E-05
Alanine and aspartate metabolism 4 1.30E-04
Urea cycle and metabolism of amino groups | Arginine and proline metabolism 3 0.0017 Prostaglandin and leukotriene metabolism 4 0.0019 Valine, leucine and isoleucine degradation | Butanoate metabolism 3 0.0030
Fatty acid metabolism 3 0.0103
nique is the most likely reason why the fold change is higher than detected by microarray.
MiR-125a and its close homolog miR-125b differ by a sin-gle nucleotide [40], and thus share many predicted target genes. Experimentally validated target genes of both miR-125a and miR-125b in humans include ERBB2 and ERBB3 [41] and LIN28 [42]. Both 125a and miR-125b have been reported to be down-regulated in ovarian [43] and breast cancers [44], with potential roles in cell proliferation and differentiation. To further investigate the potential role of miR-125a in T2D, we assessed the functional roles of predicted miR-125a target genes. This analysis suggested that increased miR-125a levels may particularly affect genes involved in the MAPK signalling pathway. MAPK has been implicated in T2D [28,30] and plays a critical role in insulin signalling [45], and may contribute to insulin resistance [46]. Further functional experiments will help elucidate the role of MAPK signal-ling in T2D and to what extent increased miR-125a expression may affect this pathway.
We integrated our miRNA results with gene expression data from the same animals and found an enrichment of miR-125a target genes predicted by the miRanda algo-rithm [32] among genes down-regulated in GK rats in adi-pose tissue. Of particular interest, a proadi-posed functional candidate gene for T2D, Ptges2, is a predicted miR-125a target gene and was significantly down-regulated in both tissues. Two other miR-125a target genes of interest in the context of T2D and obesity are Ppap2c and Sult1a1, both of which were significantly down-regulated in adipose tis-sue from the GK rat. In addition; single nucleotide poly-morphisms (SNPs) in the SULT1A1 region have previously been associated with increased BMI in humans [47]. Contrary to expectation, it was surprising to find an even stronger enrichment among the up-regulated genes. One possibility is that these are not direct target genes themselves, but represent changes further downstream of the miRNA regulation. No enrichment was observed with the target gene lists predicted by the other two algorithms, which may be due to differences in the target-gene predic-tion methods implemented or to the effects of long-term exposure to hyperglycaemia further affecting the control of gene expression. These results show that the relation-ship between miRNAs and gene expression is not a simple one.
Though the enrichment of miR-125a target genes pre-dicted by miRanda is an interesting finding, it raises a number of questions, including why both down and up-regulated genes should show significant enrichment of miR-125a target genes, and why stronger enrichment was observed for the tissue with lower fold induction of miR-125a. The difficulty of predicting genuine target genes
combined with other influences on gene expression could provide some explanation. Furthermore, the current data do not demonstrate whether the expression of any of the genes is dysregulated as a direct consequence of the increased miR-125a levels. One approach to identify genes likely to be regulated by miR-125a is to find those that show a strong negative correlation between their expression and miR-125a levels. Unfortunately, the two-colour experimental design used for the miRNA study (generating GK v BN expression ratios) combined with the small sample size precluded such an analysis here. Integrating miRNA and mRNA data has the potential to give further insights into miRNA-mediated regulation of gene expression but is limited to detecting events in which the target mRNA is degraded. Still, in-silico approaches will likely be useful for prioritizing target genes for func-tional validation.
Our results suggest that increased miR-125a expression may be a characteristic feature of hyperglycaemic GK rats. However, as this study was carried out in rats with long-established T2D phenotypes, it remains unclear whether the observed changes are causative, or reflect adaptation to prolonged hyperglycaemia. GK and BN rats are also genetically different strains, and it is therefore possible that strain differences unrelated to hyperglycaemia could contribute to the altered expression of miR-125a. Although in-silico functional profiling of gene expression data and miR-125a target genes lends some support to the idea that miR-125a over-expression is linked to the hyper-glycaemic phenotype, further evidence from other model systems or functional studies is certainly desirable. Among the other miRNAs showing robust differences between GK and BN rats was a 1.5 fold up-regulation of miR-29a in adipose tissue. This is exactly comparable with the only previous study of miRNAs in T2D, which identi-fied a 1.5 fold up-regulation of miR-29a, together with the paralogs 29b and 29c, in skeletal muscle from GK and Wistar rats (normoglycaemic controls)[19]. Northern blot analysis confirmed the up-regulation of all three miR-29 paralogs in muscle, adipose tissue and liver. This study further showed that high glucose and insulin (which indi-cate insulin resistance) up-regulate the expression of miR-29a/b in adipocyte cell lines. They also suggest the over-expression of miR-29a/b inhibits insulin-induced glucose import in the same adipocyte cell lines. Taken together, these data support the involvement of miR-29a in insulin resistance and the insulin-signaling pathway.
Conclusion
We have shown that miR-125a expression is increased in two insulin target tissues in a rat model of T2D. Gene expression analysis in the same animals revealed a distinct profile characterizing the hyperglycaemic GK rat,
includ-ing altered expression of several predicted miR-125 target genes. In-silico functional profiling of predicted miR-125a targets and differentially expressed genes indicated that lipid metabolism pathways and MAPK signaling may be dysregulated in the hyperglycaemic state. Knowledge of miRNA differential expression between GK and BN rats provides important information which may contribute to the understanding of processes which underlie the T2D phenotype in GK rats through investigations in crosses and congenic models derived in this strain combination [48-50]. Further studies at the protein level and transla-tion across species, especially to humans, will be impor-tant to elucidate the potential role of miR-125a in T2D pathophysiology.
Competing interests
The authors declare that they have no competing interests.
Authors' contributions
BMH and HL performed statistical analysis, validated miRNA expression and drafted the manuscript. CML, JMT and QFW contributed with statistical analysis, and data interpretation. PK, AB and CF participated in growing ani-mal colonies, tissue and RNA extraction and mRNA sam-ple preparation for microarrays. CC and JR generated and scanned Ambion Microarrays. DG, MIM and CML designed the study and coordinated it and finalized the manuscript. All authors read and approved the final man-uscript.
Additional material
Acknowledgements
Funding for this study was provided by Diabetes UK (grant code BDA: RD06/0003287) the Throne-Holst Foundation and Nuffield Department of Medicine. DG holds a Wellcome Senior Fellowship in Basic Biomedical Sci-ence (057733). C.M.L. is a Wellcome Trust Research Career Development Fellow (086596).
References
1. Bartel DP: MicroRNAs: genomics, biogenesis, mechanism,
and function. Cell 2004, 116(2):281-297.
2. Vasudevan S, Tong Y, Steitz JA: Switching from repression to
activation: microRNAs can up-regulate translation. Science
2007, 318(5858):1931-1934.
3. Hutvagner G, Zamore PD: A microRNA in a multiple-turnover
RNAi enzyme complex. Science 2002, 297(5589):2056-2060.
4. Dugas DV, Bartel B: MicroRNA regulation of gene expression
in plants. Curr Opin Plant Biol 2004, 7(5):512-520.
5. Lagos-Quintana M, Rauhut R, Lendeckel W, Tuschl T: Identification
of novel genes coding for small expressed RNAs. Science 2001, 294(5543):853-858.
6. Lim LP, Lau NC, Garrett-Engele P, Grimson A, Schelter JM, Castle J, Bartel DP, Linsley PS, Johnson JM: Microarray analysis shows that
some microRNAs downregulate large numbers of target mRNAs. Nature 2005, 433(7027):769-773.
7. Selbach M, Schwanhausser B, Thierfelder N, Fang Z, Khanin R, Rajew-sky N: Widespread changes in protein synthesis induced by
microRNAs. Nature 2008, 455(7209):58-63.
8. Baek D, Villen J, Shin C, Camargo FD, Gygi SP, Bartel DP: The
impact of microRNAs on protein output. Nature 2008, 455(7209):64-71.
9. Krutzfeldt J, Rajewsky N, Braich R, Rajeev KG, Tuschl T, Manoharan M, Stoffel M: Silencing of microRNAs in vivo with 'antagomirs'.
Nature 2005, 438(7068):685-689.
10. Sood P, Krek A, Zavolan M, Macino G, Rajewsky N:
Cell-type-spe-cific signatures of microRNAs on target mRNA expression.
Proc Natl Acad Sci USA 2006, 103(8):2746-2751.
11. Wang X: Systematic identification of microRNA functions by
combining target prediction and expression profiling. Nucleic
Acids Res 2006, 34(5):1646-1652.
12. Cheng C, Li LM: Inferring microRNA activities by combining
gene expression with microRNA target prediction. PLoS ONE
2008, 3(4):e1989.
Additional file 1
Outline of methodology for analysis and integration of miRNA and mRNA expression data from hyperglycaemic GK and normoglycaemic BN rats.
Click here for file
[http://www.biomedcentral.com/content/supplementary/1755-8794-2-54-S1.jpeg]
Additional file 2
Results of intra-peritoneal glucose tolerance test (IPGTT) measure-ments carried out at four-months of age on animals representative of the colony GK = 8 BN = 4 *P < 0.05, **P < 0.01, ***P < 0.001 sig-nificance.
Click here for file
[http://www.biomedcentral.com/content/supplementary/1755-8794-2-54-S2.jpeg]
Additional file 3
Overlap of target-gene lists predicted for miRNA rno-miR-125a using three algorithms.
Click here for file
[http://www.biomedcentral.com/content/supplementary/1755-8794-2-54-S3.jpeg]
Additional file 4
Tissue differences in miRNA expression (liver vs. fat)
Click here for file
[http://www.biomedcentral.com/content/supplementary/1755-8794-2-54-S4.xls]
Additional file 5
Functional profiling and gene-symbols of differentially expressed genes in GK compared to BN rats in adipose tissue (n = 1075) and liver (n = 233) using GENECODIS
Click here for file
[http://www.biomedcentral.com/content/supplementary/1755-8794-2-54-S5.xls]
Additional file 6
In-Silico functional profiling of miR-125a targets predicted by miRanda (worksheet 1), TargetScan (worksheet 2), and PicTar (worksheet 3).
Click here for file
[http://www.biomedcentral.com/content/supplementary/1755-8794-2-54-S6.xls]
13. Ambros V: The functions of animal microRNAs. Nature 2004,
431(7006):350-355.
14. Poy MN, Spranger M, Stoffel M: microRNAs and the regulation
of glucose and lipid metabolism. Diabetes Obes Metab 2007, 9(Suppl 2):67-73.
15. Tang X, Tang G, Ozcan S: Role of microRNAs in diabetes. Role
of microRNAs in diabetes. Biochim Biophys Acta 2008, 1779(11):697-701.
16. Poy MN, Eliasson L, Krutzfeldt J, Kuwajima S, Ma X, Macdonald PE, Pfeffer S, Tuschl T, Rajewsky N, Rorsman P, Stoffel M: A pancreatic
islet-specific microRNA regulates insulin secretion. Nature
2004, 432(7014):226-230.
17. Plaisance V, Abderrahmani A, Perret-Menoud V, Jacquemin P, Lemai-gre F, Regazzi R: MicroRNA-9 controls the expression of
Gran-uphilin/Slp4 and the secretory response of insulin-producing cells. J Biol Chem 2006, 281(37):26932-26942.
18. Baroukh N, Ravier MA, Loder MK, Hill EV, Bounacer A, Scharfmann R, Rutter GA, Van Obberghen E: MicroRNA-124a regulates
Foxa2 expression and intracellular signaling in pancreatic beta-cell lines. J Biol Chem 2007, 282(27):19575-19588.
19. He A, Zhu L, Gupta N, Chang Y, Fang F: Overexpression of micro
ribonucleic acid 29, highly up-regulated in diabetic rats, leads to insulin resistance in 3T3-L1 adipocytes. Mol Endocrinol 2007, 21(11):2785-2794.
20. Picarel-Blanchot F, Berthelier C, Bailbe D, Portha B: Impaired
insu-lin secretion and excessive hepatic glucose production are both early events in the diabetic GK rat. Am J Physiol 1996, 271(4 Pt 1):E755-762.
21. Gauguier D: The rat as a model physiological system. Volume
3. London: Wiley; 2006.
22. Solberg LC, Valdar W, Gauguier D, Nunez G, Taylor A, Burnett S, Arboledas-Hita C, Hernandez-Pliego P, Davidson S, Burns P, Bhatta-charya S, Hough T, Higgs D, Klenerman P, Cookson WO, Zhang Y, Deacon RM, Rawlins JN, Mott R, Flint J: A protocol for
high-throughput phenotyping, suitable for quantitative trait anal-ysis in mice. Mamm Genome 2006, 17(2):129-146.
23. R: A Language and Environment for Statistical Computing
[http://www.R-project.org]
24. Gentleman RC, Carey VJ, Bates DM, Bolstad B, Dettling M, Dudoit S, Ellis B, Gautier L, Ge Y, Gentry J, Hornik K, Hothorn T, Huber W, Iacus S, Irizarry R, Leisch F, Li C, Maechler M, Rossini AJ, Sawitzki G, Smith C, Smyth G, Tierney L, Yang JY, Zhang J: Bioconductor: open
software development for computational biology and bioin-formatics. Genome Biol 2004, 5(10):R80.
25. Smyth GK, Speed T: Normalization of cDNA microarray data.
Methods 2003, 31(4):265-273.
26. Smyth GK: Linear models and empirical Bayes methods for
assessing differential expression in microarray experiments.
Stat Appl Genet Mol Biol 2004, 3:.
27. Benjamini Y, Hochberg Y: Controlling the false discovery rate: a
practical and powerful approach to multiple testing. J R Stat
Soc B 1995, 57:289-300.
28. Huber W, von Heydebreck A, Sultmann H, Poustka A, Vingron M:
Variance stabilization applied to microarray data calibration and to the quantification of differential expression.
Bioinfor-matics 2002, 18(Suppl 1):S96-104.
29. Livak KJ, Schmittgen TD: Analysis of relative gene expression
data using real-time quantitative PCR and the 2(-Delta Delta C(T)) Method. Methods 2001, 25(4):402-408.
30. Lewis BP, Shih IH, Jones-Rhoades MW, Bartel DP, Burge CB:
Predic-tion of mammalian microRNA targets. Cell 2003, 115(7):787-798.
31. Krek A, Grun D, Poy MN, Wolf R, Rosenberg L, Epstein EJ, MacMe-namin P, da Piedade I, Gunsalus KC, Stoffel M, Rajewsky N:
Combi-natorial microRNA target predictions. Nat Genet 2005, 37(5):495-500.
32. John B, Enright AJ, Aravin A, Tuschl T, Sander C, Marks DS: Human
MicroRNA targets. PLoS Biol 2004, 2(11):e363.
33. John B, Sander C, Marks DS: Prediction of human microRNA
targets. Methods Mol Biol 2006, 342:101-113.
34. Kanehisa M, Goto S: KEGG: kyoto encyclopedia of genes and
genomes. Nucleic Acids Res 2000, 28(1):27-30.
35. Carmona-Saez P, Chagoyen M, Tirado F, Carazo JM, Pascual-Montano A: GENECODIS: a web-based tool for finding significant
con-current annotations in gene lists. Genome Biol 2007, 8(1):R3.
36. Hochberg Y, Benjamini Y: More powerful procedures for
multi-ple significance testing. Stat Med 1990, 9(7):811-818.
37. Wilder SP, Kaisaki PJ, Argoud K, Salhan A, Ragoussis J, Bihoreau MT, Gauguier D: Comparative analysis of methods for gene
tran-scription profiling data derived from different microarray technologies in rat and mouse models of diabetes. BMC
Genomics 2009, 10:63.
38. Grimson A, Farh KK, Johnston WK, Garrett-Engele P, Lim LP, Bartel DP: MicroRNA targeting specificity in mammals:
determi-nants beyond seed pairing. Mol Cell 2007, 27(1):91-105.
39. Yekta S, Shih IH, Bartel DP: MicroRNA-directed cleavage of
HOXB8 mRNA. Science 2004, 304(5670):594-596.
40. Enright AJ, John B, Gaul U, Tuschl T, Sander C, Marks DS:
Micro-RNA targets in Drosophila. Genome Biol 2003, 5(1):R1.
41. Scott GK, Goga A, Bhaumik D, Berger CE, Sullivan CS, Benz CC:
Coordinate suppression of ERBB2 and ERBB3 by enforced expression of micro-RNA miR-125a or miR-125b. J Biol Chem
2007, 282(2):1479-1486.
42. Wu L, Belasco JG: Micro-RNA regulation of the mammalian
lin-28 gene during neuronal differentiation of embryonal car-cinoma cells. Mol Cell Biol 2005, 25(21):9198-9208.
43. Nam EJ, Yoon H, Kim SW, Kim H, Kim YT, Kim JH, Kim JW, Kim S:
MicroRNA expression profiles in serous ovarian carcinoma.
Clin Cancer Res 2008, 14(9):2690-2695.
44. Mattie MD, Benz CC, Bowers J, Sensinger K, Wong L, Scott GK, Fed-ele V, Ginzinger D, Getts R, Haqq C: Optimized high-throughput
microRNA expression profiling provides novel biomarker assessment of clinical prostate and breast cancer biopsies.
Mol Cancer 2006, 5:24.
45. Fujishiro M, Gotoh Y, Katagiri H, Sakoda H, Ogihara T, Anai M, Onishi Y, Ono H, Abe M, Shojima N, Fukushima Y, Kikuchi M, Oka Y, Asano T: Three mitogen-activated protein kinases inhibit insulin
signaling by different mechanisms in 3T3-L1 adipocytes. Mol
Endocrinol 2003, 17(3):487-497.
46. Engelman JA, Berg AH, Lewis RY, Lisanti MP, Scherer PE: Tumor
necrosis factor alpha-mediated insulin resistance, but not dedifferentiation, is abrogated by MEK1/2 inhibitors in 3T3-L1 adipocytes. Mol Endocrinol 2000, 14(10):1557-1569.
47. Thorleifsson G, Walters GB, Gudbjartsson DF, Steinthorsdottir V, Sulem P, Helgadottir A, Styrkarsdottir U, Gretarsdottir S, Thorlacius S, Jonsdottir I, Jonsdottir T, Olafsdottir EJ, Olafsdottir GH, Jonsson T, Jonsson F, Borch-Johnsen K, Hansen T, Andersen G, Jorgensen T, Lauritzen T, Aben KK, Verbeek AL, Roeleveld N, Kampman E, Yanek LR, Becker LC, Tryggvadottir L, Rafnar T, Becker DM, Gulcher J, Kiemeney LA, Pedersen O, Kong A, Thorsteinsdottir U, Stefansson K:
Genome-wide association yields new sequence variants at seven loci that associate with measures of obesity. Nat Genet
2009, 41(1):18-24.
48. Gauguier D, Froguel P, Parent V, Bernard C, Bihoreau MT, Portha B, James MR, Penicaud L, Lathrop M, Ktorza A: Chromosomal
map-ping of genetic loci associated with non-insulin dependent diabetes in the GK rat. Nat Genet 1996, 12(1):38-43.
49. Dumas ME, Wilder SP, Bihoreau MT, Barton RH, Fearnside JF, Argoud K, D'Amato L, Wallis RH, Blancher C, Keun HC, Baunsgaard D, Scott J, Sidelmann UG, Nicholson JK, Gauguier D: Direct
quan-titative trait locus mapping of mammalian metabolic pheno-types in diabetic and normoglycemic rat models. Nat Genet
2007, 39(5):666-672.
50. Wallis RH, Collins SC, Kaisaki PJ, Argoud K, Wilder SP, Wallace KJ, Ria M, Ktorza A, Rorsman P, Bihoreau MT, Gauguier D:
Pathophys-iological, genetic and gene expression features of a novel rodent model of the cardio-metabolic syndrome. PLoS ONE
2008, 3(8):e2962.
Pre-publication history
The pre-publication history for this paper can be accessed here: