Creative Destruction in Multi-Source Marketplaces: Exploring Factors
Influencing Success or Failure in Multi-Sided Marketplaces
by
James A Barkley
Bachelor of Science Computer Science University of Colorado, Boulder
Submitted to the Faculty in partial fulfillment of the requirements for the degree of Master of Science in Engineering and Management
at
Massachusetts Institute of Technology
January, 2015 1
Eb.a
I
6 C 2015 James A Barkley. All Rights Reserved.The author hereby grants to MIT permission to reproduce and to distribute publicly paper and electronic copies of this thesis document in whole or in part
in any medium now known or hereafter created.
All others may use this work under the terms and conditions of the Creative Commons BY 4.0 License.
A u th o r: ...
Signature redacted
James A Barkley
System Design and Management Program
Certified by:...Signature
redacted
Dr. David Robert Wallace Thesis Supervisor Professor of Mechanical ineering, MacVicar Faculty Fellow
^ i r.
PN
A cce pted by: ...
MASSACHUSETTS INSTITUTE OF TECHNOLOGY
JUN
2
3 2016
LIBRARIES
Signature redacted
ck HaleChairman & Senior Lecturer, Engineering Systems Division
Director, System Design and Management Program
e:
Creative Destruction in Multi-Source Marketplaces:
Exploring Factors Influencing Success or Failures in
Multi-Sided Marketplaces
By
James A Barkley
Submitted to the System Design and Management Program on January, 2016 in Partial Fulfillment of the Requirements for the Degree of Master of Science in Engineering and
Management.
Abstract
This work explores key factors that influence the patterns of creative destruction in Multi-Sided Platforms (MSPs) with the intent to determine which controls are likely to lead to particular patterns of success or failure of such a platform in the marketplace. This work builds on previous research in crowd-sourcing and multi-sided marketplaces by examining previously' discovered factors in the marketplace to understand their impacts, especially as they act as determinants to an MSP's success or failure. Eleven key factors of business strategy, technology strategy, and awareness-building were identified through an extensive literature review; dynamic simulations and uncertainty modeling were used to assess the level of influence of these factors. Simulation experiments for Facebook and Twitter were conducted and compared to historical adoption and financial data of both platforms, along with a
hypothetical case study and a sensitivity analysis of all variables.
Implications for future research are that more study of user motivations for value creation and their impact is needed. Furthermore, the macro-economic dynamics add complexity, but are critical to understanding creative destruction. Implications for business leaders are that special attention should be given to anything that can enhance or inhibit Contact Rate and Adoption
Fraction, and that when assessing tradeoffs, entrepreneurs should remember this fundamental tenet: enhance adoption incentives and limit adoption inhibitors.
The results of this research suggest that indirect network effects behave as amplifying or inhibiting forces acting on direct network-effect forces, and can be controlled through policy, or in some cases managed as constraints. This study finds that the key elements to focus on for understanding, forecasting, or optimizing a Multi-Sided Platform in the wild are: Coopetition, Content Per User, Awareness Effectivity, Revenue Per User, Cost Per User, Market
Competitiveness, and Content Quality. Thesis Supervisor: Dr. David Robert Wallace
Acknowledgments
Thank you to both The MITRE Corporation and UI LABS for sponsoring my work at the Massachusetts Institute of Technology. Their flexibility and commitment to investing in an
educated workforce should be a standard for all companies.
Thank you to my advisor, Dr. David Wallace, whose commitment to his students is legendary, and who exhibited great patience and wisdom in the face of every roadblock, paralysis, and
soul-searching moment.
Thank you to my family: Mom, Dad, and Kristen, for constantly pushing me to dream the impossible dream and to strive for achievement in life, and without whose sacrifices my betterment would not have been possible. Especially, thanks to my loving wife Laura, an
intellectual titan as well as a steadfast and immutable force in my tumultuous existence.
Thank you also to my extended family: The System Design & Management cast of characters including professors, colleagues, classmates and playmates. You have been my inspiration. Especially, thanks to the SDM administrators Pat Hale and Joan Rubin, who gave me limitless
opportunity, and wise counsel.
Thank you to Joe Zajic, Harry Sleeper, and Bill King. I've been blessed with amazing role models in my career who have been both the cause and the antidote of my greatest challenges!
I owe them a debt of gratitude!
To laugh about the mornin', Keeping midnight's way,
Erstwhile I adorning, Crown of Delphic, nebula
Contents
Chapter 1: Introduction ... 6
Section 1.1: Background & M otivation ... 6
Section 1.2: Sum m ary of Key Findings... 7
Section 1.3: Research Scope ... 10
Section 1.4: Research Objectives ... 11
Section 1.5: M ethodology & Approach... 12
Section 1.5.1: M ethodology & Approach Overview ... 12
Section 1.5.2: Tools ... 13
Section 1.5.3: Core Fram ework...14
Section 1.5.4: Literature Review ... 15
Section 1.5.5: M odeling Approach... 15
Section 1.5.6: Logistic Growth M odels ... 17
Chapter 1.5.7: Bass Diffusion M odel... 19
Chapter 1.5.8: Data and M odel Sources ... 20
Chapter 2: Literature Review & Previous Research ... 22
Section 2.1: Crow dsourcing & Innovation Research... 24
Section 2.2: M ulti-Sided Platform s & M arkets Research... 26
Section 2.3: Psychology of User M otives Research ... 28
Section 2.4: Open Source and M ulti-Source Research ... 31
Section 2.5: Key Findings of Previous Research... 33
Chapter 3: Syste m M odels ... 36
Section 3.1: Core M odel Variables... 37
Section 3.2: Core M odel Developm ent... 39
Section 3.3: Key Influencing Variables ... 43
Section 3.3.1: Directly Represented Factors... 44
Section 3.3.2: Com plex Factors for Representation ... 45
Section 3.4: Extended M odel Developm ent ... 49
Chapter 4: Sim ulation Experim ents ... 57
Section 4.1: Using the M odel... 57
Section 4.1.1: M odel Interface... 57
Section 4.1.2: Advanced User Options... 59
Section 4.2: Facebook Case Study... ... ... 61
Section 4.2.1: Facebook Param eters & Fit... 61
Section 4.2.2: D iscussion... . -.. . -... ---... 66
Section 4.3: Twitter Case Study ... ... 68
Section 4.3.1: Tw itter Param eters & Fit... 68
Section 4.3.2: D iscussion... .... ... . ... 72
Section 4.4: Hypothetical Case Study: Manufacturing Technology Platform (MTP)...73
Section 4.4.1: M TP Param eters & Fit ... 74
Section 4.4.2: Discussion... ... ... 78
Section 4.5: Sensitivity Analysis ... ... 78
Section 4.5.1: Sensitivity of Financial Factors... 79
Section 4.5.2: Sensitivity of Adoption Factors ... 83
Section 4.5.3: Sensitivity of Policy Factors... ... ... 86
Section 4.5.4: Sensitivity of Value & Market Factors...89
Section 4.6: Model Strengths and Weaknesses... 93
Chapter 5: Results ... ... ... ...---... 96
Chapter 5.1: Summary of Experiment Results ... 96
Chapter 5.2: Key Findings & Discussion ... ... 98
Chapter 5.3: Implications for Business Leaders ... 99
Chapter 1: Introduction
Section 1.1: Background & Motivation
The term Creative Destruction is taken from the work of Austrian-American economist Joseph Schumpeter. Sometimes called "Schumpeter's gale", creative destruction is a theory of economic innovation and the business cycle (Schumpeter, 1950) that describes how new economic orders are continually created and prior economic orders are continually destroyed. Much study has been given to understanding the phenomenon of creative destruction since
Schumpeter's original work was published in 1942 (third and final edition in 1950). However, with the rise of the Internet and web-based services, the economic forces and prevailing market winners have become even more disruptive and uncertain (Foster & Kaplan, 2001), (Hagiu & Wright, Multi-Sided Platforms, 2015).
Average company lifespan on S&P 500 Index (in years) In their 2001 book by the same
70 title (Creative Destruction), Sarah
Kaplan and Richard Foster draw from a McKinsey database of over
401 1,000 companies across 15
Projections based id sre vrapro
an current data industries over a 38-year period
and propose that the average
70
lifetime of a company in the S&Pis decreasing and will be ten years
DATA: INNOSIGHT/Richard N. Foster/Standard & Poor's
Figure 1.1: Average company lifespan from Foster & Kaplan by 2020 (Foster & Kaplan, 2001).
study (Gorri, 2013) Kaplan & Foster propose levers
and strategies for making businesses longer-lasting and higher-performing. However, the majority of organizations studied in this work are traditional businesses, such as chip
manufacturing, pharmaceuticals, and cookware. Companies in service industries are excluded. This study is representative of the majority of work up into the early 2000's.
Online marketplaces and widespread connectivity have led to the rise of numerous platforms, typically using a business model commonly referred to as a Multi-Sided Platform, or MSP. MSPs - such as Uber, Facebook, and Groupon - bring together two or more groups of
customers that have interdependencies (Ankaraju, 2010). This is very different paradigm than traditional operating modes for a company (e.g., vertically integrated firms, resellers, or input suppliers), with one of the biggest differences being indirect, or side-channel, network effects (Hagiu & Wright, Multi-Sided Platforms, 2015).
There are many business strategy, technology strategy, and awareness management choices that influence the behavior of markets and market actors in MSPs:
I hypothesize that a small, identifiable set of strategy, policy, and technology choices are key drivers that can be used to accurately forecast and control user growth, cost, and
revenue of an MSP.
I also hypothesize that users are tied directly to revenue and valuation and that cost/user and revenue/user are key metrics for assessing the viability of a business venture.
Section 1.2: Summary of Key Findings
In this research, a conceptual framework was developed for understanding multi-sided platforms and the dynamics of both direct and indirect network effects, including what constraints and strategic decisions influence these dynamics. Eleven key factors of business strategy, technology strategy, and awareness-building were identified through an extensive literature review, and dynamic simulations and uncertainty modeling were used to assess the order of magnitude of influence of these factors. Simulation experiments for Facebook and Twitter were conducted and compared to historical adoption and financial data of both platforms to validate the model, along with a hypothetical case study and a sensitivity analysis of all variables.
Multi-Sided
Crowdsourcing PltrS Psychology of Open Source &
& Innovation User Motives Multi-Source Rank
Markets
incentives 4 24.0
crowd selection (diversity,
specialization, population size, 13 5 0 1 19.0
etc.)
5 3 3 5 16.0
intellectual property
communication among crowd 7 3 2 4 16.0
charging /pricing model 5 3 2 5 15.0
transparency/openness 0 4 3 6 13.0
Platform selection (feature
selection, advanced 9 3 0 0 12.0
capabilities, etc.)
profit 3 3 3 1 10.0
0 2 2 5 9.0
low barrier to entry
iquality 5 1 0 3 9.0
operating costs 2 1 2 3 8.0
Table 1. 1 - Top eleven key determinants in MSP success
The core framework, key factors culled from the literature review, and system dynamics model developed are valuable artifacts which can serve to explore market factors and key decisions for an MSP; the historical case studies with Facebook and Twitter data can be forecasted with surprising accuracy. The model has been published with a special interface that allows easy experimentation by providing all inputs with sliders which show changes in real-time to the
REFERENCE DATA 01 TPI'1S operatuitz Cost 0 421 64 U6 User Growth 2B P. 0 Per 0 421 64 1216 Values % . Profi Pu 3 B
revenuZ
0 4' 8 16 Profit 3485B / .30 %1 0 05 10 10 T-~ t1-WAdopters Vs- Cost & Revenue
0 d." 0 daw
0 15-009
Figure 1.2 - Model interface with slider bars for adjusting inputs and real-time
as customized graphs.
sparkline graphs for all outputs as well
The findings of this research support the hypothesis that these factors are worth careful consideration, and that they can be predicted and, to some extent, controlled for improving outcomes. This research suggests that the key elements to focus on for understanding, forecasting, or optimizing an MSP in the wild are those which are sensitive but controllable: Coopetition; Content Per User; Awareness Effectivity; Revenue Per User; and Cost Per User; Market Competitiveness; and Base Creation Quality.
Larger context of global macroeconomics are an important part of the story that were beyond the scope of this research, but are implied as a direction for future research. In addition,
motivational forces for content creation and user communities are ripe for additional exploration.
For entrepreneurs and business-builders, strategies for maximizing the adoption factors such as ambassador programs, referral schemes, and advertising offer a huge return on investment, especially if done early. Decisions about pricing policies, community selection, and barriers to entry will limit as much as possible any inhibiting effects on adoption. For example, the users on the side of the marketplace that stand to benefit most from interactions/transactions with other sides of the marketplace are also the most likely to tolerate fees.
1 References to direct model variables are given in All Caps Notation.
FINANCIAL ADOPTION POLICY ~~4er ~ OTHIER 011 TPIIs REFERENCE DATA
Section 1.3: Research Scope
This research explores the hypotheses that a small set of key decisions are the primary drivers in multi-sided platforms and can be used to accurately forecast growth, cost, and revenue of an MSP. This core set of "levers", it is hypothesized, are the primary influencers of:
" user adoption,
" user retention,
" support costs for the MSP owner/operator,
" revenue generation for the owner/operator, and
" value creation within the marketplace
A core framework has been developed for exploring these hypotheses, along with a set of
system dynamics models, monte-carlo simulations, uncertainty and sensitivity analyses, and financial metrics over time.
In modeling and simulation, defining the system boundary and selecting the right variables at the right level of fidelity is always a critical challenge with no hard and fast rules. In addition to the core model elements based on existing mathematical models, the key influencing factors for
modeling have been derived from a literature review and assessment (Chapter 2). This work has been scoped to explore a dozen or less key influencing factors as well as a set of 20 or less core model variables. This strikes the right balance between achievability and serious research.
Several revenue streams and models are available for MSPs, such as charging for the service outright, charging for only premium features (so-called "freemium" model), or through offering complementary services, and understanding these is a core objective of this work; however, the scope of this effort only demonstrates how this framework and model set can be applied to assess the revenue streams in a real-world scenario.
The models are tested using public-sourced data from existing MSPs. This includes information such as public financial statements and user growth numbers, but excludes working closely under NDA with any particular company in order to incorporate proprietary data such as
operating costs. I have also tested and tuned the model with data from my current work at UI
LABS, but none of that data will be made available under this work.
Section 1.4: Research Objectives
MSPs are still a fairly new concept, and are an emergent phenomenon in many sectors of the economy. My objective is to build a framework and a set of tools to validate the hypotheses - a small set of strategy, policy, and technology choices are the key drivers which can be used to accurately forecast and control user growth, cost, and revenue of an MSP; users are tied directly to revenue and valuation and that cost/user and revenue/user are key metrics for assessing the viability of a business venture) - in the hopes that it is a tool which can be used
by the author and others who are introducing an MSP into the marketplace. I'm particularly
interested in exploring the potential for MSPs in the manufacturing sector, which is undergoing a disruptive digital revolution right now.
The outcomes and deliverables of this thesis, also shown in figure 2, are: * a literature review and case study comparison; Chapter 2
* a proposed set of core factors for consideration; Section 2.5, Section 3.2
* a set of executable models with simulation results and interpretation; Section 3.3
* a thesis document entailing the background, methodology, results, and implications for future research, among other sections;
" and a web site for providing access to all research artifacts under an open source
Objectives & Deliverables
Core Factors for MSPs objective Framework for Exploring MSPs&
Simulation Results & Interpretation Executable ModelsWebsite for Providing
Access to All Research Artifacts Under an Open
Source License
Explore Potential for MSPs in
Manufacturing Sector
Figure 1.3 - Directed graph view of objectives and deliverables development and delivery.
Section 1.5: Methodology & Approach
Section 1.5.1: Methodology & Approach Overview
The methodology and approach started with defining the core framework for investigation, which was done iteratively in conjunction with a thorough literature review. The literature review was
performed based on a perspective decomposition which formed the categories of literature surveyed. These categories, were likewise informed in conjunction with the development of the core framework.
During the literature review, key influencing factors were tagged, extracted, and placed into a scoring matrix across the literature categories and grouped by the core framework pillars using a systematic method of concept classification in text analysis known as "coding." The key
12 Literature Review Thesis Document = deliverable
influencing factors have been prioritized by the number of mentions across various literature categories. In order to appropriately scope the effort, I've only chosen to model the 11 highest-scoring factors. This is a little below the obvious "cut-line" for the top group of scores, but I felt it
important to incorporate the next two highest.
These key influencing factors then became the variables for modeling and simulation. Two initial model types (Logistic Growth and Bass-Diffusion) were explored but only one was selected for final modeling and experimentation in order to keep the effort in line with the scope and
resources.
Finally, several validation and sensitivity experiments were explored with the final model, followed by interpretation of the results and conclusions. A graphical view of the methodology
and approach can be seen in Figure 1.3 below.
Core Framework Development
Business Strategy Technology Strategy Net Positive Awareness
Literature Review
Perspective Decomposition
Crowdsourcing Multi-Sided Open Source & Psychology of Other
& Innovation Platforms Multi-Source User Motives
Modeling & Sim.
Logistic Growth Model Key Influencing
I
Factorsj Synthesize Results Interpretation & ConclusionsModeling & Sim.
Bass-Diffusion
Model
Data Fit & validation
Sensitivity Analysis & Experiments
Figure 1.4 - Overview of methodology and approach
I
Section 1.5.2: Tools
13
In addition to this paper-based framework, the following tools were used in various ways to build out mathematical and executable models for exploration of this basic framework:
" System Dynamics - System dynamics is a science that emerged in the 1950's to aid
understanding of complex socio-technical systems with a high degree of
interdependence and circular causality (System Dynamics Society, 2015). I used this for both modeling and simulation using Vensim DSS from Ventana Systems.
* Uncertainty Analysis - Uncertainty Analysis is the science of identifying and modeling
key sources of uncertainty in a system to understand the distribution of possible outcomes and the sensitivity of the system overall to changes in certain parameters (de Neufville & Scholtes, 2011). VenSim and The DecisionTools Suite from Palisade Corporation are examples of tools available that use assist in use of these techniques.
" Financial Modeling - Financial modeling is a way of mathematically representing a
particular financial situation, usually for purposes of forecasting financial performance or valuation over time. I have incorporated financial forecasting elements into the Vensim models and have done some auxiliary work using Excel spreadsheets for analysis of financial measures (e.g., NPV, payback period, etc.) as well.
Section 1.5.3: Core Framework
Our core framework for exploring MSPs begins with the premise that traditional network effects are at work in MSPs, but so are indirect or "side-channel" network effects. The traditional network effects function as in a traditional marketplace or product adoption scenario, but the indirect network effects occur when different sides of the marketplace interact with each other. This view is supported strongly by the literature review in Section 2.
In addition to these core elements, this framework needs to include "levers" that the platform builder/operator has influence over. In this framework, these have been categorized into three core pillars of the model: Business strategy, technology strategy, and "net positive awareness." Some examples of each of these can be seen in Figure 1.4 below.
Side 1
-N
Side-channel network effects (balancing)+,
+
Side-chai network E (reinforcii Traditional network effects (reinforcing) Traditic networ Side N+
Side 2 Traditional + network effects + (reinforcing) Platform Business Strategy - --Number of sidesnal Pricing structure
k effects + Governance structure
Technology Strategy
Net Positive Awareness Feature selection
- Advertising - Openness
- Ease of entry/switching costs
- Word of mouth
Figure 1.5 Core Framework for Exploring Key Factors in MSPs
I
Section 1.5.4: Literature Review
The key variables for modeling have been culled from a comprehensive literature review, in which I have extracted and prioritized the top variables that show up routinely in publications and research. These were placed into a scoring matrix across the literature categories and grouped by the core framework pillars. The key influencing factors have been prioritized by the number of mentions across various literature categories. Sections 2.5 and 3.2 of this document contain the analysis and resulting key influencing factors for modeling.
Section 1.5.5: Modeling Approach
The general approach to modeling here is focused around users of the platform. User
population is a key factor in revenue, support costs, carrying capacity, user growth, and value generation, and almost all variables in which people are concerned with the outcome; therefore,
user population adoption and retention must be central to the model. In addition, user population must be linked to almost all relevant factors.
The variables are broken down into two groups:
" Core model variables - These variables represent the basic features of the
foundational model like "users" as well as most off the output variables which are desirable to predict, such as "revenue."
" Key influencing variables - These variables are mostly input and intermediate
variables that represent the levers in our core framework that have influence over the output variables which are desirable to predict or control.
Two foundational models were initially explored: the logistic growth model and the Bass model of technology diffusion, each of which is discussed in more detail below. These two models were chosen as the foundation for this work because of their classic role in product adoption
and population growth, and because they align nicely with the core framework. These models serve as a good foundation, but are fairly basic and contain a number of assumptions. In this research, an initial investigation of both models was performed, and ultimately the Bass-diffusion model was selected as the final model for development. Using this model, the basic approach to population modeling has been built on, including incorporated feedback elements that have strong acausal2 relationships with the key variables and other previously unconsidered factors. In other words, the foundational model was extended by layering on the key variables culled from the literature review in Section 2.5 of this work. For example, user populations are linked to many other factors through intermediate variables such as revenue per user, support costs per user, deterrents to adoption, number of sides of the MSP, etc.
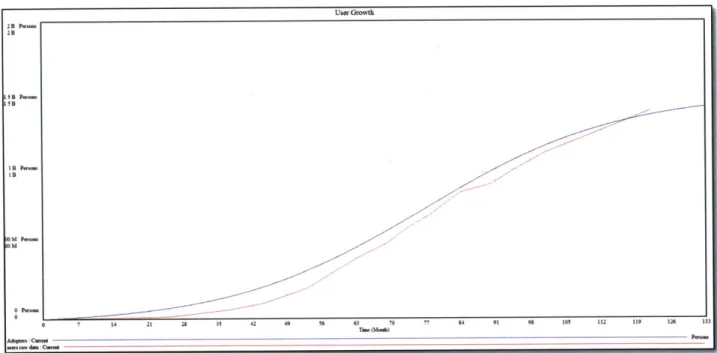
The models have been validated by being fit to real-world, publicly available data sets, such as Facebook reported user growth and published revenue numbers. "Fit" in this case means the models have been simulated with initial conditions matching that of the projects we are
simulating (e.g., Facebook). The output variables are then compared with the actual historical results, and the models are either sufficiently matched to the real data, or need to be refined
and tweaked. Multiple MSPs were fit to the models in order to guard against over-fit. Where the exact data was not available, such as internal support costs, values that yield accurate results from the models were selected and then compared those values to expected support costs from
published studies on infrastructure and resource capacity.
Once the models were established and provided reasonable forecasting performance to historical datasets, the models were then simulated with various perturbations in controlled experiments where individual variables are varied to understand their impact on output. For instance, if we assume the market is expanding, what impact does this have on the user growth compared with if we assume the market is shrinking?
Finally, some sensitivity analysis is performed on these key variables in two modes - the system dynamics model and a basic financial forecasting model - to assess the beneficial envelope for the most critical variables.
All of the models and results have been reviewed with subject matter experts from engineering,
system dynamics, finance, and venture capital.
Section 1.5.6: Logistic Growth Models
A common approach to modeling population growth is using a logistics function, which yields an
"S-curve," or sigmoid curve (Wikipedia, 2015); that is, growth is near-exponential at first, until saturation begins to occur and then growth slows, eventually plateauing in a logarithmic-like fashion. The standard equation for this in ecology is provided in equation 1.1
dP
-I-= rP * 1-P Equation 1.1 - Classic differential equation for logistic growth
d t K
Species and disease populations have been very successfully represented with classic logistic growth models; however, in our case of online user communities, the traditional meanings of some of these variables are no longer valid, and we'll need to recast them into something more meaningful. For instance, population size could be measured in user accounts, active user accounts, business accounts, etc. Carrying capacity is more a measure of the computing
resources required to support the population; of course, in the age of cloud computing compute resources can often be elastically scaled (assuming the platform architecture can scale with compute resource expansion). Carrying capacity frequently varies with time in ecological as well
as virtual environments, so the classic equation has been modified as shown in equation 2.
dp _
-- =rP * (1 - P ) Equation 1. 2 - Modified equation for logistic growth with time-varying carrying capacity
dt K (t )
These types of models have successfully been adopted for representing growth of online user communities (Kairam, Wang, & Leskovec, The Life and Death of Online Groups: Predicting Group Growth and Longevity, 2012). In fact, in 2011 Peter Cauwels and Didier Sornette - both of the Entrepreneurial Risks group at ETH Zurich - fit logistic-based population models to published Facebook and Groupon data with very accurate results, and used that as a basis to assess whether or not Facebook and Groupon were overvalued in the marketplace (Cauwels & Sornette , Quis Pendit Ipsa Pretia: Facebook Valuation and Diagnostic of a Bubble Based on Nonlinear Demographic Dynamics, 2012).
To explain this further, let's take an example: in the figure 1.5 we see a common approach in System Dynamics to modeling this type of equation. We can see in the
Potential r Adopters
Adopters A model that carrying capacity is
p Adoption
Rate o represented as a constant expression
ion Mouthencapsulated in the Adoption
Fraction. Not only does this not
Contact Adoption
Rate Total Fraction
Population i
N
t= Time r = Growth rate K = Carrying capacity
account for time-varying carrying capacity, it ignores any relationships between adopters and carrying capacity. In our environment, one could argue that carrying capacity is a function of cost, which needs to be supported by revenue generated; therefore, in order to scale the carrying capacity one would need more users, higher revenue per user, or both.
Chapter 1.5.7: Bass Diffusion Model
The bass diffusion model was first developed in 1963 by Professor Frank Bass at the Krannert School of Management at Purdue University (Bass, 1963) as a way to explain the diffusion of products through the marketplace. It has become one of the most popular models for new product growth and is widely used in marketing and strategy, among other things (Sterman, 2000, p. 332).
The core mathematical model, known as the Bass Model Principle, is described as follows (Bass's Basement Research Institute, 2010):
f (0 P q Equation 1.3 Classic equation for the Bass Model Principle
1-F(t) M[A(t)]
The Bass's Basement Research Institute describes how this equation should be read: "The portion of the potential market that adopts at time t given that they have not yet adopted is equal to a linear function of previous adopters." (Bass's Basement Research Institute, 2010)
One of the key advantages of the Bass Diffusion Model is that it accounts for the genesis of the initial population. In the logistic growth model, the population growth relies entirely on contact
M = Potential Market t= Time
p = Coefficient of Innovation q = Coefficient of Imitation f(t) = Fractional Adoption Rate F(t) = Saturation
rate between potential adopters and existing adopters, but this does not account for situations where existing adopters are close to zero, such as a new technology or market. Originally described as "innovators and imitators" (Bass, 1963), the bass model includes constant or flat growth due to some other force and typically attributed to advertising (innovators) as well as growth through word of mouth (imitators).
The basic system dynamics representation of the bass model can be seen in figure 1.6 below and is a very good foundation, but still affords opportunity for improvement.
Figure 1.7 - System Dynamics model representation of classic Bass-Diffusion mathematical model (Sterman, 2000)
As with the logistic growth model, the carrying capacity is encapsulated in the Adoption Fraction as a constant extrinsic value. The bass model asserts that the total population is zero, which is an assumption that the size of the market is constant. It also does not include the response of the market to pricing, nor does it encompass financial characteristics such as operating costs or revenue generation.
II
Chapter 1.5.8: Data and Model Sources
All data presented in this document were taken or derived from materials available either
publicly or from published literature. For instance, financial data in some cases comes from annual statements while user growth is taken straight from corporate publications or market research reports.
Potential Adopters A
Adopters P Adoption Rate
AR
Market + Word of Total
Saturation /Mouth Population N
Adoption
+ from Adoption from
Advertising Market Word of Mouth -- Adoption
Saturation + Fraction i
Advertising +4 Effectiveness
Contact Rate c
Much of this work is inspired by System Dynamicist Tom Fiddaman who built upon the work of Cauwels and Ddier (cit). The two models I reviewed and exercised from Fiddaman and the resulting analysis are freely available (Fiddaman, 2011). Much of this work is also inspired by System Dynamicist John Sterman. I have expanded and modified the basic Bass-diffusion model provided by John Sterman in his book, Business Dynamics (Sterman, 2000), which includes sample models on CD as a companion to the textbook.
In fact, published models on Facebook and Groupon from Fiddaman were explored as potential starting points for the modeling portion of this effort, but in the end were not a good fit. The objective was different, which led to fairly niche set of parameters. Still, these models were very
informative, and an example can be seen below in figure 1.7.
Groupon user projections Tom Fiddaman,
and valuation 2011
Inspired by Cauwels & Soenette, models metasd-com facebook valuation and diagnostic of a
bubble based on nonlinear demographic relative persuasiveness dynamics
of lurkers http.arxwvorg abs 1110.1319 init users
effective customers
- for growth
Fractional Trial Fractional Repeat
Rate Rate
C Lurkers Customsat
Adding Tryng Repeating
unsaturated repeat saturation
growth rate r growNth rate fraction ever effect
potential repeating
subscribers customer
A saturation effect potential repeaters
potential -
-customers
subscriber cumulative
saturation effect customers
fraction ev er
buyNg subscribers
Figure 1.8 - Example System Dynamics model for looking at Groupon customer growth (Fiddaman, 2011)
The final model shown below and used for experimentation was built from scratch for this effort.
All works produced for this effort are freely available (Barkley, 2015) and are licensed under the
terms and conditions of the Creative Commons Attribution License 4.0 (Creative Commons Corporation, 2015).
Chapter 2: Literature Review & Previous
Research
In order to determine the right parameters and variables to be modeled for the analysis, an extensive review of existing research was conducted. Both primary and secondary sources were surveyed. Primary sources were most commonly reached using the MIT library online journal and periodical resources, but occasionally other sources were consulted, such as the
Harvard Business School paper archive and public internet. Secondary sources were those that were referenced in the primary sources or referred from subject matter experts, and included
not only journal articles but books, working papers, and interviews. One interview was conducted as well.
A perspective decomposition was performed on the initial core framework (Section 1.5.3),
assessing different lenses through which to view a multi-sided platform and leading to the breakdown of the literature into several distinct categories. These were refined as articles reviewed led to deeper insights into the perspectives on how to view the core framework. In the end, books, papers, journal articles, interviews, etc. were reviewed and binned into five major categories: crowdsourcing & innovation; open source & multisource; multi-sided platforms; and psychology of user motives. These categories ultimately drove the keyword and search criteria for ongoing review.
Out of the millions of results, articles were sorted by relevance and then by date. The top ten or so articles were selected, and then augmented by the secondary sources. The tally can be seen in the table 1:
Category of Research Number of Sources
Crowdsourcing & Innovation 45
Multi-Sided Platforms 12
Open Source & Multi-Source 8
Psychology of User Motives 9
Table 2.1 - Literature sources consulted by "MSP perspective" category
For the most part these categories are self-explanatory, but a section on each is presented below. Each category section provides a definition of the category and a brief write-up on key findings, including pull-quotes and highlights from specific sources.
As each article was reviewed, key influencing factors that could be modeled were annotated and extracted. Although a formal codebook was not developed, factors were refactored into a higher-level "codes" that could be counted across the different literature sources. This process is sometimes referred to as "coding," and is a classic approach to the systematic coding of text in qualitative data analysis (Corbin & Strauss, 1990).
Using this approach, the number of times a code appears is counted up by category, and then summed across all categories to show a final scoring matrix. For instance, one paper discussed "confidentiality" while others discussed issues around intellectual property - these were
combined into a single code of "intellectual property" with a resultant score that was additive across the number of papers that mentioned it. Each variable was also mapped into one of the three legs of my framework (business strategy, technology strategy, and awareness).
The resultant scoring matrix was used to give a polynomial score for each variable, which were then rank-ordered and selected for modeling. In this case, all polynomial terms had equal weighting, but future research could weight the categories differently, perhaps resulting in different final variables. 73 total influencing factors were pulled from the literature review; the full scoring matrix can be viewed in Appendix B.
It is worth noting that there are a disproportionate number of references in the Crowdsourcing & innovation category. This is likely due to two things: the fact that "Crowdsourcing" and
"Innovation" research were grouped into the same category, coupled with the fact that both of these topics independently are some of the most widely researched topics in business
communities. These are big topics and many of the studies, conclusions, and parameters of this topic overlap with the other categories in my literature review. In fact, all of the categories
to even distribution across the categorical perspectives than in ensuring commonality of variables and importance across all references reviewed.
Section 2.1: Crowdsourcing & Innovation Research
The term "crowdsourcing", first coined by Jeff Howe in 2006 (Howe, The Rise of Crowdsourcing,2006) has been a favorite topic of recent research studies, while studying "innovation" has long
been a tradition in the research community.
Much of the literature in this space focuses on defining these concepts (Estelles-Arolas &
Gonzales-Ladron-de-Guevara, 2012), while others try fitting various frameworks to the concepts in order to characterize them (Turian, 2012), assess the current market (Massolution, 2013), and provide guidance on when and how to use various instruments for business value (crowdsourcing.org, 2012). In addition, there are the occasional deeper research studies exploring thesis topics (Mekler, 2014) or using computer simulations to model crowd behavior (Prpic, Jackson, & Nguyen, A Computation Model of Crowds for Collective Intelligence, 2014). Finally, several case studies are available; Innocentive (Lakhani K. , Innocentive Case Study, HBS, 2009) and NASA (Gliedman, Smith, & Burris, 2013) are two examples that were reviewed in this study.
Of the many references reviewed in this area, the most valuable were the in-depth research
studies and the business value papers. The market analysis and case studies, while interesting and informative, offered little in the way of concrete variables that could be used in modeling and simulation. The body of knowledge in this space was focused largely on the usefulness of
crowdsourcing for businesses and innovative potential as often measured by the effectiveness of distributed teams (Sukkasi, 2004), the effect of non-experts and team diversity in these projects (Mekler, 2010), and the ability to tap into larger cohorts for one-time activities.
Howe proposes that a "renaissance of amateurism" is fueling the potential of the crowd, and it is important to pick the right model, pick the right crowd, and offer the right incentives (Howe, Crowdsourcing: Why the Power of the Crowd is Driving the Future of Business, TBD). These are recurring themes that raised a common set of questions such as:
" Reward incentives
" Pricing schemes
" Quality
Mekler writes about the importance of diversity: "When crowds are diverse, collaborative crowds outperform the nominal crowd. However, when crowds are highly homogenous, collaboration can reduce ideation performance" (Mekler, 2014). The results of a DARPA study support this by pointing to the importance of "openness" in crowds and platforms: "The openness of the
marketplace will allow input from a wide range of contributors with varying skill levels" (Cao, Wallace, Beckmann, & Citriniti, 2012).
Quality of contributions and contributors is another key theme that we see, while others caution us about the challenges of intellectual property (Laasonen, 2014). Cheung gives us an
interesting measure of what to expect in terms of contributing users versus regular users:
"Not all users were as interested in creating content as consuming them, however. In fact, Empirical observations suggested that typically only 1 % of the users in a virtual community
actually create new content, 10% would modify that content, while the remaining 89% would view the content without contributing at all [28]. While the actual percentages may vary depending on the user demographics and content type, these estimates nonetheless provide valuable insights regarding user participations. Although this "89:10:1 ratio" seems utterly
unfavorable to websites that depend on user-generated content, that 1 % is often a large number
already for high-traffic websites with millions of visitors" (Cheung, 2012).
In total, 117 variables were pulled out of the references reviewed; these were rationalized into a final list of 51 total variables using the coding described in the methodology section. Some of the top factors from this area include:
* Crowd incentives
* Crowd selection (diversity, specialization, size, etc.) * Platform selection (feature set, carrying capacity, etc.) * Communication among the crowd
* Labor pool (private, community, public, hybrid, internal v. external) * Quality
* Intellectual property
Section 2.2: Multi-Sided Platforms & Markets
Research
The topic of multi-sided platforms appears to be fairly niche, yet there is a healthy set of literature around the topic; some of this does not use that specific terminally, just instead casts the topic as the economics of online marketplaces. An MSP is a generalization of the two-sided platform concept where two or more sides of a marketplace or enabled to interact with each other.
Haigu, et al. discuss the differences in definitions, and tell us the defining characteristics are "they enable direct interactions between two sides of the platform" and "each side is affiliated with the platform". It is interesting to assess how this business model differs from others.
Numerous journal articles and business reports have discussed the challenges and tradeoffs with governance in these types of multi-sided platforms. Governance here is defined as a regulation of third-party action by the platform itself. At a high level, a platform's choice of tighter governance rules reflects a trade-off of quantity in favor of quality. An example of this is the difference between Apple iOS and Android in the marketplace. Here are three examples of differing governance policies:
* Hardware: apple controls production in a vertically integrated fashion; Google, on the other hand, in addition to producing their own hardware platform, allows any hardware vendor to build an Android-compatible phone.
* App store: apple has careful vetting of "apps" and app producers; Google only recently instituted app vetting which is still much more limited in scope.
* App development: Google allows 3rd party toolchains for building applications, while apple requires you use only their SDK.
"We study the economic tradeoffs that drive organizations to position themselves closer to or further away from a multi-sided platform (MSP) business model, relative to three traditional
alternatives: vertically integrated firms, resellers, or input suppliers." Haigu and Wright tell us. "For instance," they go on, "Amazon started off as a pure retailer but has moved closer to a
MSP model over time by enabling third-party sellers to trade directly with consumers on its website."
MSPs create value by enabling interactions among customer groups, and Andrei Haigu go on to tell us that the key value of MSPs is by decreasing the cost of transactions and searches (Hagiu
A. , Successful Strategies for Multi-Sided Platforms, 2014). This can take place in service
markets that are purely digital (e.g., iTunes) or knowledge products (e.g., Wikipedia), but many are about brokering goods between buyers and sellers, such as Airbnb, eBay, Xbox, Uber, Facebook, Amazon, and Rakuten.
Platforms are powerful concepts, and very different than other business models. Michael Cusumano proposes in his book (Cusumano, 2012):
"Managers (at least in industries affected by digital technologies as well as 'network effects' more broadly) should move beyond conventional thinking about strategy and capabilities to compete on the basis of platforms, or complements to another firm's platform."
Some interesting modeling approaches have been taken, including attempting to fit historical data from Facebook and Groupon using logistic growth models. Pricing and user motivations are themes that show up, and lots of good strategy advice is given. For instance, in his 2014 paper, Andrei Hagiu proposes key strategic points for successful MSPs (Hagiu, 2014). He suggests that the following key questions are the core drivers of success or failure in MSPs:
- How many sides to bring on board?
- What are the right design decisions for feature selection?
- What is the right pricing structure?
- What are the appropriate governance rules?
Some of the top factors emerging from this portion of the literature include:
" Crowd selection
* Platform selection
* Communication among crowd * Charging/pricing model
* Intellectual property * Profit
* User incentives
I
Section 2.3: Psychology of User Motives Research
A significant amount of work has been conducted to understand motivational forces and
innovation capacity in individuals (Stock-Homburg, von Hippel, & Oliveira, 2014). One study examined Innocentive prize challenges and interviewed respondents (Lakhani K. R., 2006). Table 2.8, below, summarizes these findings.
Table 2.8: Correlations Between Variables Predicting Solver Being A Winner (N = 295 Respondents)
Control Variables
1 RTP Problem Type
2 Time to develop solution Motivations
3 Money
4 Extrinsic motivation 5 Intrinsic motivation 6 Beating other solvers 7 Unsatisfactory job 8 Had free time Expertise
9 Interest Count (at registration) 10 Problem distance with field of expertise
t significant at 10%; * significant at 5% 2 3 4 5 6 7 8 9 10 0.09 1 0 0.01 -0.05 9 0,07 0.01 -0.06 0.07 0.05 -0.07 0.01 -0. 3* -0,03 -0,06 -0,01 0.1 it significant at 1%; -0.1 It -0.21* -0.02 -0.01 -0.08 0 12** -0.03 I 0.32*** 0.27*** 0.518*** 0.05 0.26** -0.04 0.08 -0.04 0.04 0.05 0.09 1 0.06 0.03 1 0,25** 0.05 -0.02 0.03 1 -0.01 0.1 It -0.01 0.13* 1 *** significant at 0. 1%
Table 2.2 - Correlations between variables
respondents (Lakhani K. R.. 2006)
Eric von Hippel has also been known for his work on end-user motivation (von Hippel, 2005). In one of his most recent works he joined forces with Dr. Ruth Stock-Homburg, a psychologist and professor at Darmstadt University in Germany. Pushing von Hippel's previous work even further, they scientifically explored not only motives of end users, but also the personality traits behind those motives (Stock-Homburg, von Hippel, & Oliveira, 2014). One key finding is around the
classic "hedonic" vs. "utilitarian" motives that von Hippel has pioneered. The relationship between hedonic user motives and utility are characterized by an inverted U-shape (pg. 2), meaning that hedonic motivations contribute toward utility as long as they are not the dominant motivator, but once they are they decrease the utility. These findings are summarized in the table below (Stock-Homburg, von Hippel, & Oliveira, 2014, pp. 17-20)3.
Motivation Innovative Relationship
dimension
Utilitarian Utility Positively correlated
Utilitarian Novelty Negatively correlated
Hedonic Utility Inverted U-shape
Hedonic Novelty Positively correlated
Table 2.3 - User motivation (hedonic vs. utilitarian) and correlations with innovative dimension (novelty vs. utility) (Stock-Homburg, von Hippel, & Oliveira, 2014)
In addition, they found that the key forces included:
* Feedback - Feedback is an important force for those who simply want to learn (advance
their skills), are or seeking personal growth or social interactions for enjoyment.
" Recognition - Recognition is a form of social reward, and has long been known to be a
motivating factor. Many people would rather have prestige over fortune.
" Energy generation/drain - Dr. Stock-Homburg did not go into great detail on this, nor
does the paper, but I understand it to be related to a person's extraversion. That is, extroverted people often are empowered by interaction with others, while introverts are
often depleted by these types of interactions.
And the resistance forces included:
3 Note that this table was not taken directly from the paper, but rather synthesized from key findings in
the paper.
- Genuine uncertainty4
- Cannibalization
- Margin erosion
- Expectations of failure
As additional background, it is interesting to note that the background personality theories include:
" Trait Theory - In trait theory, personality is fundamentally a set of traits, which may or
may not be immutable. A personality, then, is comprised of some number of traits. Dr. Stock-Homburg refers to these as "trait dimensions" and specifically described the five-factor model. In the five-five-factor model, there are five basic dimensions to a personality: openness to experience, extraversion, conscientiousness, agreeableness, and
neuroticism (McCrae & Oliver, 1991).
* Human Growth -Human growth theory is about the personality as a key to
self-fulfillment. Some seminal work in this model is the theory of personal behavior which describes two fundamental goal strivings: purposefulness, the awareness and purposeful directedness of an individual; and experienced meaningfulness, the "perceived significance" to an individual of their work activities (Barrick, Mount, & Li,
2013).
" Cognitive Filtering - Cognitive psychology filter theory treats says that we filter external
stimuli. For example, the Cognitive-Affective Personality System (CAPS) as described
by Walter Mischel. In this theory, the behavior of a person is a function of their
perceptions, and not strictly core personality traits. What is interesting about this is that it gives us a plausible way to account for why people with the same personality trait
dimensions (and interactions among dimensions) still behave differently when confronted with the same situation (Walter & Shoda, 1995).
Several authors point to the critical elements of the communal infrastructure that holds together the fabric of shared motivations and group behaviors. For instance, "commons" are the shared
4 Genuine uncertainty is a term meaning that an individual, in addition to not knowing the probabilities of
resources of a community, and frequently play a critical role in user motivations for creative works (Sukkasi, 2008).
The top parameters in this research area include:
" Personal motivations and incentives
" Transparency/openness
* Concerns for Intellectual Property * Profit
" Communication
* Cost of participation (a.k.a. charging/pricing model)
" Low barrier to entry
" Operating costs
Section 2.4: Open Source and Multi-Source Research
Open source software, and now hardware, has become the subject of a great deal of scrutiny and study. These terms have become quite loaded, and for this research I'd prefer to think of these types of activities as co-development of creative works. This has been a successful paradigm in many industries (Golden, 2005), but is new in the world of hardware, which is governed by patents more than copyrights (Open Source Hardware Association, 2015). Open source strategies can often yield a better result in terms of quality and efficacy, but are still sometimes perceived to provide less business value because of the sharing of Intellectual Property.Karl Fogel, in his landmark book "Producing Open Source Software", offers several pearls of wisdom about what makes open source software projects function from a motivational and societal perspective:
"Free software is a culture by choice. To operate successfully in it, you have to understand why people choose to be in it in the first place. Coercive techniques don't work. If people are
unhappy in one project, they will just wander off to another one. Free software is remarkable even among intentional communities for its lightness of investment. Many of the people involved have never actually met the other participants face-to-face. The normal conduits by which
humans bond with each other and form lasting groups are narrowed down to a tiny channel: the written word, carried over electronic wires. Because of this, it can take a long time for a
cohesive and dedicated group to form. Conversely, it's quite easy for a project to lose a potential participant in the first five minutes of acquaintanceship. If a project doesn't make a good first impression, newcomers may wait a long time before giving it a second chance."
(Fogel, 2006)
Fogel, Golden, and others offer several practical suggestions about how to succeed in co-development or co-engineering activities under an open source arrangement. The shared intellectual property and tasking responsibilities can be set up in a variety of different ways, and it remains true that some of the biggest drivers are of success in open source are around transparency and intellectual property, and accessibility remains important for participants to join and contribute easily.
A recent interview with Richard Stallman regarding the Digital Manufacturing Commons raised
some interesting questions (Stallman, 2015)1:
"Running models makes me worry. Are the models free software? And whose computer do they run on? Who chooses which version of the model to run?"
He also points out the challenge of speaking broadly about Intellectual Property (IP):
"It is a mistake to refer collectively to those three things [copyright, licenses, and patents]. That's what creates confusion."
This fundamentally is about management of Intellectual Property (IP), and relates to not only the user motivations described earlier, but organizational motivations. Successfully enabling both the individual and the organization is difficult, and the right set of policies for managing open
s Please note that citing this interview in no way implies that Dr. Stallman is in any way supporting open source. Dr. Stallman has made it clear that he supports the free software movement, and fundamentally disagrees with "open source".
source, shared source, and private source data and tools is a very precarious and important challenge.
Some of the top parameters in this category include:
* Transparency/openness
" Intellectual property
" Cost/pricing model
" Low barrier to entry * User incentives
" Communication
" Social responsibility
" Legal matters and licensing
" Operating costs
" Quality * Growth rate
Section 2.5: Key Findings of Previous Research
The literature review presented highlights several key areas of concern that are fittingparameters to model as variables. Many of the findings were too fine-grained to be effective for the level of our model, but when generalized give us a good set of parameters. As an example, crowd diversity is a good and important concept that we can model. Several of the references took this to a deeper level and discussed cognitive diversity, social diversity, skill diversity, etc. If we were focusing our model solely on diversity and its impact all of these would be good factors, but since are model is much higher-level and holistic, those have simply been distilled into "diversity".
Each of these parameters was scored across each literature review category and a summed score was generated for each. In rank order, the top eleven can be seen in the scoring matrix below:
Parameter Crowdsourcing & Innovation
incentives
crowd selection (diversity, specialization, population size, etc.)
intellectual property communication among crowd charging /pricing model transparency/openness Platform selection (feature selection, advanced capabilities, etc.) profit
low barrier to entry quality
I operating costs
14
13
Multi-Sided Psychology of Open Source & Platforms & User Motives Multi-Source
Markets 4 4 5 3 5 7 5 0 9 3 3 4 3 3 2 0 5 2 1 1 0 3 2 2 3 0 3 2 5 4 5 6 0 1 5 3 3 0 2
Table 2.4 - Top 11 key factors in rank order
I included the top 11 even though there appears to be a clear cutline at the 7th. This is because
the remaining four items I believe are very important in understanding financial performance overall of this type of platform.
In addition to the scoring matrix, I have mapped each parameter into the framework categories of business strategy, technology strategy, and awareness. The top parameters for each of these pillars of the framework can be seen below:
Type Parameter
awareness diverse range of clients awareness market leader
awareness having contacts in key markets awareness events sponsoring
awareness improve brand recognition awareness increase market channels awareness reach
awareness/business political infrastructure
awareness/business
strategy social infrastructure
Crowdsourcing & Innovation 1 1 0 1 1 1 0 0 Multi-Side Platforms Markets 0 0 1 0 0 0 0 0 0
& Psychology of Open Source &
& User Motives Multi-Source
0 1 0 _ 1 0 0 0 1 0 0 0 0 0 0 0 1 0 1
Table 2.5 - Top factors in the "Net Positive Awareness" pillar of the core framework
Rank 24.0 19.0 16.0 16.0 15.0 13.0 12.0 10.0 9.0 -I- 9.08.0 Rank 2.0 2.0 2.0 1.0 1.0 1.0 1.0 1.0 1.0 I I