HAL Id: hal-02361210
https://hal.archives-ouvertes.fr/hal-02361210
Submitted on 13 Nov 2019
HAL is a multi-disciplinary open access
archive for the deposit and dissemination of
sci-entific research documents, whether they are
pub-lished or not. The documents may come from
teaching and research institutions in France or
abroad, or from public or private research centers.
L’archive ouverte pluridisciplinaire HAL, est
destinée au dépôt et à la diffusion de documents
scientifiques de niveau recherche, publiés ou non,
émanant des établissements d’enseignement et de
recherche français ou étrangers, des laboratoires
publics ou privés.
Insect interaction analysis based on object detection and
CNN
Paul Tresson, Philippe Tixier, William Puech, Dominique Carval
To cite this version:
Paul Tresson, Philippe Tixier, William Puech, Dominique Carval. Insect interaction analysis based
on object detection and CNN. IEEE MMSP 2019, Sep 2019, Kuala Lumpur, Malaysia. �hal-02361210�
Insect interaction analysis based on object detection
and CNN
Paul TRESSON
∗†‡, Philippe TIXIER
∗†, William PUECH
‡, Dominique CARVAL
∗†∗CIRAD, UR GECO †GECO, Univ Montpellier ‡LIRMM, Univ Montpellier, CNRS
Montpellier, France
Email: {paul.tresson,william.puech}@lirmm.fr
Abstract—Direct observation to study biodiversity can be time consuming, however, other methods often provide indirect measurements and are possibly biased. To solve these problems, images can be a useful tool and ecologists have started to rely more and more on images as a source of data and on automated image analysis. However, the existing methods mostly perform image classification. In this paper we present an efficient method based on object detection to access deeper information the content of an image. Using high resolution images, we built a pipeline to slice the original images, perform detections and later refine these observations. We illustrate the interest of this pipeline by using it on-field images taken in agroforestery banana-coffee systems to study invertebrate communities around the banana pests Cosmopolites sodidus and Metamasius sp. and the interactions between the different animals within this community. Experimental results show that our pipeline reaches 87.8% F1-score and allows us to successfully detect and identify 23 species and ant castes. These 23 species are divided into 7 super-classes, but the ant super-class, that shows more individuals and interactions is described more precisely. We are then able to study the interaction network between different species of this community and identify major predators of banana pests within this ecosystem.
Index Terms—Image processing, Animal detection, Interaction study, Convolutional Neural Network, Trophic networks, Sentinel prey experiment, On-field image.
I. INTRODUCTION
Understanding and quantifying interactions between species is a challenging task for ecologists. As images provide a rich source of data, they are used more and more by ecologists to access information about biodiversity, its behaviour and the interactions within a community. As a consequence, ecologists rely increasingly on image analysis and computer vision processes [1].
To date, one of the most developed applications of computer vision in ecology is the identification of species [2]. These kinds of applications are used in citizen-science initiatives [3] and rely mostly on classification [4] [5]. However, researchers tend to use object detection to analyze images [6] [7]. Studies that have used object detection in ecology so far perform on datasets featuring large objects on relatively low resolution
Copyright 978-1-7281-1817-8/19/$31.00 ©2019 European Union
images and therefore encounter difficulties with images that contained numerous, small, or grouped objects.
For our purposes, we then sought inspiration in methods used in satellite image analysis, that also feature small objects and take large images as input [8].
This paper aims to propose a pipeline, based on computer vision, to reconstruct the interaction network and predation re-lationships among a community of small invertebrates. Images are taken during a sentinel-prey experiment to study predators of weevils Cosmopolites sordidus and Metamasius sp. as eggs, larvae or adults. These images are high resolution and display numerous small objects. To perform object detection, we rely on the use of deep learning and more precisely Convolutional Neural Networks (CNN). Here, we use the YOLOv3 model [9], which is now a state of the art network for object detection. However, to be able to work with high resolution images, we slice the original images into smaller slices that can be easily processed by the network. After detection is performed on each slice separately, detections are merged back together and refined. As we study invertebrates moving on a 2D surface, we can detect physical interactions between them as the intersection of associated bounding boxes.
We first present the proposed method in Section II, by developing the process of the pipeline with slicing and re-fining as well as the metrics used to assess its performances. Afterwards, we present experimental results in Section III. In particular, we present our dataset, the general performances of the pipeline, a detailed example and a focus on ants, which are a particularly important class of insect in the studied community. Finally, we analyze the invertebrate interaction network, as enabled by the pipeline. We conclude and give some perspectives in Section IV.
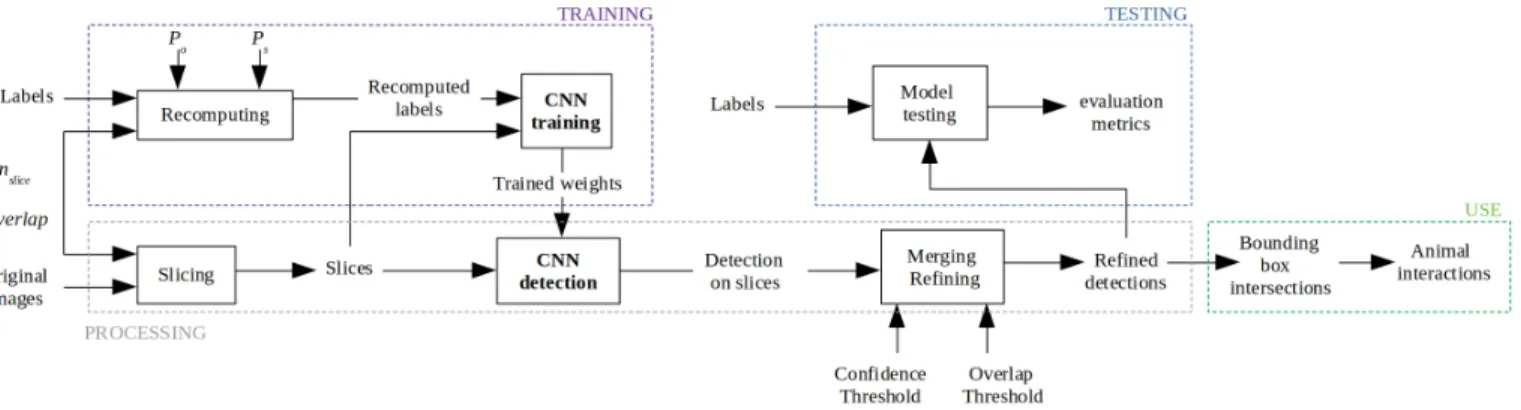
II. PROPOSED METHOD A. Overview
To be able to use an object detection CNN with high resolution images featuring numerous small objects, we slice an original image into smaller slices. This allows us to perform detection without information loss due to resizing. For model training, slicing is performed and an object detection CNN is trained on the sliced dataset. For model testing and use, images
Fig. 1. Overview of the proposed method.
are sliced, detection is performed, detections are then merged back together and refined to suppress potential duplicates. The proposed method is summarized in Fig. 1.
B. Slicing
Original images are sliced into nslice× nslice pixel slices.
Slices are cropped with an overlap to reduce the risk of an object being cut off on the edge of a slice. Before model training, original labels are recomputed within the referential of the slice. An object is considered within a slice and its label recomputed if one of the following conditions are met:
1) Its centroid (x and y coordinates) are within the slice. 2) A minimal proportion Pobject of the object appears on
the image.
3) A minimal proportion Pslice of the slice is covered by
the object.
Condition (1) ensures that the object appears in the sliced dataset. Condition (2) helps with small elements (e.g., anten-nas) that should not be learned by the model as a complete object. On the contrary, condition (3) helps with objects larger than a slice, so that the object would not only appear on the centroid slice. For model testing and use, images are sliced into slices of the same size as used in training.
C. Refining
Object detection is performed separately on each slice. Afterwards, detections are merged back together within the referential of the original image. Due to the overlap, some objects may be detected several times. To suppress potential duplicates, a refining step is added. Within an image, all detections of the same class are compared pairwise. If two bounding boxes A, of area areaA, and B, of area areaB
intersect, with areaintthe area of overlap, areaareaint
A and
areaint
areaB
ratios are computed. If one of these ratios exceeds a given OT (overlap threshold), only the largest box is retained. This decision rule allows the identification and suppression of duplicates that are mostly contained within another larger box. Detections are later filtered above a given minimal CT (confidence threshold). Then, refining can only raise precision (see section II-D), by suppressing False Positives (FP). On
the other hand it can only decrease recall by generating False Negatives (FN). To optimize refining, it is therefore needed to minimize the recall decrease and maximize the precision increase.
D. Evaluation metrics
To assess model performances, refined detections are com-pared with ground truth labels. The IoU (Intersection over Union) is used to compare bounding boxes. Detections are accepted as True Positive (TP) if IoU > 0.5 and if the detected class is correct. Otherwise, the detection is counted as FP. As well, duplicates are counted as FP. If a ground truth object is missed, it is counted as FN. Performances are assessed with precision, recall, F1-score:
precision = T P T P + F P, (1) recall = T P T P + F N, (2) F 1 = 2 × precision × recall precision + recall. (3) For each class, the Average Precision (AP) is computed as the area under the precision-recall curve. AP is used to compare performances between classes. We rely on F1-score to assess the overall performances of the model.
E. CNN training
We use YOLOv3 [9] as CNN object detection model at the core of our pipeline. Training is conducted within the associated Darknet framework [10].
During training, data augmentation is performed on every batch with new random changes. Changes are applied to hue (up to 10% change), saturation (up to 50% change) and exposure (up to 50% change).
As we are working with a relatively small dataset, overfitting is a phenomenon to monitor. Test performances are monitored during training to prevent overfitting. Training is stopped when the pipeline shows maximal test performances. Also, the train losstest loss ratio is computed to assess possible overfitting
[11]. A ratio close to one ensures that the model does not reach overfitting.
F. Interactions
We observed animals walking on a 2D surface, we can thus use the intersection of bounding boxes to detect physical interactions between two individuals. After refining, every intersection between two bounding boxes is then counted as an interaction. As we work with bounding boxes and not masks, there may be intersections of bounding boxes without real physical contact. However, the intersection of bounding boxes ensures that animals are within very close range to each other. We chose to consider this as a physical interaction, as this means that at least one of the participants of the interaction is willing to engage physical contact with the other.
To provide further nuances, interactions are characterized depending on the known or observed behaviour of a species towards another. Interactions between predators and prey are labelled as predation if the prey is alive and scavenging if the prey is already dead at the beginning of the experiment. Inter-actions between two predators of different species are labelled as competition, whereas interactions between two predators of the same social species are labelled as cooperation. Finally, animals whose behaviour towards others where not clearly identified are labelled as undefined.
III. EXPERIMENTAL RESULTS A. Dataset
We used a camera (Lumix FZ300) on a tripod (Manfrotto Befree Advanced) with the lens facing the ground (distance of 160 mm) with the following manual settings: exposure time of 1/50 s, opening of 4, ISO of 400, flash power of 1/40, resolution of 12M P (3, 000 × 4, 000 pixels). Prey-sentinels (dead and living adult weevils, weevil eggs and larvae) were deposited on a light-brown sheet of A4 paper, which was attached to a sheet of plywood. We programmed the camera to take one picture every 30 s during 5 hours and we replicated the experiments 3 times leading to a set of 1,800 images.
We used 95 images as a training dataset and 93 different images as a test dataset. We selected images displaying as many classes and as many different situations as possible (e.g., crowded scenes, images from different sessions). These images feature 4087 animals belonging to 23 classes with a mean of 21.8 objects per image. The average width of the object featured is 98.7 ± 64.5 pixels (2.4% of image width) and the average height of the objects featured is 98.1 ± 63.9 pixels (3.2% of image height). Our images then display numerous and small objects. In comparison, the Pascal VOC 2007 dataset [12] features a mean 3.12 objects per image with mean width and height of 30.1% and 38.8% respectively. After slicing, the slices containing objects feature a mean 1.73 objects of mean width and height of 21.8% and 21.9% respectively. This proves slicing eases the task of object detection CNN.
Animals were identified as the most precise class we were able to determine (down to ant caste). As presented in Table I, results are as well presented with these classes summarized
TABLE I
CLASSES AND CORRESPONDINGSUPER-CLASSES. Super-classes Classes
Ant
Camponotus atricepsmajor Camponotus atricepsminor Ectatoma ruidum
Nylanderiamsp1 Odontomachus bauri Pheidole radoskowskiimajor Pheidole radoskowskiiminor Solenopsis geminataminor Wasmannia auropunctata Spider Araneae msp1 Araneae msp2 Araneae msp5 Araneae msp6 Araneae msp7 Opilones msp1 Cockroach Blattidae msp1 Blattidae msp2 Blattidae msp3 Slug Stylommatophora msp1 Stylommatophora msp2 Larva Metamasiuslarva
Egg Cosmopolites sordidusegg Weevil Cosmopolites sordidus
into 7 super-classes (ant, cockroach, weevil, spider, larva, egg, slug). For the interaction study, images from two full nights of recording are used, meaning a total of 1,191 images (some images providing no biological relevant information were removed).
B. slicing and refining parameters, CNN training
We choose nslice = 416 pixels and an overlap of 0.2
(meaning 83 pixels). Each original image then generates 108 slices. Labels are kept for Pobject = 0.4 and Pimage = 0.5.
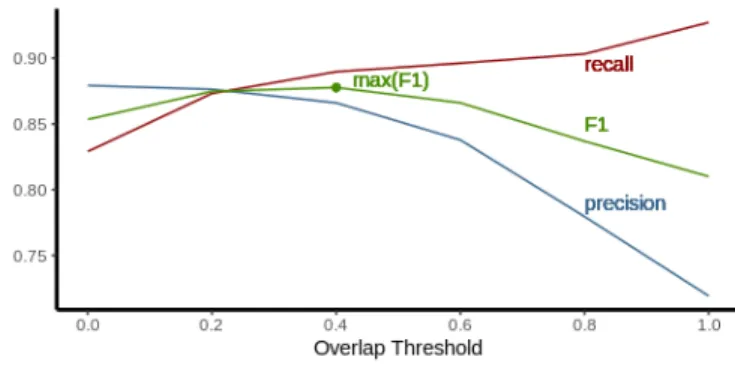
We chose these parameters empirically according to the size of the objects featured in our dataset. We choose to maximize F1-score, we then selected an overlap threshold of 0.4 (see Fig. 2). Following this reasoning, we selected a confidence threshold of 0.2.
Fig. 2. Precision, recall and F1-score as a function of the overlap threshold. Training is conducted with the following parameters: batch size = 64, momentum = 0.9, decay = 0.0005, and learning rate = 0.001. The model was trained over 49 500 iterations (meaning 160 epochs), starting from pre-trained layers (https:
TABLE II APPER SUPER-CLASS.
Super-classes Classes train test AP (±σ) Ant 9 1467 1395 0.84 ± 0.29 Cockroach 3 35 31 0.18 ± 0.15 Egg 1 89 85 0.85 ± 0.00 Larva 1 296 294 0.94 ± 0.00 Slug 2 16 14 0.63 ± 0.55 Spider 6 18 14 0.64 ± 0.50 Weevil 1 173 167 0.90 ± 0.00 //pjreddie.com/media/files/darknet53.conv.74). At 49 500 iter-ations, the train losstest loss ratio reaches 1.01 and test are performed, this ensures that overfitting is avoided.
C. Performances
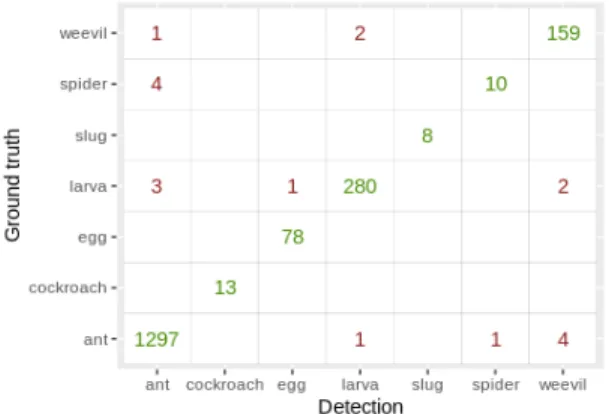
AP per super-class are to be seen in Table II. Our pipeline reaches 86.6% precision, 88.9% recall and 87.8% F1-score on precise classes. By summarizing these classes into super-classes, precision, recall, and F1 rise to 89.6%, 91.2%, and 90.4% respectively. A confusion matrix on super-classes is presented in Fig. 3. Ants provide the most training examples, but also the most classes. Therefore they show a good AP, but it experiences strong variations between classes. Larvae and adult weevils have a very distinct appearance and so are easy for the network to locate and classify correctly. Cockroaches are relatively large insects in comparison to other classes featured here and have long antennas and legs that are difficult for the network to frame correctly, leading to FN and therefore a low AP.
As shown in Table III, overlap during slicing appears to be a necessary precaution, as all performance metrics are significantly lower without overlap than with an overlap. Precision drops significantly due to numerous FP. As we chose to maximize F1-score, the advantages of the overlap during slicing and of refining appear clearly.
Fig. 3. Confusion matrix on super-classes presented in Table I.
D. Robustness
Robustness of the method is partly ensured by slicing. During learning, the CNN is confronted with the majority of slices (8,221 out of 10,260, meaning 80.1%) featuring only
TABLE III
PERFORMANCES WITHOUT OVERLAP DURING SLICING AND WITHOUT REFINING.
Metric Without overlap Without refining Overlap and refining Precision 68.2% 71.4% 86.6% Recall 79.7% 92.8% 88.9%
F1 73.5% 80.7% 87.8%
background, with several details and shapes that could be confused with animals. In fact, if trained on slices featuring objects only, a tradeoff between evaluation metrics happens. Using with precise classes, recall rises to 91.4%, meaning that the CNN generates less FN but precision drops to 81.1 %, meaning that the CNN generates more FP. As the CNN is only trained on slices with objects, it becomes better at finding them. However, since it has seen less confusing background cases, it is also more likely to mistake small branches or dirt for an insect. The maximal F1-score reached by the CNN is 85.6%, which is less than the value reached by a training sample with all background slices (87.8%).
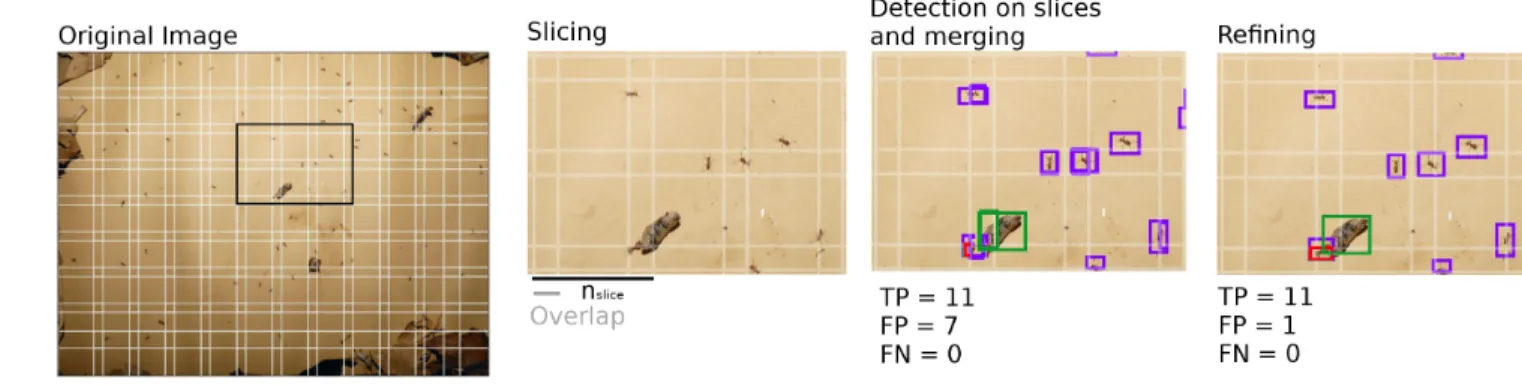
E. Full Example
To illustrate detections processing during refining, we present a full example with an image belonging to the test dataset (see Fig. 4). The image is sliced into 108 slices and detection is performed separately on each slice. The overlap avoids FN, but then leads to several duplicates, that are counted as FP. Duplicates are mostly caused by overlap. For instance in Fig. 4, the larva is to be seen entirely on a slice and also partly on the neighbouring slice, where the same larva is also detected. This duplicate is then contained within the bounding box associated to the entire larva. After refining, the FP number on this example drops from 7 to 1, caused by a misclassification.
F. Focus on the ant super-class
Ants show more individuals and more classes than other super-classes. Therefore detail more precisely performances on this super-class. Confusion mostly happens between ants belonging to the same species and to different castes. For instance, P. radoszkowskii minor are mostly confused with P. radoszkowskiimajor and Camponotus atriceps minor with Camponotus atricepsmajor. The most common class is Phei-dole radoszkowskii minor. As a consequence, this class is seen more often by the network during training and similar classes (e.g. Nylanderia msp1 or Solenopsis geminata minor) are confused for P. radoszkowskii minor (see Fig. 5).
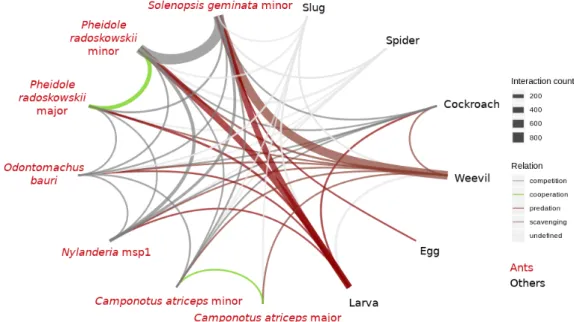
G. Interaction analysis
All interactions recorded between species are displayed in Fig. 6. Most of the interactions concern ants (6,688 interac-tions out of 6,972, meaning 95.9 %). The high number of ant-ant interactions is mostly caused by intraspecific interactions. For instance, e.g. P. radoszkowskii minor - P. radoszkowskii major account for 227 interactions and P. radoszkowskii minor - P. radoszkowskii minor for 1,004 interactions.
Fig. 4. Illustrated example of pipeline processing on an image from the test dataset.
Fig. 5. Ant confusion matrix.
In our dataset, ants appear to be the principal predators of the prey available (weevil, larvae and eggs). Cockroaches can be seen preying upon larvae and are also defined as predators. Interactions between ants or cockroaches towards other living species are therefore labelled as predation. Interactions be-tween different predators happen when competing for a prey. However, spiders and slugs only seem to cross paths with other species without openly attacking or flying in front of another animal. Their relation towards other animals are labelled as undefined. Ants and cockroaches only succeed in attacking weevils if they are already dead and do not achieve predating a living individual. Their relationship towards weevils are then labelled as scavenging. Finally, ants of a same species, but different caste interact during cooperation to catch a prey. An interaction network representing interspecific interactions is drawn in Fig. 7. As their behaviour does not alter between classes, classes other than ants are summarized into super-classes for the sake of clarity. Based on the interaction number recorded here, P. radoszkowskii and S. geminata seem to be major actors in the observed community. Both are responsible for most of the interactions with Metamasius larvae. Further-more, S. geminata are the primary consumers of C. sordidus. S. geminataalso are the only recorded consumers of C. sordidus eggs.
IV. CONCLUSION
Ecological information presented in this paper is solely the result of a three night record and is therefore more illustrative
Fig. 6. Interaction matrix between each super-class.
than really significant. However, this proves the relevance of this method for the study of animals and ecological networks. Our pipeline enables us to handle high resolution images and to detect with high precision and recall numerous small objects belonging to several classes. Some of these inverte-brates belong to visually similar classes and the network is able to correctly classify ants down to caste.
However, precision and recall could still be improved for rare classes. Also, unknown classes can be an issue and impact the significance of the ecological output. A way to handle these issues can be an implementation of a hierarchical classification. Such algorithms have already been successfully used in general object detection methods [13] as well as for handling ecological data [14].
We studied physical interactions as the intersection of over-lapping bounding boxes, however interactions without physical contact can also be observed, such as flight of a prey before a predator. A tool to study this could be object tracking. Tools have recently been developed to perform tracking of multi-ple, small animals [15]. Further statistical and deep learning methods could then be used to analyze animal behaviour.
ACKNOWLEDGEMENTS
This work was supported by the French National Research Agency under the Investments for the Future Program, referred to as ANR-16-CONV-0004. The Ph.D. thesis of P. Tresson was funded by CIRAD and #DigitAg grants.
Fig. 7. Interaction network based on recorded interactions.
REFERENCES
[1] S. L. Pimm, S. Alibhai, R. Bergl, A. Dehgan, C. Giri, Z. Jewell, L. Joppa, R. Kays, and S. Loarie, “Emerging technologies to conserve biodiversity,” Trends Ecol Evol, vol. 30, no. 11, pp. 685–696, 2015. [Online]. Available: https://www.ncbi.nlm.nih.gov/pubmed/26437636 [2] B. G. Weinstein, “A computer vision for animal ecology,” J Anim
Ecol, vol. 87, no. 3, pp. 533–545, 2018. [Online]. Available: https://www.ncbi.nlm.nih.gov/pubmed/29111567
[3] A. Swanson, M. Kosmala, C. Lintott, and C. Packer, “A generalized approach for producing, quantifying, and validating citizen science data from wildlife images,” Conserv Biol, vol. 30, no. 3, pp. 520–31, 2016. [Online]. Available: https://www.ncbi.nlm.nih.gov/pubmed/27111678 [4] M. S. Norouzzadeh, A. Nguyen, M. Kosmala, A. Swanson, M. S.
Palmer, C. Packer, and J. Clune, “Automatically identifying, counting, and describing wild animals in camera-trap images with deep learning,” Proc Natl Acad Sci U S A, vol. 115, no. 25, pp. E5716–E5725, 2018. [Online]. Available: https://www.ncbi.nlm.nih.gov/pubmed/29871948 [5] M. Willi, R. T. Pitman, A. W. Cardoso, C. Locke, A. Swanson, A. Boyer,
M. Veldthuis, L. Fortson, and O. Gaggiotti, “Identifying animal species in camera trap images using deep learning and citizen science,” Methods in Ecology and Evolution, vol. 10, no. 1, pp. 80–91, 2018.
[6] B. G. Weinstein, “Scene-specific convolutional neural networks for video-based biodiversity detection,” Methods in Ecology and Evolution, vol. 9, no. 6, pp. 1435–1441, 2018.
[7] A. Loos, C. Weigel, and M. K¨ohler, “Towards automatic detection of animals in camera-trap images,” 2018 26th European Signal Processing Conference (EUSIPCO), pp. 1805–1809, 2018.
[8] A. V. Etten, “Satellite imagery multiscale rapid detection with windowed networks,” CoRR, vol. abs/1809.09978, 2018. [Online]. Available: http://arxiv.org/abs/1809.09978
[9] J. Redmon and A. Farhadi, “Yolov3: An incremental improvement,” CoRR, vol. abs/1804.02767, 2018. [Online]. Available: http://arxiv.org/ abs/1804.02767
[10] J. Redmon, “Darknet: Open source neural networks in c,” http://pjreddie. com/darknet/, 2013–2016.
[11] I. Goodfellow, Y. Bengio, and A. Courville, Deep Learning. MIT Press, 2016, http://www.deeplearningbook.org.
[12] M. Everingham, L. Van Gool, C. K. I. Williams, J. Winn, and A. Zisser-man, “The pascal visual object classes (voc) challenge,” International Journal of Computer Vision, vol. 88, no. 2, pp. 303–338, Jun. 2010. [13] J. Redmon and A. Farhadi, “YOLO9000: better, faster, stronger,”
CoRR, vol. abs/1612.08242, 2016. [Online]. Available: http://arxiv.org/ abs/1612.08242
[14] J. G. Colonna, J. Gama, and E. F. Nakamura, “A comparison of hierarchicalmulti-output recognition approaches for anuran classifica-tion,” Machine Learning, vol. 107, no. 11, p. 21, 2018.
[15] F. Romero-Ferrero, M. G. Bergomi, R. C. Hinz, F. J. H. Heras, and G. G. de Polavieja, “idtracker.ai: tracking all individuals in small or large collectives of unmarked animals,” Nature Methods, vol. 16, no. 2, pp. 179+, FEB 2019.