HAL Id: hal-02053137
https://hal-amu.archives-ouvertes.fr/hal-02053137
Submitted on 1 Mar 2019
HAL is a multi-disciplinary open access
archive for the deposit and dissemination of
sci-entific research documents, whether they are
pub-lished or not. The documents may come from
teaching and research institutions in France or
abroad, or from public or private research centers.
L’archive ouverte pluridisciplinaire HAL, est
destinée au dépôt et à la diffusion de documents
scientifiques de niveau recherche, publiés ou non,
émanant des établissements d’enseignement et de
recherche français ou étrangers, des laboratoires
publics ou privés.
Partha Pratim Roy, Youshitoka Kato, Rei Abe-Yoshizumi, Elisa Pieri, Nicolas
Ferré, Hideki Kandori, Tiago Buckup
To cite this version:
Partha Pratim Roy, Youshitoka Kato, Rei Abe-Yoshizumi, Elisa Pieri, Nicolas Ferré, et al.. Mapping
the ultrafast vibrational dynamics of all- trans and 13- cis retinal isomerization in Anabaena
Sen-sory Rhodopsin. Physical Chemistry Chemical Physics, Royal Society of Chemistry, 2018, 20 (48),
pp.30159-30173. �10.1039/c8cp05469j�. �hal-02053137�
Journal Name
ARTICLE
Received 00th January 20xx, Accepted 00th January 20xx DOI: 10.1039/x0xx00000x www.rsc.org/Mapping the Ultrafast Vibrational Dynamics of all-trans and 13-Cis
Retinal Isomerization in Anabaena Sensory Rhodopsin
Partha Pratim Roy,a Youshitoka Kato,b Rei Abe-Yoshizumi,b, c Elisa Pieri,d Nicolas Ferré,d Hideki
Kandori b,c and Tiago Buckup*, a
Discrepancies in the isomerization dynamics and quantum yields of the trans and cis retinal protonated Schiff base is a well-known issue in the context of retinal photochemistry. Anabaena Sensory Rhodopsin (ASR) is a microbial retinal protein that comprises a retinal chromophore in two ground state (GS) conformations: all-trans, 15-anti (AT) and 13-cis, 15-syn (13C). In this work, we apply impulsive vibrational spectroscopic techniques (DFWM, pump-DFWM and pump-IVS) to ASR to shed more light on how the structural changes take place in the excited state within the same protein environment. Our findings point to distinct features in the ground state structural conformations as well as to drastically different evolutions in the excited state manifold. The ground state vibrational spectra show stronger Raman activity of the C14-H out-of-plane
wag (at about 805 cm-1) for 13C than for AT isomer, which hints at a pre-distortion of the 13C in the ground state. Evolution
of the Raman frequency after interaction with actinic pulse shows a blue shift for the C=C stretching and CH3 rocking mode
for both isomers. For AT, however, the blue shift is not instantaneous as observed for the 13C isomer, rather it takes more than 200 fs to reach the maximum frequency shift. This frequency blue shift is rationalized by a decrease of the effective conjugation length during the isomerization reaction, which further confirms a slower formation of the twisted state for the AT isomer and corroborates the presence of a barrier in the excited state trajectory previously predicted by quantum chemical calculations.
Introduction
Photo-induced isomerization of retinal protonated Schiff base (RPSB) powers many fundamental biological processes like photosynthesis, vision, gene expressions by initiating the photocycle via the conversion of light energy to chemical potential.1-8 Retinal derivative, which serves as the central
element for these photo-chemically triggered biological activity, is found to be covalently bound to a Lysine residue of the seventh helix of the protein membrane in all retinal pigments.9, 10 Retinal is well known for its different structural isomeric
forms in a variety of organisms e.g. 11-cis in visual rhodopsin,
9-cis in iso-rhodopsin, all-trans in microbial retinal protein
(MRP) and the widely varying reaction rates and the isomerization efficiencies in these proteins. For instance, the retinal isomerization in visual pigments takes place within 100 fs11-14 with a quantum yield about 65%15 whereas it takes
more than 0.6 ps to complete the isomerization with a yield
<40% for MRP´s.16-18 On the other hand, the
photo-isomerization of RPSB (all-trans) in solution happens in a much slower rate (~1 ps)19-21 and leads to the formation of a
mixture of different stereo-isomers with a quantum yield of few percent for each subproduct.22 All these observations have
been taken as an indication that the electrostatic interaction between the retinal chromophore and the amino acid residues of the surrounding protein steers the isomerization reaction.
In recent decades, there have been extensive experimental12, 14, 23-29 and theoretical30-34 investigations
performed to explore the underlying mechanism of this ultrafast isomerization reaction. Visual rhodopsin and bacteriorhodopsin (BR) are two retinal proteins which have been most thoroughly studied in this regard. In general, the retinal isomerization is believed to be initiated by a rapid reorganization of C-C bond length within few tens of femtosecond after the excitation, known as bond length alternation (BLA),32 to form the sub-picosecond reactive excited
state coined as I intermediate.35 For BR, this state decays
non-exponentially to form J intermediate35, 36 during the course
of internal conversion (IC) which is associated with a weak spectral evolution.37, 38 Moreover, the cross section of the
emission state has been found to be constant throughout the fluorescence lifetime.38 Both of these observations have been
interpreted as a non-ballistic internal conversion. Retinal isomerization in visual rhodopsin, however, differs from that: Dramatic spectral evolution during the IC12, 14, 27 has been
interpreted as a coherent isomerization reaction12, 14, 39 where a
a.Physikalisch-Chemisches Institut, Ruprecht-Karls Universität Heidelberg, D-69210,
Heidelberg, Germany.
b.Department of Life Science and Applied Chemistry, Nagoya Institute of
Technology, Showa-ku, Nagoya 466-8555, Japan.
c. OptoBioTechnology Research Center, Nagoya Institute of Technology, Showa-ku,
Nagoya 466-8555, Japan.
d.Aix-Marseille Univ, CNRS, ICR, Marseille, France
† Footnotes relating to the title and/or authors should appear here.
Electronic Supplementary Information (ESI) available: [details of any supplementary information available should be included here]. See DOI: 10.1039/x0xx00000x
nuclear wave packet generated by impulsive stimulated Raman scattering (ISRS) evolves in a ballistic fashion towards the ground state potential surface.
This contrast between the nature and speed of the isomerization reactions for two different classes of retinal proteins has been often rationalized by the difference in the planarity of the ground state (GS) structures of RPSB bound inside the cavity of retinal pocket.40 Structural strains on RPSB
inside different protein pockets, originate either due to distinct structural conformations of each isomer or due to the change in the electrostatic interaction between RPSB and the protein moiety. Structural investigations9, 40, 41 have shown that 11-cis
GS isomer in visual rhodopsin is present as a non-planar, pre-twisted structure which facilitates the reaction to proceed rapidly.42 However, for BR neither NMR studies40, 43 nor the
resonance Raman spectra44 indicates any evidence of such a
pre-twisting for the GS all-trans isomer. Furthermore, a quantum chemical computational study42 of an artificially
twisted retinal in gas phase showed sub-100 fs dynamics which further indicates the pre-straining alone can lead to a rapid isomerization process even in absence of any specific electrostatic interaction of RPSB with the surrounding.
One systematic way to point out the reason would be to investigate RPSB of two different conformations under the same protein environment. Recently discovered Anabaena Sensory Rhodopsin (ASR) has been assisting to shed new light on this issue.7, 9, 45-47 Like other MRP’s, it comprises 13-cis,
15-syn (13C) and all-trans, 15-anti (AT) in GS. Being a photochromic sensor, the isomeric ratio depends on the wavelength of external illumination light.45 When it is
illuminated with an orange light (~590 nm) it forms a mixture (~40:60) of AT and 13C isomers in light adapted (LA) photo-stationary equilibrium.46, 47 On the other hand, it adopts a
thermally relaxed AT form under dark adapted (DA) condition. Within the photocycle (Fig. 1), each of the AT and 13C isomers undergoes isomerization around C13=C14 in sub-ps time scale
that results in a hot photo-intermediate J (13-cis, 15-anti and all-trans, 15-syn, respectively). Later, it forms the K-photoproduct (KAT and K13C) within 100 ps via vibrational
relaxation. Subsequently, both KAT and K13C undergo further
isomerization around C15=N on a longer time scale (<nS) to
generate the 13C and AT GS respectively (Fig. 1). Therefore, ASR is a unique member among the rhodopsin family which allows to compare the isomerization reaction in both directions (AT to 13C and 13C to AT) of the photo-cycle within the same protein environment. This is extremely advantageous to evaluate the individual effect of GS conformation on the isomerization dynamics. Pump-probe spectroscopy has already showed the stark contrast in the reaction kinetics of AT and 13C isomer in ASR.46, 47 It has been observed that the 13C isomer shows a
ballistic kinetics46 and the isomerization completes within
100 fs, which is very similar to visual rhodopsin.46, 47 The AT
isomer shows, however, about seven fold (about 750 fs)46, 47
slower kinetics, which is reminiscent to BR. This large disparity in the reaction dynamics has been qualitatively explained by the quantum chemical excited trajectory calculation, which suggests the existence of a small barrier or plateau in the
excited potential energy surface of AT isomer but not for the 13C isomer.31 The quantum yield (QY) of the photoproduct after
the isomerization for each direction is also very different: it is about 2.7 times higher for the AT than that of the 13C isomer.48
Lower quantum yields with short excited state lifetimes (ESL), often observed also in other proteins, has often been interpreted as a discrepancy lacking clarification. Ultimately, the ESL and QY are two fundamentally independent quantities: While the former depends on the topology near the Franck-Condon region and potential barriers in the ES surface, the latter depends on the shape of conical intersection (CI) seam and the wave packet trajectories. A potential way to address this persisting question is the comparison of isomer specific ultrafast structural changes in each case, which will give more insight into the molecular origin of this difference in potential energy surfaces.
In the context of retinal isomerization mechanism, a few vibrational modes such as torsion, C=C and C-C stretching, hydrogen out of plane (HOOP) wags are well known to participate in this reaction. A detailed study of the origin and evolution of the vibrational modes in the ground and excited state has been reported mainly for visual rhodopsin,23, 28, 49 BR24, 25, 50 and RPSB in solution.51-54 Low frequency torsional modes
(<400 cm-1) are well accepted as one of the key features of ES
wave packet dynamics. In particular, a set of rapidly damped low frequency coherences (100-400 cm-1) has been observed in
the spectral region of stimulated emission and excited state absorption.28, 50, 52-57 Pump-impulsive vibrational spectroscopic
studies28, 53, 56 on RPSB both in solution and inside the protein
environment have shown that these modes are activated only after the initial excited relaxation of RPSB. Beside the low frequency torsion, the HOOP wag (800-1000 cm-1) is the most
frequently discussed vibrational mode. This out of plane mode, being Au/ A2 symmetric, is Raman inactive for RPSB of planar
geometry which belongs to C2v (cis) or C2h (all-trans) point group
and gets Raman activated, only when the RPSB adopts a distorted non-planar structure. Hence, the activity of this mode is an indicator of non-planarity or pre-twisting of the RPSB in GS, as well as of the degree of distortion during the isomerization due to the rotation around the isomerizing C=C bond.23, 28, 58
Moreover, a number of experimental observations28, 59 and
quantum chemical computations32, 60 have also suggested that
Figure 1: Schematic representation of the photocycle of AT and 13C isomer of ASR. After excitation, each isomer undergoes isomerization around C13=C14 bond in sub-ps timescale to form the corresponding hot photo-product, JAT and J13C, which generate KAT and K13C within 100 ps, respectively. Subsequent isomerization around C15=N occurs on sub-ns time scale to complete the photo-cycle.
the phase and amplitude of the HOOP mode control the stereochemical outcome of the retinal photo-isomerization. Finally, high frequency (>1000 cm-1) wave packet dynamics have
been very often interpreted as GS wave packet motion25, 61 with
very few reports62, 63 proposed that the conformational changes
during the isomerization result in the modulation of the amplitude and frequency of the high frequency fingerprint modes.
In this work, we apply (multidimensional) time resolved vibrational spectroscopic techniques like degenerate four wave mixing (DFWM),50, 52 pump-degenerate four wave mixing
(pump-DFWM)53, 64-66 and pump-impulsive vibrational
spectroscopy (pump-IVS)28, 58, 65, 67 to compare the vibrational
dynamics of AT and 13C isomers of ASR. Tracking the excited state evolution of the nuclear wave packet shows (i) a delayed appearance of low frequency (100-400 cm-1) modes and (ii) a
blue shift for two characteristic high frequency modes: CH3 rock
(~1000 cm-1) and C=C stretch (~1500 cm-1) modes. The delayed
rise of the low frequency (100-400 cm-1) modes supports the
indirect activation mechanism of the delocalized torsional modes by localized high frequency (>1000 cm-1) modes, such as
C=C stretch, via internal vibrational energy redistribution (IVR).50, 53 Experimentally observed blue frequency shifts during
the course of isomerization hints at an reduction of the effective π-conjugation length due to the formation of non-planar 90° twisted state. Most remarkably, AT shows a slower frequency shift than 13C, which according to our interpretation, indicates AT reaches this twisted state much later than the 13C isomer. In addition, a relatively stronger amplitude of the HOOP mode in the GS of 13C compared to AT has been observed both in non-resonant DFWM, IVS and spontaneous Raman spectra which indicate that the GS of the 13C isomer is more pre-twisted than AT isomer of the RPSB in ASR.
Experimental methods and analysis
Sample preparation
ASR sample was prepared according to the standard reported protocol.47 A purified sample was concentrated and dialyzed
against a buffer solution containing 200 mM NaCl, 25mM Tris-HCl to maintain pH 7.0 and 0.01% DDM (n-Dodecyl-β-D-Maltopyranoside, Anagrade, Anatrace) was added to help the protein to get stabilized by forming micelles. For pump-probe experiments, the concentration of DDM was reduced (still above the CMC of DDM: 0.007%) compared to that used in the previous report,47 in order to minimize the formation of bubbles
while circulating it through the flow cell during the measurement.
Time-resolved experiments
The experimental setup used for the pump-DFWM and pump-IVS study is shown in Fig. S1 and S2, respectively. Briefly, a regeneratively amplified Titanium-Sapphire laser system (795 nm, 1 kHz) was used as fundamental laser source. The
output was equally divided into two home built non-collinear optical parametric amplifiers (nc-OPA’s) to generate the ultrashort actinic-pulse (AP) and degenerate pump/stokes/probe (DFWM) or push/probe (IVS) spectra (Fig. 2). In pump-DFWM and pump-IVS, the spectrum of the actinic pulse was spectrally resonant to the GS absorption (Fig. 2(a)), while the DFWM/IVS spectra overlapped with the photo-induced absorption (PIA) band of ASR (Fig. 2(b)). All pulses were compressed below 15 fs by a prism pair (Fig. S3).
The energy of the actinic pulse beam was attenuated to 100 nJ and focused to a spot with a diameter of 90 µm. The diameter of each of the DFWM/IVS beams was set to 50 µm and the energy to about 50 nJ. The delay between pump and push pulse (T) was controlled by a mechanical delay stage. For all measurements, the probe delay (τ) was scanned using a rapid scan approach. A single transient, with a length of 2 ps and time steps of 4 fs, was acquired in about 500 ms.
The optical density (OD) of the ASR sample was around 0.7 at 545 nm (λmax). The sample was circulated through a fused
silica flow cell with path length a 0.5 mm by a motor-driven pump to ensure that illuminated volume of the sample was replenished between two consecutive laser shots. The flow rate was optimized during the measurement in order to avoid the formation of bubbles. The sample was kept in dark overnight for dark adapted (DA) measurements. For light adaptation, the
Figure 2: (a) Ground state absorption spectra of ASR in dark (AT) and light adapted (mixture of AT and 13C) conditions are shown by black and orange lines, respectively. The spectrum of pure 13C isomer (blue dotted line) was derived by taking linear combination of the dark and light adapted absorption spectra using known isomeric ratio. Normalized difference absorption (ΔA) spectra at pump-probe delay of 100 ps is shown by the magenta curve. Different characteristic bands: GSB (ground state bleach) and PIA (photo-induced absorption) are shown. Green and red (solid in (a) and line in (b)) curve represent the spectrum of the Actinic Pulse (AP) and degenerate pump/stokes/probe (DFWM) or push/probe (IVS) spectrum, respectively. (b) The pulse sequence used in pump-DFWM (top) and pump-IVS (bottom) experiments.
sample was illuminated for 1 hour with 500 mW from a LED source (Luxeon LXHL-PL01) centered at 590 nm. During the measurement of light adapted (LA) samples, the transparent sample reservoir was exposed to the same LED source to maintain LA photo-stationary state and it was covered with black paper during the measurement of DA. The GS absorption spectrum was measured before and after each set of time resolved measurements to ensure the isomeric ratio remains the same and also to check if any degradation of the sample happened during the span of a measurement (about 20 min).
Signal analysis
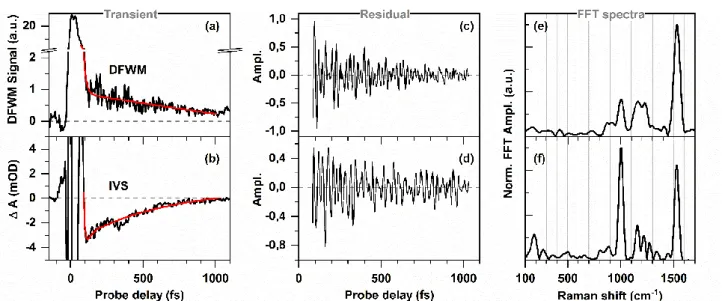
The non-oscillatory contributions in each of the DFWM and IVS transients were subtracted by a bi-exponential fitting (Fig. 3(a)-(b)). In each case, 1 ps of the transients was fitted, leaving out the initial 80 fs to avoid the coherent artefact. A typical algorithm66 was followed to convert the remaining
oscillatory signals (Fig. 3(c)-(d)) from time domain to the spectral domain (Fig. 3(e)-(f)). The residuals were multiplied by a Gaussian window and subsequently zero padding was done before performing a fast Fourier transformation (FFT).
The signal to noise ratio in (pump-) DFWM measurements was almost one order of magnitude better than that in (pump-) IVS measurements. For (pump-) DFWM measurements, each of transient was averaged 60 times whereas it was averaged 600 times for (pump-) IVS measurement to achieve a comparable S/N ratio. This difference in the S/N ratio is because the self-heterodyne IVS signal suffers from the fluctuation of intensity of the local oscillator probe whereas the DFWM signal, being a homodyne technique, is background free.
Figure 3 also shows the well-known effect of the homodyne detection in (pump)-DFWM on the decay of the oscillatory signal:65 Oscillatory contributions in the residual decay faster in
the DFWM signal compared to IVS signal. The intrinsic interference between population grating and vibrational
coherence results in a faster decay of the oscillation and consequently makes the FFT spectra broader (compare Fig. 3(e) and (f)). This also causes the small deviations in the spectral peak positions between DFWM and IVS FFT spectra (see e.g. Fig. 4), especially for those vibrational modes (e.g. 1100-1400 cm-1) which are very closely spaced.
Experimental results
Non-resonant DFWM/IVS experiments
DFWM and IVS experiments with almost non-resonant DFWM/IVS spectra (Fig. 2(a)) were carried out to capture the pure GS vibrational spectra. The FFT spectra obtained after the subtraction of non-oscillatory contributions from the transients, show the activity majorly in the high frequency region (>1000 cm-1) for both DFWM (Fig. 4(a)-(d)) and IVS (Fig. 4(e)-(h))
experiments. A weak activity in the low frequency region (<400 cm-1) was also observed, especially at the detection
wavelength at 630 nm, where the relative amplitudes of the high frequency (>1000 cm-1) modes are lowered. This variation
of relative intensity of the low and high frequency modes from the edge (590 nm) to the center (630 nm) detection wavelength of DFWM/IVS spectrum are in agreement with the natural spectral dependence of CARS-based schemes.68
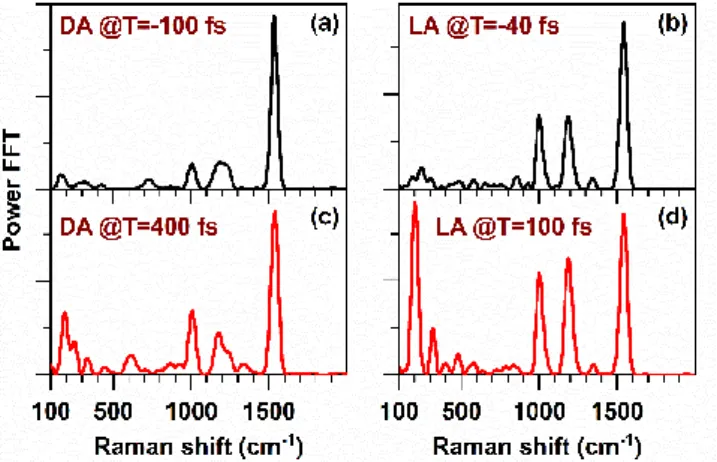
The comparison between the FFT spectra of DA and LA ASR shows mainly three characteristic features. Firstly, the modes which appear at 1003 and 1530 cm-1 in the DA DFWM FFT
spectrum (Fig. 4(a) and (c)) shift to 1007 and 1539 cm-1 (Fig. 4(b)
and (d)), respectively, for LA ASR. Secondly, the DFWM FFT spectrum of DA ASR shows two peaks around 1165 and 1230 cm-1, while for LA ASR they appear at 1180 and 1300 cm-1.
All these changes are also observed in IVS measurements (compare Fig. 4(e) and (g) to (f) and (h)). The modes around 1100-1400 cm-1 also show in IVS qualitatively similar contrasts
between DA and LA ASR as observed in DFWM. Three peaks at Figure 3: Transients obtained from (a) DFWM and (b) IVS measurements with the non-resonant DFWM/IVS excitation spectrum (i.e. in absence of actinic pulse) at detection wavelength 590 nm under dark adapted condition. The non-oscillatory signal was subtracted in each case by a bi-exponential fitting (red line) before FFT. The corresponding oscillatory signal, obtained after fitting DFWM and IVS transients, are shown in (c) and (d) respectively. Here, a Butterworth filter has been applied on the residuals to cut-off the low frequency component below 100 cm-1 in order to suppress noise. The corresponding FFT spectra obtained in DFWM and IVS experiments are shown in (e) and (f) respectively.
1161, 1215 and 1270 cm-1 for DA ASR (Fig. 4(e) and (g)) change
to 1175, 1220, 1270 and 1340 cm-1 under LA condition (Fig. 4(f)
and (h)). Finally, the modes appearing in the region of 750-950 cm-1 (grey shaded area in Fig. 4), in particular the mode
at about 806 (DFWM)/ 803 (IVS) cm-1, shows relatively stronger
amplitude for LA ASR than for DA ASR. This is a very important result which will be discussed later.
The observed GS fingerprint vibrational modes of RPSB have been already previously assigned.7, 44, 69-74 We hereby follow the
same assignment of the main spectral peaks to specific vibrational motions (Table 1). For example, the mode around 1000-1010 cm-1 is assigned to CH3 rock and that around
1530-1540 cm-1 is assigned to C=C stretching mode. The
multiple peaks in the region from 1100 to 1400 cm-1 are mostly
known as the signature of the stretching vibration of different C-C bonds present in RPSB, sometimes coupled with C-C-H
in-plane-rock modes. In addition, the low frequency modes (190, 300 cm-1) are usually assigned to the delocalized torsional
modes whereas the Raman activity in the region 750-950 cm-1
(grey shaded area in Fig. 4) is well known for the HOOP wags (Table 1). In addition, a non-resonant (λexc=785 nm)
spontaneous Raman measurement (Fig. 4(i)-(j)) was performed to further corroborate the vibrational spectra obtained from the time resolved experiments (DFWM and IVS). While the non-resonant Raman results match very well most of the frequencies and respective shifts observed with DFWM/IVS (Fig. 4(a)-(h)), there are three major contrasts: (i) Different frequencies for modes in the spectral region between 1100 and 1400 cm-1, (ii) Complete absence of low frequency modes
(<750 cm-1) in the non-resonant Raman measurements (which
were active in the DFWM/IVS measurements) and (iii) Different amplitude of the 803/805 cm-1 mode.
Figure 4: The FFT spectra obtained after subtraction of the non-oscillatory components from the transients of DFWM (a-d) and IVS (e-h) experiment probed at 590 nm (a, b, e, f) and 630 nm (c, d, g, h). The left and right column represent the FFT spectra of DA and LA ASR respectively. The spontaneous Raman spectra of DA and LA ASR have been shown on the bottom graphs i and j respectively. The grey shaded area (750-950 cm-1) represents the characteristic frequency region of the HOOP modes of RPSB.
Separation of Isomer Specific Contribution
While the spectral features observed for DA and LA ASR (Fig. 4) already mirror the different isomer concentrations, in the following a quantitative extraction of the pure AT and 13C spectra will be performed. In our previous report,75 we
successfully showed the separation of the GS isomer specific contributions for two individual high frequency modes (CH3 rock
and C=C stretch) by a single Gaussian fit. A Gaussian model was used instead of a Lorentzian model, since the former showed a better fitting quality. Here, we expand and present a more global approach (Fig. 5) to fit all the modes appear in the spectral region from 950-1600 cm-1 by a series of Gaussians:
𝐹𝐹𝑇𝐴𝑇 𝐺𝑆= ∑ 𝑎𝑖∗ 𝐺𝑖 𝑛
𝑖
(𝜈𝑖, 𝜔𝑖) (1)
where each Gaussian (𝐺𝑖) represents an individual vibrational
mode. The amplitude (𝑎𝑖), central frequency (𝜈𝑖) and width (𝜔𝑖)
of each Gaussian was varied in this multi-Gaussian fit (equation 1). Since DA ASR contains exclusively the AT isomer
(98%),46, 47 the multi-Gaussian fit (Fig. 5(a)) gives the parameters
(𝑎𝑖, 𝜈𝑖, 𝜔𝑖) for each of the vibrational modes of AT ASR. This
information (FFTAT GS) can be used to disentangle the pure
spectrum of 13C GS by a constrained fit:
𝐹𝐹𝑇𝐿𝐴 𝐺𝑆= ∑ 𝑎𝑗∗ 𝐺𝑗 𝑛
𝑗
(𝜈𝑗, 𝜔𝑗) + 𝑓 ∗ 𝐹𝐹𝑇 𝐴𝑇 𝐺𝑆 (2)
Here, the fitted spectra (𝐹𝐹𝑇 𝐴𝑇 𝐺𝑆) obtained from the previous
multi-Gaussian fit was kept constant and the parameters (𝑎𝑗, 𝜈𝑗,
𝜔𝑗) of a new set of Gaussians, which represent the modes of the
13C isomer, were varied to fit the LA non-resonant DFWM FFT spectrum (Fig. 5(b)). The factor f in equation (2) depends on the percentage (36%)46 of the AT isomer presented in the LA form.
Since the DFWM signal is directly proportional to the square of the sample concentration, f should be equal to the square of the fraction of AT isomer present in LA ASR: (0.36)2=0.13. The fitted
value obtained for the factor (f=0.14 ±0.02) matches this value
Dark adapted (98% AT) Light adapted (64% 13C; 36% AT)
Assignment of the modes
DFWM IVS Spon. Raman DFWM IVS Spon. Raman
200, 300, 520 190, 280 - 210, 350, 520 190, 280 - Delocalized torsion71, 74 900 803, 890 802, 890 810, 900 803, 890 802, 890 Hydrogen out of plane wag7, 44, 73 1003 1003 1002 1007 1007 1008 CH3 rock7, 69, 70, 73 1165, 1230 1161, 1215, 1270 1177, 1196, 1209, 1271 1180, 1300 1185, 1202, 1305, 1338 1175, 1220, 1275,
1340 C-C stretch + C-C-H in plane rock 7, 69, 70, 73
1530 1530 1530 1530 1539 1539 C=C stretch7, 69, 70, 73
Table 1: Comparison of the central frequencies (in cm-1) of the spectral peaks obtained from non-resonant DFWM, IVS and spontaneous Raman measurements. Assignment of the modes were done based on the literature.
Figure 5: Multi-Gaussian fit of (a) DA and (b) LA non-resonant DFWM FFT spectra probed at 590 nm. The series of Gaussians represented by green curves in each graph. Black line in (b) represent the spectra of AT isomer which is kept constant during this constrained fit.
Figure 6: The separated pure spectra of AT GS, 13C GS, KAT and K13 are represented by black, red, blue and orange line, respectively. The black dotted lines represent the central frequencies obtained for AT GS.
very well. The pure spectrum of the ground state of the 13C isomer is shown in Fig. 6.
The same approach can also be applied to obtain the spectrum of the K-photoproduct of each isomer (K13C and KAT,
see Fig. 1). In order to obtain the DFWM signal of these photoproducts, each isomer was directly excited by an actinic pulse spectrally resonant with the respective GS absorption. The DFWM spectrum was still spectrally resonant with the photo-induced absorption (PIA) band (see Fig. 2) but delayed at T=100 ps after the AP. This particular delay was chosen as the formation of the vibrationally thermalized K-photoproduct (Fig. 1) is known to take place within 100 ps.46, 47 The
pump-DFWM signal in this condition contains several contributions (Fig. 1). The signal of DA ASR after 100 ps, for example, contains contributions of the AT GS and of KAT, which
are reasonably easy to separate in pump-DFWM and less in pump-IVS due to noise (not shown). The pump-DFWM signal of the LA ASR, however, is much more challenging: At 100 ps delay, it contains the signal of the GS of both isomers, as well as from both photoproducts. In order to extract the K13C, the spectra of
AT, KAT and 13C must be used, which is inherently more
susceptible to noise. With this information in mind, the pure spectra of four different stereo-isomers (GSAT, GS13C, KAT and
K13C) appearing in the photo-cycle are depicted in Fig. 6 (see also
Fig. S5). Several differences in spectral signatures of these four species can be observed. For example, the C=C stretching mode of 13C GS (1541 cm-1) gets blue shifted compared to that of AT
GS (1530 cm-1). Also, isomerization at C13=C14 position causes
the C=C stretching mode to shift in the higher frequency from AT GS (1530 cm-1) to KAT (1538 cm-1), whereas it shifts to the
lower frequency from 13C GS (1541 cm-1) to its corresponding
sub-ns photo-product K13C (1524 cm-1). Similar trend is also
observed for the CH3 rock mode while for K13C, it gets blue
shifted compared to 13C GS. The frequencies and amplitudes of modes in the spectral region between 1100 and 1300 cm-1 are
very different for each isomer. Finally, it is important to note that the spectral peaks appearing in the region 1300-1450 cm-1,
which have been assigned to C-C-H in plane rock mode (Table 1), do not change from 13C GS (1305, 1427 cm-1) to K13C
(1307, 1427 cm-1), whereas a significant change is observed
from AT GS to KAT. A single weak peak at 1408 cm-1 appears for
AT GS whereas at least two strong peaks appear for KAT (1364,
1446 cm-1) in this region.
Pump-DFWM experiments in the sub-ps timescale
In order to follow the isomerization reaction of both 13C and AT isomers in the excited state, pump-DFWM measurements were
Figure 7: The evolution of pump-DFWM FFT spectra probed at 590 nm for (a) DA and (b) LA ASR with the actinic pulse delay. (c) The frequency shift of C=C stre tch (left) and CH3 rocking (right) mode for DA ASR with different actinic pulse delay. The black dotted lines represent the central frequencies obtained for AT GS (Fig. 6). The frequency shifts of the corresponding modes in LA ASR are shown in Fig. S6 of ESI.
performed by varying the actinic pulse delay (T) up to about 1 ps (Fig. 7). Fourier-transformed spectra for DA and LA are displayed in Fig. 7(a) and (b), respectively. In both situations, two common changes can be observed after the arrival of the actinic pulse (T>0): (i) amplification of the high frequency modes (>1000 cm-1) and (ii) appearance of the strong low frequency
modes (100-400 cm-1), in particular for LA ASR (Fig. 7(a)), which
were very weak in the GS (Fig. 4). Moreover, a closer look on the high frequency (>1000 cm-1) modes (Fig. 7(c) and Fig. S6) shows
a significant spectral shift with the actinic pulse delay. The major spectral shifts of DA and LA ASR happen within 800 and 200 fs, respectively, which match respective excited state lifetimes46, 47
of the AT (750 fs) and 13C (120 fs) isomers. The frequency evolution for each of the characteristic vibrational modes are described in detail in the following.
C=C stretching and CH3 rock mode: Figure 7 (c) depicts the evolution of C=C stretch and CH3 rock modes for DA ASR. Here,
a negative time delay means the actinic pulse comes after DFWM interaction which should basically give the GS vibrational spectra. Hence, the central frequencies of C=C stretch and CH3
rock modes at T=-100 fs, which appear at 1530 and 1002 cm-1,
match the GS frequencies displayed above (Fig. 4). At initial positive T-delays (until 200 fs), each of these modes shows a rapid blue shift and subsequently a slower red shift (see DA in Fig. 7(c) and Fig. S7(a) and (c)). Although the FFT spectra at T>0 contains the major contribution of the transient species being resonantly probed at the corresponding time, a minor contribution of GS coherence, due to the non-resonant Raman interaction, still contaminates the signal. As a consequence, pump-DFWM FFT spectra at any positive actinic pulse delay (T) is not the pure spectra of the transient species formed within the corresponding time (T) after the initiation of the reaction by AP. Since the pure GS spectra of AT isomer is already known (Fig. 5 and 6), it is possible to extract the pure spectra of the transient species present at different actinic pulse delays by the
aforementioned constrained multi-Gaussian fitting (Fig. 5 and Fig. S5).
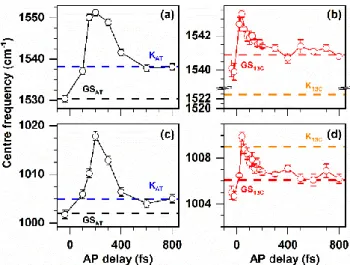
By applying this method, the frequency of C=C stretch and CH3 rock modes for AT is shown in Fig. 8 (a) and (c), respectively.
AT shows a clear strong blue shift of 21 and 18 cm-1 for the C=C
stretch and CH3 rock modes, respectively, at T=200 fs compared
to that of GS species (T<0). At longer delays (T>200 fs), it undergoes a red shift to 1538 and 1005 cm-1. These two latter
frequencies are the central frequencies of the C=C stretch and CH3 rocking modes, respectively, of previously extracted pure
KAT (Fig. 6). The separation of all contributions to the transient
LA ASR signal is more challenging than for DA ASR. Here, two ground state species are excited (AT and 13C), followed by two excited states and two photoproducts, which leads to much larger frequency uncertainties and ambiguous results. Therefore, the frequency shifts of the C=C stretch and CH3 rock
modes for the LA ASR are shown without extraction (Fig. 8(b) and (d), respectively). A similar trend is observed as for AT, i.e. an initial blue shift takes place followed by a red shift. However, the blue shift is much smaller and the whole dynamics is much faster in the LA than for AT (compare e.g. Fig. 8(a) to (b)). The maximum of the blue shift appears at much earlier actinic pulse delay (about T=40 fs) compared to AT form (about T=200 fs).
Fingerprint (1100-1400 cm-1) region: As observed for the GS spectra (Fig. 4, 6), the fingerprint region around 1100-1400 cm-1
(Fig. 9) shows a congested spectrum after the actinic excitation, particularly for AT ASR. The double peak feature (1165 and 1230 cm-1) before time zero merges to single major peak
Figure 8: The excited state evolution of C=C stretching (a, b) and CH3 rock modes (c, d) obtained for the pure AT isomer (a, c) and LA (b, d) form ASR. The central frequencies of pure GS (AT and 13C) and K-photo intermediates (KAT and K13C) are shown by black, red, blue and orange dotted lines respectively in each graph. Probe detection wavelength was 590 nm.
Figure 9: The evolution of finger print (1100-1400 cm-1) modes in the pump-DFWM FFT spectra for (a) AT and (b) LA ASR at different actinic pulse delay (T) probed at 590 nm. The vertical lines in (a) and (b) represent the corresponding central frequencies of AT and 13C GS, respectively.
(1193 cm-1) along with a minor peak (1330 cm-1) at T=100 fs for
AT ASR. Afterwards, the major peak shows a red shift till 200 fs which is followed by, a slow monotonous blue shift until the formation (200 to 800 fs) of the hot-intermediate, commonly known as J-species in literature. Subsequently, it undergoes a small red shift during vibrational relaxation on a much longer time scale (1 to 100 ps) to form the thermally relaxed photoproduct (KAT). This contrasts to the signal of LA ASR, where
the major peak at ~1181 cm-1 undergoes a blue shift initially
(T=40 fs) to 1187 cm-1 and does not shift afterwards within the
excited state lifetime (<120 fs) of the 13C isomer. It only shows a small (1187 to 1183 cm-1) red shift during the photoproduct
vibrational relaxation (~1 ps to 100 ps), similar to the AT isomer.
Low frequency (<400 cm-1) torsion and HOOP modes: As shown
in Fig. 4, the low frequency modes below 400 cm-1 are absent or
very weak in GS. However, a delayed activation of these low frequency modes (Fig. 7(a) and (b)) is observed after the excitation with the AP. This is in contrast to the activity of the high frequency modes, whose amplitude rises as soon as the AP arrives (Fig. S8). This contrasting activity of low frequency (<400 cm-1) modes is further evidenced in Fig. 10 at several
actinic pulse T-delays. A significant relative amplification of the low frequency modes (190, 300 cm-1), compared to the high
frequency (>1000 cm-1) modes, is observed at T>0 for DA and LA
ASR. Here it is important to note that LA ASR shows a much stronger low frequency activity than DA ASR.
The evolution of the amplitude of the low frequency modes is different from other modes. While high frequency modes (e.g. C=C stretch) show an instantaneous rise in the activity at very early actinic pulse T-delays, low frequency (e.g. 190 cm-1)
activity shows a delayed rise for LA ASR (Fig. 7). The FFT amplitude of the low frequency (190 cm-1) modes takes about
100 fs to reach the maxima whereas that of C=C stretching mode reaches the maxima within the experimental time resolution after the actinic excitation (T=20 fs). In addition, the exponential rise time (70 ±20 fs) of low frequency (190 cm-1)
modes matches the exponential decay time (60 ±40 fs) of C=C stretch mode (Fig. S8). Moreover, no significant evolution of
HOOP modes (800-1000 cm-1) is observed in our
measurements. This will be further discussed and investigated later.
Discussion
Ground state Raman activity
A strong Raman activity of the vibrational modes mainly in the high frequency (>1000 cm-1) region of the spectra has been
observed in non-resonant experiments (Fig. 4). The convolution of the GS absorption spectrum with the non-resonant DFWM/IVS excitation spectrum (Fig. 2), gives a FWHM of about 500 cm-1 and, therefore, there is a negligible induction
probability of a vibrational coherence above 500 cm-1 in the ES
potential surface. Hence, all modes with frequencies well over 500 cm-1 in these non-resonant measurements, including
HOOP, CH3-rock, C-C and C=C modes, are assigned to GS
manifold. This is further supported by the spontaneous Raman spectra (Fig. 4(i) and (j)), which show a good correlation with the FFT spectra obtained from time resolved experiments for frequencies well over 500 cm-1. However, the weak but
detectable Raman activity observed in the low frequency region (200 and 300 cm-1) in both DFWM and IVS signal, does not
appear in any spontaneous Raman spectra. If this low frequency activity originates from GS, it should definitely be visible in the spontaneous Raman measurements. Therefore, we assign all low frequency (<400 cm-1) activity detected with DFWM/IVS to
the excited state manifold. A detailed discussion about the origin and activation mechanism of these mode will be presented in next section.
The extraction of the pure GS spectra of AT and 13C isomer (Fig. 6) enables us to make a quantitative comparison. The central frequencies of C=C stretch and CH3 rock modes are
shifted about 11 cm-1 (1530 vs 1541 cm-1) and 4 cm-1 (1002 vs
1006 cm-1), respectively, between AT to 13C ASR. This is in good
agreement with reported values for ASR.46 A similar increase of
high frequency modes from all-trans to cis isomer has also been reported recently for chanello-rhodopsin58 and visual
rhodopsin,49 which further corroborates the separation of the
Sample CH3 rock [cm-1] C-C stretch + C-C-H in plane [cm-1] C=C stretch [cm-1] AT-RPSB in methanol52 1010 1160, 1205 1565 Bacteriorhodopsin (AT) 50 1008 1165, 1210 1530 Visual rhodopsin (AT)49 - 1167, 1322 1541 Visual rhodopsin (11-cis) 49 - 1173, 1275, 1313, 1363 1550 Chanello-rhodopsin (AT)58 1011 1161, 1208, 1281 1531 Chanello-rhodopsin (13-cis)58 1017 1157, 1196, 1301, 1369 1545 ASR (AT) This report 1002 1164, 1229 1530 ASR (13-cis) This report 1006 1094, 1180, 1305 1541 Figure 10: The relative amplification of low frequency modes probed at 590 nm
before (black, T<0) and after (red, T>0) the arrival of actinic pulse for DA (a, c) and LA (b, d) ASR.
Table 2: Comparison of the selected fingerprint vibrational modes for all-trans and
cis isomers found for ASR in this report and those reported for retinal protonated
Schiff base (RPSB) in solution and different proteins: bacteriorhodopsin, visual rhodopsin and chanello-rhodopsin.
pure spectra of ASR. Furthermore, the C-C stretch region shows multiple distinguishable peaks between AT and 13C ASR (Table 1). Two peaks around 1165 and 1230 cm-1, observed for
AT ASR (Fig. 6), are quite common for the retinal chromophores in AT conformation in other proteins (Table 2). On the other hand, the appearance of a distinguishable mode above 1300 cm-1 for 13C ASR is a general marker of cis form (Table 2).49, 58 In addition, the C-C stretch mode which appears at 1180 cm-1
in case of 13C ASR, has been attributed as an indicator for the formation of 13C-isomer of BR.76
The activity of HOOP modes (800-1000 cm-1) in GS (grey
shaded region in Fig. 4) has been interpreted as an indirect indicator of a distorted non-planar structure of RPSB.71, 77 The
relative amplitude of the HOOP modes, particularly at about 805 cm-1, is higher in LA (major component is 13C) ASR
compared to DA (98% AT) ASR. This observation is consistent in each (DA vs LA) of the spectra measured by three different spectroscopic techniques (DFWM, IVS and spontaneous Raman). All these together, hints at the presence of a non-planar structure for the 13C isomer, although it is much less distorted than the 11-cis isomer in visual rhodopsin. 44, 69, 71, 77 A
detailed assignment of H-wag modes is, however, necessary in order to specify the region of distortion in the long retinal chain. The complete assignment of H-wag modes for ASR has not been reported yet but it is well known for BR from the resonant Raman study by Smith et al.70 In that report, a mode at 800 cm-1
was assigned to C14-H out-of-plane wag and showed strong
amplitude for 13C isomer whereas it almost disappears for AT isomer, similar to ASR isomers in our study. Later, solid state NMR data78, 79 indicated a difference in the structural rigidity
along the C13=C14-C15 moiety between AT and 13C isomers
inside the retinal pocket of BR. Following the same line, our observation can be interpreted as both isomers are pre-twisted around or close to C13=C14 bond of retinal chromophore but 13C
isomer is significantly more distorted than AT.
The exact position of this distortion and the differences between the two isomers can be further numerically investigated by applying a classical (harmonic) atomistic force field and performing molecular dynamics simulations of ASR embedded in a membrane model (see ESI). The geometry of AT and 13C GS inside the retinal pocket shows that both isomers are equally distorted around the C13=C14 bond, i.e. the dihedral
angle of C12-C13-C14-C15 is found to be +191.6° and 11.7° (Table
S1) for AT and 13C isomer, respectively. This is in good agreement with the value (~13°) previously reported by QM/MM geometry optimization calculations.31 These new
calculations, however, shows that the isomers significantly differ around the neighboring C14-C15 bond (dihedral C13-C14-C15
-N): While AT is nearly planar (177.1°) around the C14-C15 bond,
the 13C is almost 10° twisted (189.5°). This relatively larger pre-twist around C14-C15 bond for 13C isomer corroborates very well
the experimental observation of higher amplitude of C14-H wag
as discussed above in the previous paragraph.
Finally, a brief comparison of vibrational signatures of GS isomer with its corresponding K-photoproducts (Fig. 6) helps to further rationalize the frequency shifts in terms of conformational differences. The conformational changes alter
the delocalization of δ and π-electron density for the macro-molecule like RPSB, which explains the frequency shift of CH3
rock, C-C and C=C stretch and C-C-H in-plane rock modes. The changes in the frequency and amplitude of C-C-H in-plane rock (1300-1400 cm-1) modes (Fig. 6) are important as these are
reported to be affected by the torsion around the active C=C bond.62 Although the frequency of this mode changes from AT
GS (1408 cm-1) to KAT (1364, 1446 cm-1), it remains almost the
same for 13C GS (1305, 1427 cm-1) and for K13C (1307, 1427 cm -1), indicating a very similar strain around the C13=C14 bond for
the latter two isomers. These results also corroborate FTIR results which illustrated that isomerization causes larger rotation around the active C13=C14 bond in the AT compared to the 13C isomer.73
Excited state evolution of high frequency modes (1000 cm-1) The pump-DFWM measurements captured the sub-ps frequency shifts of high frequency modes. In general, the C=C stretch and CH3 rock modes showed a blue shift and subsequent
red shift for both AT and LA (major 13C) ASR. Since the DFWM spectra, used for this measurement, covers the region (580-720 nm) where both excited state absorption and stimulated emission of ASR overlaps,46, 47 there are two possible
origins for the observed frequency shifts: (i) the excited state evolution of the nuclear wave packet or (ii) the vibrational relaxation of the GS wave packet, generated by stimulated emission pumping (SEP) process.24, 38, 66 For the latter, we would
expect a red shift just after the excitation for an anharmonic ground state potential.24 This is because the GS wave packet,
generated via SEP, in the higher lying vibrational states is lower in frequency than a relaxed GS wave packet, generated via non-resonant ISRS in the lower lying vibrational states. On the contrary, we observed a blue shift compared to the GS. This excludes this possibility and hence, the frequency shift is interpreted as coming mostly due to the excited state wave packet motion. In addition, the time scale of the frequency shifts is significantly different for AT and 13C isomers. It matches very well the excited state lifetime of each isomer, which further indicates that the observed frequency shifts originate due to the transient evolution of the ES species.
Sub-ps transient frequency shifts in the fingerprint region have been frequently interpreted as the conformational
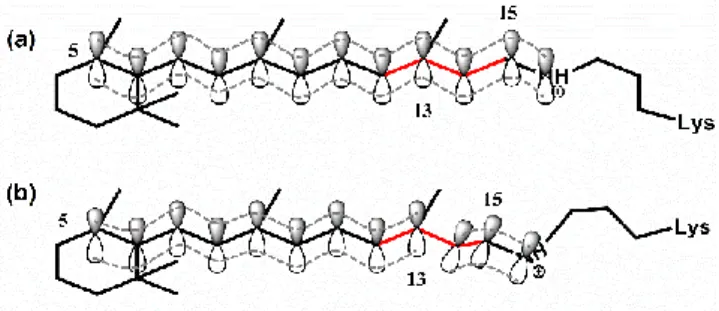
Figure 11: The reduction of the effective π-conjugation length from (a) Franck-Condon excited state to (b) twisted transition state (far Franck-Franck-Condon region). In (a), there is an extended π-conjugation from C5-atom to N-atom of the Schiff base which is reduced in (b).
changes associated with the isomerization process.62, 63 Here,
the blue shift of C=C stretch (Fig. 8) is interpreted as the reduction in conjugation length due to the rotation around the C13=C14 bond during the isomerization. After the excitation by
the actinic pulse, the RPSB is promoted to the Franck-Condon point of the excited state where it is still in the same geometry as it is in ground state (Fig. 11(a)). In this geometry, an extended π-conjugation is present along the retinal chain by the pz-orbitals from C5 up to protonated Schiff base N atom. As the
isomerization reaction progresses, the RPSB starts to adopt a more non-planar twisted structure (Fig. 11(b)) towards the photoproduct geometry. During this evolution, the C14-C15-N
π-conjugated moiety becomes almost perpendicular to the remaining π-conjugated system (C5 to C13) at the 90° twisted
form (AT*) and the conjugation between two moieties, mentioned before, gets completely disrupted. Hence, the effective conjugation length gets reduced during evolution from the FC towards the 90° twisted form. It is well known for linear conjugated polyenes that the reduction of effective conjugation length causes a frequency blue shift of the C=C stretch mode.80, 81 Thus, decrease in the effective conjugation length explains
the blue shift of C=C stretching mode observed here for retinal in ASR. The blue shift of CH3 rock mode can also be interpreted
in a similar way. The disruption of the C13=C14 bond during
isomerization reduces the partial positive charge over the C13
atom induced by the positively charged Schiff base N-atom. The partial positive charge over C13 tends to pull the electron density
from the CH3 moiety (bonded to C13) towards it but the lack of
inductive effect in the twisted state pushes the electron density towards the CH3 moiety. This possibly causes the blue shift of
the rock mode of CH3. This also corroborates the picture of
change in electron density during the isomerization of BR, recently captured by the transient femtosecond X-ray spectroscopy.29 Thus, following our argument, the slower
frequency shift observed for AT isomer (Fig. 8(a)) compared to 13C isomer (~LA, Fig. 8(b)) can be interpreted as it takes longer
for the AT isomer to rotate around the C13=C14 bond to form the
90° twisted state compared to 13C. This corroborates as well QM/MM calculations31 which predict a barrier in the excited
trajectory of AT and, therefore, a slower formation of the respective twisted transition state. Furthermore, the subsequent slow red shift for both isomers is a signature of increase in -conjugation as the RPSB structurally changes from the 90° twisted species to the relatively more planar initial GS or photoproduct.
The frequency shift of the fingerprint modes in the region from 1100-1400 cm-1 are relatively more complicated than the
one observed for the C=C stretching mode. This is because different C-C stretching modes (C8-C9, C10-C11, C12-C13 etc.) of
retinal exhibit distinct closely spaced peaks which overlap in that region. In addition, C-C-H in-plane rock modes are also sometimes coupled with the C-C stretch which makes the spectral evolution of this finger print modes even more challenging to rationalize. However, the most intense peak below 1200 cm-1, which is known to be mostly uncoupled from
C-C-H rock modes, follows a trend which can also be accounted for the change in the effective π-conjugation length. It has been also observed for linear conjugated polyenes80, 81 that the small
reduction in effective conjugation length causes a blue shift of the mode below 1200 cm-1 but further reduction of effective
conjugation length eventually results in red shift. This matches very well the frequency shift of AT ASR (Fig. 9), where it first undergoes an initial blue shift until 100 fs and subsequently red shifts until 200 fs. This is the delay which has been interpreted above as the time to reach the 90° twisted state for AT ASR. Afterwards, the effective conjugation length is expected to increase again due to the slow formation of relatively planar KAT.
Thus, it causes a blue shift of the finger print mode. This effect is much weaker for 13C (~LA) isomer which results in no observable shift. This once again hints at a smaller rotation around C13=C14 in 13C isomer compared to AT isomer in ASR.
Figure 12: DFWM FFT spectra obtained by using near-resonant (1) and resonant (2) excitation spectra for DA (black) and LA (grey) ASR detected at different probing wavelengths shown by vertical grey line in (a) and (b).
In the context of frequency-shift for the excited state modes it is also important to note that the experimental time resolution cannot resolve the very fast red-shift taking place as a result of the BLA. This red-shift must take place according to numerical calculations in time-scales around 20 fs.32 The fact
that an initial blue-shift is observed in all measurements at delays where BLA is temporally overlapping, possibly means that the pure blue-shift is potentially much bigger than the observed one.
Excited state evolution of low frequency (<400 cm-1) and HOOP
modes
A central result of pump-DFWM measurements was the observation regarding strong activity of the low frequency modes around 190 and 300 cm-1 at positive actinic pulse delay
which are absent in the GS (T<0). Very similar low frequency peaks (160, 210 and 300 cm-1) have also been observed
previously for ASR in the transient absorption experiments57 by
probing in the near infrared region (950-1450 nm) which is far away from the ground state absorption and only covered by the stimulated emission. Furthermore, few strong Raman modes below 400 cm-1 have been observed in the excited state of RPSB
in solution52 by Kraack et al. and also observed more recently
for rhodopsin28 and Chanello-rhodopsin58 by Schnedermann et al. Moreover, most important, the low frequency modes (e.g.
~190 cm-1) in the pump-DFWM transients show faster
dephasing than high frequency modes (e.g. C=C stretch) (Fig. S10). All these observations together clearly suggest that the low frequency Raman activities are originated from the ES manifold.
Another central result is the lack of HOOP activity in the excited state in our pump-DFWM (and pump-IVS) measurements which is surprising. There are two plausible explanations for this observation. The surrounding protein environment in ASR, which is different compared to rhodopsin and BR, where the HOOP activity is stronger,23, 28 can
significantly reduce the Raman transition probability of a specific mode by modifying the retinal pocket. Secondly, the activity of the HOOP mode of BR has been observed to be strongly dependent on the center wavelength of DFWM spectra, used to create the vibrational coherence.50 The Raman
activity of this mode was found to be mainly enhanced for blue detuned excitation. In contrast, DFWM excitation spectra in our study, were red detuned compared to the ground state absorption (Fig. 2).
To clarify the lack of HOOP activity as well as to find out the activation mechanism of the low frequency (<400 cm-1) excited
state modes, we carried out two additional set of DFWM measurements with two different excitation spectra (Fig. 12). Spectrum 1 is the same as used before (Fig. 2) which is almost non-resonant to GS absorption and hence, only capable of exciting GS modes and also possibly the ES modes below 500 cm-1 due to small overlap with GS. Spectrum 2, however, being
completely resonant to the GS absorption, can directly excite all GS as well as ES vibrational modes. Two major changes (Fig. 12) were observed for both DA and LA ASR by tuning the DFWM
spectrum, namely (i) amplification of low-frequency and HOOP modes and the (ii) frequency-shift of high-frequency modes.
(i) Relative amplification of low frequency (<400 cm-1) and
HOOP modes: The FFT spectra for non-resonant spectrum
(Fig. 12(a)), detected at 590 and 630 nm, show the activity mostly above 1000 cm-1 along with a few weak low frequency
modes (~190, 300 and 510 cm-1), as observed before (Fig. 4). In
contrast, a strong relative amplification of the FFT amplitude of low frequency modes (<400 cm-1) with respect to high
frequency modes (>1000 cm-1), was observed for the FFT
spectra in the resonant DFWM experiment (Fig. 12(b)) compared to the non-resonant DFWM measurement (Fig. 12(a)). On the one hand, these low frequency (<400 cm-1)
modes have been observed to be completely absent in the non-resonant steady state Raman spectrum (Fig. 4(i)-(j)) and therefore, these modes have been attributed to ES manifold. This assignment nicely matches the weak Raman activity of these low frequency modes in the non-resonant DFWM/IVS FFT spectrum (Fig. 12(a)). On the other hand, the same set of low frequency (<400 cm-1) modes is relatively enhanced in resonant
DFWM measurements, in comparison to the high frequency (>1000 cm-1) vibrational modes. One obvious explanation for
this observation would be that the low frequency modes are much more Franck-Condon active than the high-frequency modes. However, an alternative interpretation can also be drawn if one considers different activation mechanisms for the high and low frequency modes as it was reported in theoretical studies on retinal chromophore model30 as well as experimental
studies for BR50 and RPSB in solution.52, 53 In these studies, the
high frequency (>1000 cm-1) modes were reported to be
Frank-Condon active, whereas the low frequency (<400 cm-1)
torsional modes were considered to be impulsively excited by the high frequency modes via internal vibrational energy redistribution (IVR). This is further supported by our observation of the delayed rise of low frequency amplitude compared to the high frequency modes in transient pump-DFWM spectra (Fig. S8).
The second question remain about the reason behind the passiveness of the HOOP mode Raman activity in our pump-DFWM experiments. pump-DFWM experiments with two different spectra (Fig. 12) show that the mode at 805 cm-1, previously
assigned as HOOP mode, shows a significantly strong amplitude in resonant DFWM experiment (Fig. 12(a)) which was very weak in the GS (Fig. 12(b)). This shows that the HOOP modes are induced only when it is probed with blue-detuned DFWM spectra not with red-detuned DFWM spectrum, used in our pump-DFWM experiment. This observation is very similar to BR50 and thus seems to be an intrinsic molecular property of
retinal.
(ii) Frequency shift of the high frequency (>1000 cm-1) modes: The high frequency mode e.g. C=C stretch (1530 cm-1 for DA and
1540 cm-1 for LA) in non-resonant DFWM FFT spectrum
(Fig. 12(a)) gets blue shifted in resonant DFWM FFT spectrum (Fig. 12(b)) (1538 cm-1 for DA and 1543 cm-1 for LA). A similar
to 1008 cm-1 for DA while 1007 shifts to 1010 cm-1 for LA. This is
expected since non-resonant DFWM FFT spectra contain only GS modes whereas resonant DFWM FFT spectra contain the mixture of GS and ES modes in the high frequency region. As we have shown above, both C=C stretch and CH3 rock modes show
a frequency blue shift in the ES compared to the GS (Fig. 8).
Pre-twisting and isomerization dynamics
In the context of retinal photo-chemistry, pre-twisting has been claimed to be one of the potential elements that can accelerate the isomerization process. In particular, the pre-straining inside the protein pocket has been repeatedly shown for visual rhodopsin by both X-Ray crystallography,9 NMR,40 resonant
Raman studies44, 69, 71, 77 and theoretical simulations42, 82 which
accounts for its fast ballistic IC dynamics. Although non-resonant Raman spectra (Fig. 4), as reported in this study, speak for a relatively more pre-twisted geometry of 13C isomer in ASR, no significant difference in distortion around the C13=C14
between AT and 13C isomers has been pointed out by the X-ray crystallographic study of ASR with 2.0 Å resolution.83 Very
similar observations were made for BR where the 13C isomer shows 3 times faster kinetics84 compared to AT but the
structural data report both the isomers to be nearly planar without any indication of protein-catalyzed strain like visual rhodopsin. However, an indirect evidence of weak pre-straining for 13C isomer was found in the NMR78 and resonance Raman70
studies of BR although it seems to be negligible compared to 11-cis isomer of visual rhodopsin. More recently, a closer inspection on the X-ray data depicted a twist around C14-C15
bond in 13C isomer but not in AT isomer of BR.10 Similarly our
classical GS dynamics simulation (Table S1) shows no difference in the distortion around C13=C14 bond for the AT and 13C
isomers; rather it indicates the presence of a twist (~10°) around C14-C15 bond for 13C isomer whereas for AT isomer appears to
be almost planar. Thus, this twist around the C14-C15 bond,
which is adjacent to active C13=C14, may play a central role in the
faster dynamics of 13C in ASR as claimed for 11C in visual rhodopsin. 85
This difference in distortions must originate from differences in the packing of the RPSB inside the retinal pocket. It fits the observation of faster dephasing (Fig. S9) of GS coherence of AT than 13C isomer which can be interpreted as stronger coupling of AT isomer to the surrounding than 13C. A recent femtosecond X-ray study29 of BR has depicted the
importance of the specific electrostatic interactions between protein and RPSB to guide the isomerization in certain direction. Hence, this difference in electrostatic interaction between AT and 13C isomers with the protein surrounding may lead to different trajectories during the reaction. It corroborates a FTIR study72 which showed that the sub-ps isomerization causes a
stronger disruption of the H-bond between the surrounding water molecule and the protonated N-atom of the Schiff base in case of the AT isomer compared to 13C. This H-bond has been previously46 suspected to be responsible for hindering the
rotation of the protonated Schiff base and thus slowing down the isomerization around C13=C14 bond. This also matches our
observations for AT ASR of a slower frequency shift of fingerprint modes (C=C and C-C stretches, CH3 rock) which are
sensitive to localized structural changes and have been interpreted as the delayed formation of the twisted transition state for AT compared to 13C isomer.
Conclusion
This work has investigated the mechanistic origin of the huge dynamical differences observed in the isomerization of AT and 13C isomers in Anabaena Sensory Rhodopsin. In this regard, the evolution of the GS as well as of the ES structural changes of each isomer has been followed by applying DFWM, IVS, pump-DFWM and pump-IVS spectroscopy techniques. The present experiments were able to unveil three major structural and dynamical differences in the isomerization of each isomer: (i) HOOP activity in the GS is stronger for the 13C ASR than for AT ASR, (ii) large (up to 20 cm-1) and delayed transient frequency
blue shifts observed for the C=C stretching and CH3 rock modes
in the excited state of AT ASR and (iii) delayed Raman activity increase of low frequency modes (< 400 cm-1).
These experimental findings depict very different isomerization scenarios for each isomer. The stronger HOOP activity at about 805 cm-1 in the GS spectra of LA ASR indicates
that 13C isomer is already more pre-twisted in the GS than the AT ASR isomer inside the retinal pocket. Bearing analogy to BR and supported by theoretical calculations, we have assigned this mode to C14-H wag. Our results point to a distortion located
around the C14-C15 bond of the 13C isomer, which is neighboring
to the isomerizing C13=C14 bond. The evolution of frequency
shifts of high frequency modes, in particular of the C=C stretching and CH3 rock modes, depicts a much slower
formation of the twisted configuration for AT ASR compared to 13C ASR. Finally, the delayed rise of amplitude in the transient nonlinear Raman spectra as well as the stronger relative amplification of the low frequency modes from non-resonant to resonant DFWM experiments indicates that these modes are potentially activated by the C=C bond via IVR mechanism similarly to previous observations in BR.50
These discoveries have profound implications in understanding the mechanism of the primary events in retinal proteins. 13C ASR and AT ASR show several dynamic and spectral features known for other respective isomers in other retinal proteins, in particular BR. Perhaps a major point is the very distinct evolution of high frequency modes in the excited states of 13C and AT ASR. While e.g. C=C stretching and CH3
modes are not reactive coordinates per se, they certainly reflect the structural changes taking place at localized positions along the retinal during the isomerization. The delayed decrease of the conjugated double bond length observed for AT ASR in the excited state compared to 13C ASR surely follows the previous proposal about the presence of barrier in the excited state manifold of AT ASR. Nevertheless, our findings suggest that the longer dynamics observed for AT ASR may originate due to more than one factor, namely a barrier in the excited state and the lack of a pre-distortion (compared to 13C) in the ground state. And finally, although the HOOP Raman activity in 13C ASR is