HAL Id: tel-02277567
https://tel.archives-ouvertes.fr/tel-02277567
Submitted on 3 Sep 2019
HAL is a multi-disciplinary open access archive for the deposit and dissemination of sci-entific research documents, whether they are pub-lished or not. The documents may come from teaching and research institutions in France or abroad, or from public or private research centers.
L’archive ouverte pluridisciplinaire HAL, est destinée au dépôt et à la diffusion de documents scientifiques de niveau recherche, publiés ou non, émanant des établissements d’enseignement et de recherche français ou étrangers, des laboratoires publics ou privés.
Anabaena Sensory Rhodopsin : effect of mutations on
the ultrafast photo-isomerization dynamics
Damianos Agathangelou
To cite this version:
Damianos Agathangelou. Anabaena Sensory Rhodopsin : effect of mutations on the ultrafast photo-isomerization dynamics. Theoretical and/or physical chemistry. Université de Strasbourg, 2019. English. �NNT : 2019STRAE001�. �tel-02277567�
ÉCOLE DOCTORALE PHYSIQUE ET CHEMIE-PHYSIQUE
Institut de Physique et Chimie des Matériaux de Strasbourg
THÈSE
présentée par :Damianos Agathangelou
soutenue le: 14 Janvier 2019
pour obtenir le grade de : Docteur de l’Université de Strasbourg Discipline/ Spécialité: Chimie Physique
Anabaena Sensory Rhodopsin :
Effect of mutations on the ultrafast
photo-isomerization dynamics
DIRECTEUR DE THÈSE:
Dr. Stefan Haacke Professeur, Université de Strasbourg
RAPPORTEURS :
Dr. Rolf Diller Professeur, University of Kaiserslautern
Dr. Steve Meech Professeur, University of East Anglia
EXAMINATEURS :
Dr. Vincent Robert Professeur, Université de Strasbourg
Dr. Tatiana Domratcheva Professeur associé, Max-Planck Heidelberg
UNIVERSITÉ DE STRASBOURG
Contents
I. General introduction – Thesis content 2
II. Experimental Techniques and Data treatment
2.1.1. Non-linear optics 6
2.1.2. Sum Frequency Generation (SFG) 6
2.1.3. Second Harmonic Generation (SHG) 7
2.1.4. White light Generation (WLG) 7
2.1.5 Optical Parametric Amplification (OPA) 8
2.1.6 Pulse Shaper - 4f line 10
2.2.1 Transient absorption spectroscopy (TAS) 12
2.2.2 Pump-Probe setup 14
2.2.3 Balanced detection - Sensitivity 15
2.2.4 Artefacts in TAS 16
2.2.5 Data processing 18
2.2.6 Data Analysis for TAS 19
2.2.7 Data filtering and Global analysis 20
2.3.1 Two-Dimensional Electronic Spectroscopy (2DES) 21
2.3.2 2DES signals 23
2.3.3 2DES setup using TWINS 28
2.3.4 TWINS operation 30
2.3.5 TWINS advantages and characteristics 33
2.3.6 Calibration – Data phasing 36
2.3.7 2DES Data filtering 40
2.4.1 Two dimensional Spectral Shearing Interferometry (2DSI) 42
2.4.2 2DSI setup 43
2.4.4 2DSI data treatment 46
2.5 Summary 50
III. Ultrafast photo-isomerization of retinal proteins : ASR
3.1 Ultrafast photo-isomerization in Retinal Proteins 55
3.2 Isomerization Reaction Scheme – Conical Intersection 57
3.3 Anabaena Sensory Rhodopsin (ASR) - Motivation 59
3.4 Photochromism of ASR 60
3.5 Disentaglement of AT & 13C ground and excited state signatures 61
3.6 Photochemistry of WT-ASR 62
3.7 Excited state lifetime of AT-PSBR and 13C-PSBR in WT-ASR 68
3.8 Isomerized species formation 70
3.9 Quantum yield of isomerization 71
3.10 Vibrational coherences in WT-ASR 74
3.11 Summary 78
IV. ASR Mutants
4.1 Point mutations on RP’s environment - Motivation 85
4.2 Steady state information of ASR mutants 85
4.3 Determination of AT-PSBR ESL of ASR mutants 89
4.4 Tuning of isomerization reaction according to S1/S2 electronic mixing 91
4.5 Determination of 13C-PSBR ESL of ASR mutants 93
4.6 UV-Vis TAS data of DA mutants 96
4.7 Vibrational coherences in mutated proteins 98
4.8 Isomerization reaction time 101
4.9 Summary 103
V. Fluorescence enhancement in ASR mutants
VI. Conclusions - Perspectives
6.1 Conclusions 137
6.2 Perspectives 138
Annexes A) Anabaena Sensory Rhodopsin
I. High Performance Liquid Chromatography (HPLC) - Calibration 141
II. Protocol for extraction of retinal oximes from the protein 142
III. T.A data for DA, OA and 13C-PSBR of WT-ASR 143
IV. Determination of ESL by SE Global fit (AT-PSBR) 144
V. Isomerization QY determination for DA WT 146
B) ASR Mutants
I. GS absorption spectra of AT- and 13-PSBR 147
II. HPLC measurements on ASR mutants 149
III. Mutations using WT-ASR crystallographic structure 150
IV. Fits for AT- and 13C-PSBR for ASR mutants 151
V. Vibrational coherences in ASR mutants 152
VI. UV-Vis TAS of ASR mutants 153
C) Table of Abbreviations D) List of publications
Acknowledgments
Initially, I would like to say thanks to my PhD supervisor Prof. Stefan Haacke for giving me the opportunity to work in the Biodyn group. During the last three and a half years I earned a lot of things by his side,he taught me how to do serious research, understanding deeply the topics we are working on and also how to be autonomous.
In addition I would like to express my thanks to our collaborators involved in the project. These are: Massimo Olivucci, Maria Del Carmen Marín, Yoelvis Orozco-Gonzalez, Nicolas Ferré, Elisa Pieri, K-H Jung, Hideki Kandori, Yoshitaka Kato, Rei Abe Yoshizumi, Tiago Buckup, Partha Pratim Roy and Giulio Cerullo. It was a joy to work with you and I believe we had a nice and fruitful collaboration.
At this point I will refer to each of the Biodyn members and thank them for everything they have taught me and shared with me along the time we spent together. I really appreciate and respect them as persons and researchers and I am willing to keep our close friendship relation even after leaving from Strasbourg.
I start with Mr. Olivier Crégut whom I consider as my Lab father. Since the day I arrived in IPCMS on March 5th 2015 he was there for me every single day spending hours and hours on explaining and teaching me everything about optics and lasers. Every time he was entering the door and I mentioned “Mr Olivier we have a problem” he always had a smile and was ready to help me without hesitating. Whenever I asked him if he thinks we have everything working fine, his response was “I would say it’s not bad”, which is the definition of the word “perfect” in my dictionary.
I continue with Johanna Brazard with whome I have spent the last two and a half years since her arrival in July 2016. Johanna was the person who removed all the stress from me and we worked together mainly on developing the 2DES setup and HPLC. I will never forget our visit in Milan in March 2017. Johanna am really sorry for stabing you with the needles and for skipping lunch the first day. Rumours say that until today there is some of our protein spilled on the optical table. Whenever I will face some problems I will always bring in mind the expression “Lets wish for the best”.
Anastasia “τρέλλα μου” we were together for three years in the same team working in different rooms but we could always find some time to make fun and laugh with the people around us during coffee brakes. I will always have in mind how calm and silent you were when somebody was trying to offend your work. Obviously am joking, and I promise to keep our greek temperament wherever I go; it’s our signature.
Youssef “my post-doc”. You were taking care of me the first one and a half year despite your own work. You taught me how to avoid being anxious and control my stress; believe me I don’t feel anything now. I really take seriously your advices and I hope we will work together in the future.
Dr. Li Liu you know how much I appreciate you. I remember our arguing time during my Erasmus visit. The next years we became very close friends and you taught me a lot of things including noodles. Even when I was sick you were passing by my house to leave me some drugs (it sounded a bit weird) and even cook for me. I will never forget our visits at the Chinese restaurant with the hot-pot and off-course the chocolate treasures you had hidden in the office.
Edo “pucci” thank you very much for getting me addicted to smoking again, it’s great to have good Mediterranean friends who want their friends to gain health problems. Every day you were reminding me how important it is to bother working people while laughing and how to say “no” to everybody. Maybe sometimes we were a nightmare for people around (I don’t mention names) but I think everybody needs an Edo for changing their daily routine. Thank you very much for answering all my questions in chemistry, spending several hours explaining me stuff (remember the Feynman diagrams).
Thomas you were the first person who showed me how an up-conversion setup works and I was calling you “boss”. I will never forget our first meeting with Stefan, where you were supporting me and encouraging me to start the presentation. Thank you also for being very annoying in the office while listening your rock-death-metal music; I enjoyed it. As a scientist, you are always un-pleased with the results and you want everything to work perfectly. Thus, I take you as an example.
Moussa, it’s been already two years since you left but I don’t forget you. Thank you very much for sharing your pump probe setup with me and for teaching me how to work efficiently only until 18h00 (this never happened for me). I won’t forget you presence in the lab singing Celine Dion while doing the laser alignment. Off course the best moments were when you were accidentally hitting your head on the metallic supports above the optical table.
Vincent Kemlin the hardcore post-doc. Thank you very much for the “grilling” during group meeting presentations. I found it very useful for me and I admit this was one of the factors helping to improve myself. The interaction with you helped me to get more inside the topics of 2DES and lasers. I will always remember our “random example”.
Robin Pierron, your arrival in the group last March gave me another good friend. We didn’t interact so much but you gave me good vibes when performing experiments and writing. From now on I will speak with you only in American.
Finally, I would like to thank Jérémie Leonard for all the useful discussions we had. As a group leader, you were asking the right questions and making the comments directly to the point solving in this way many of our problems. I keep in mind one incidence when I was forced to lie to you in order to bring you in the lab and make you a birthday surprise. Your response “I trusted you and you lied to me” will prevent me for doing the same in the future; maybe not.
In addition I want to thank all my friends in Strasbourg and Cyprus with which we had a great time outside of the institute. Those were Despoina, Eva, Vasiliki, Anna, Nataly and Paolo from Strasbourg and Giorgos, Constantinos, Andreas, Evanthia, Tasos from Cyprus. I would like to put my friend Arthur in honorable mentions for the good time we had in Strasbourg inside and outside of the institute. Thanks a lot for all the advices mainly concerning food and gym.
I kept last my family which are the people I owe everything in my life. These are my mother Maria, my father Giannakis, my brothers Andreas and Eirineos and my cousins Tasos, Andri and Nikos. I know they have hard time due to my absence during the last 10 years I have been studying abroad. For this reason this thesis is dedicated to them. In addition to my family I include my best friend and “brother” Evros who was the one getting me in the research direction. We had a dream together to become experimental physicists one day, since we were studying in Greece and we are on a good way to achieve it now. Finally, I would also like to thank Rene for all the support during the first two years of my PhD.
i
ii
Introduction
Notre domaine de recherche porte sur l'étude photophysique des protéines rétiniennes et en particulier des Rhodopsines Sensorielles. Ce sont des systèmes photosensibles qui, lors de l'absorption de la lumière, subissent un changement de conformation appelé isomérisation. Ce dernier processus est ultrarapide (<10-12s) et se déroule sur le chromophore rétinien de la protéine. Grâce au mécanisme d’isomérisation, l’énergie du photon absorbé est convertie en énergie chimique et est utilisée par le système pour l’exécution d’une fonction biologique spécifique. Nos études se concentrent sur cette étape initiale de la réaction chimique où nous voulons déterminer la vitesse et l’efficacité de ce processus, et comment celles-ci sont influencées par l’environnement protéique. C’est un principe très général qui s’applique à de nombreux photocapteurs biologiques (PYP, GFP, etc.) et fait encore l’objet de débats.
Outre notre intérêt pour les protéines rétiniennes, une partie de nos travaux est consacrée au développement de nouveaux outils spectroscopiques. Dans ce contexte, une installation de spectroscopie électronique bidimensionnelle femtoseconde est développée, qui utilise une paire d'impulsions à phase bloquée de moins de 10fs à 400 nm pour l'excitation. Le but de développer ce spectromètre est d'étudier l'hétérogénéité structurelle présente dans des systèmes similaires aux protéines rétiniennes en prenant l'avantage de résoudre le processus d'excitation de manière spectrale.
Anabaena Sensory Rhodopsin - Effet des mutations sur la dynamique de photo-isomérisation ultra-rapide
Le meilleur exemple connu de protéine rétinienne dans la nature est la rhodopsine (Rh), responsable de la vision chez les organismes vertébrés. L'isomérisation dans Rh se produit à environ 200fs[1], avec une efficacité exceptionnelle de 67% [2]. Pour cet exemple, Nature adapte et optimise l'environnement protéique afin que la réaction se produise rapidement et efficacement. Dans le cadre de cette dernière déclaration, nous étudions une rhodopsine microbienne appelée rhodopsine sensorielle Anabaena (ASR) fig.1a, qui représente un système modèle alternatif nous donnant l’occasion de voir l’effet de l’environnement protéique sur deux protéines différentes tout-trans (AT). conformations / isomères rétiniens 13-cis (13C) dans le même environnement protéique (fig.1b)[3],[4].
Le rapport des isomères dans les protéines dépend des conditions d’éclairage externe (intensité et longueur d’onde) qui atteignent un état photostationnaire, dit adapté à la lumière (LA). Fait intéressant, lors de l'incubation dans l'obscurité à la température ambiante, la population d'AT dépasse 97%, ce qui définit l'état appelé DA (Adapté à l'obscurité). AT et 13C subissent deux photo-cycles distincts s'interconversant sur une échelle de temps de la milliseconde (fig.1c) [5],[6].
iii
Fig.1: a) Structure cristallographique à rayons X ASR tracée à l'aide de la plateforme PyMol (données utilisées de la banque de protéines RCSB, bibliothèque: 1XIO); b) all-trans, 15-anti (AT) et 13-cis, 15-syn (13C) sont les conformations à l'état fondamental du PSBR; les flèches bleu clair indiquent la liaison C-C à laquelle se produit l'isomérisation. c) schéma de la référence 48 montrant les deux photo-cycles distincts se produisant pour les deux conformères d'état fondamental; Les lettres majuscules représentent les différents états intermédiaires formés dans chaque photocycle, tandis que x et y représentent les rapports de ramification des isomères AT et 13C.
L'absorption à l'état d'équilibre des isomères AT et 13C dans chaque protéine est illustrée à la figure 2a. Il a été montré que le décalage spectral de la transition S0→S1 est largement dominé par les interactions électrostatiques plutôt que par les effets stériques [7]. Dans le cas des mutants, nous avons observé un décalage vers le bleu du maximum d'absorption par rapport à l'ASR de type AT Wild, pouvant atteindre jusqu'à environ 33 nm dans le cas du mutant L83Q. Cette dernière est due à l'O-H dont l'extrémité négative est dirigée vers l'azote SB protoné, stabilisant ainsi S0.
La détermination expérimentale de l'ESL de chaque isomère dans la protéine a été obtenue en utilisant la technique de spectroscopie d'absorption transitoire (T.A.S) avec des impulsions laser inférieures à 50fs. La région de sondage pour l’enregistrement des différentes signatures spectroscopiques s’étendait de 330 nm (UV) à 1400 nm (NIR). Afin de mieux contrôler les conditions expérimentales en termes de contribution des isomères dans les échantillons, une chromatographie en phase liquide à haute performance (HPLC) a été utilisée.
La durée de vie de l'état excité de chaque isomère est déterminée par des mesures TAS dans la région NIR où se trouve la contribution de l'émission stimulée (SE). La contribution SE correspond à la transition de la décroissance de la population du premier état excité S1 à l'état fondamental S0. Une comparaison des traces cinétiques de cette contribution est montrée à la figure 2b, pour les isomères AT.
iv
Fig. 2 a) Absorption à l'état d'équilibre des isomères AT et 13C pour le WT-ASR et les mutants; b) Tracés cinétiques de la longueur d'onde centrale de la contribution de la SE dans la région spectrale du proche infrarouge
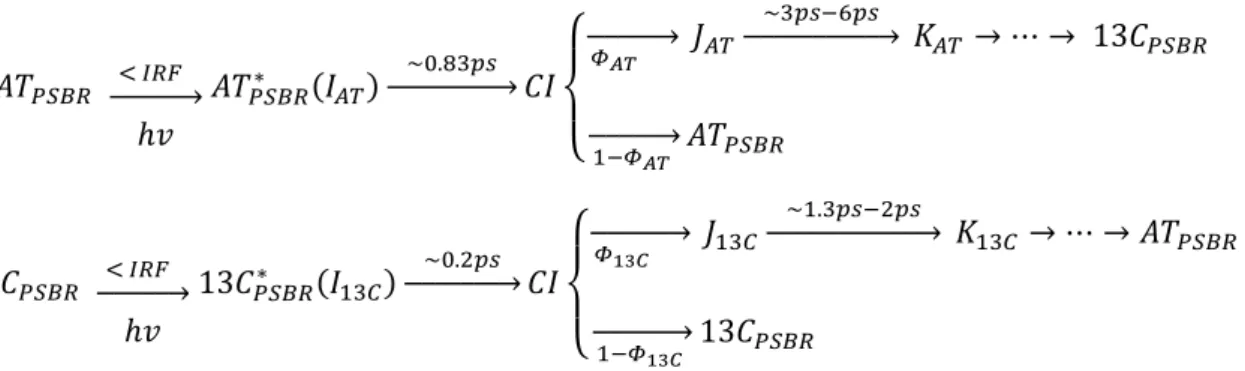
La protéine native ASR appelée Wild Type (WT) présentait une différence de facteur 4,5 de la vitesse d’isomérisation des deux isomères. La forme AT s'isomérise à moins de 0,83ps, tandis que la forme 13C se forme à moins de 0,2ps. Dans tous les cas, les isomères AT des mutants absorbent à des longueurs d'onde plus courtes que WT-ASR et montrent une décroissance de l'état excité bi-exponentielle avec une amplitude dominante> 70% sur la constante de temps courte. À partir des ajustements, nous trouvons (0,50 ± 0,04) ps et (1,86 ± 0,2) ps pour AT W76F, (0,34 ± 0,04) ps et (1,27 ± 0,2) ps pour AT V112N et (0,28 ± 0,04) ps et (1,26 ± 0,2) ps pour AT L83Q. Les ESL sont identifiées au temps de décroissance moyen, c'est-à-dire (0,70 ± 0,05) ps pour W76F, (0,52 ± 0,05) ps pour V112N et (0,48 ± 0,05) ps pour L83Q. L’accélération de la réaction de photo-isomérisation chez les mutants décalés vers le bleu suggère une pente plus raide de la surface d’énergie potentielle à l’état excité (PES) que dans le WT-ASR. Ceci peut être expliqué de manière provisoire par une dégénérescence surélevée entre les états S1 et S2 lors de mutations, contrairement à AT WT-ASR où le mélange électronique entre S1 et S2 est plus important, induisant ainsi un PES plat au voisinage de la région de Franck-Condon.
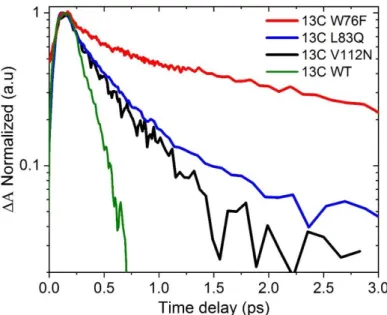
Complémentaire dans le cas de l'isomère 13C (fig. 3), un traitement similaire des données a également entraîné une désintégration de l'état excité bi-exponentiel. Le temps de chute moyen pondéré a été déterminé comme étant (2,1 ± 0,3) ps pour 13C W76F, (0,52 ± 0,05) ps pour 13C L83Q, (0,41 ± 0,05) ps pour 13C V112N et (0,19 ± 0,05) ps pour 13C WT-ASR . Contrairement aux isomères AT, la réaction de photo-isomérisation chez les mutants décalés dans le bleu semble ralentir.
v
Fig. 3 : Tracés cinétiques normalisés à partir de la longueur d'onde individuelle de SE pour 13C-PSBR dans WT ASR et mutants
La polarité différente des acides aminés remplacés (mutations) accompagnée du caractère de transfert de charge de l'état excité peut expliquer les vitesses d'isomérisation observées expérimentalement. Les mutations modifient la surface d'énergie potentielle (PES) des états excités, la rendant plus raide ou plus plate que celle de la protéine native, entraînant ainsi des vitesses de réaction plus rapides ou plus lentes respectivement.
Les mesures TAS effectuées dans la plage spectrale UV-VIS ont révélé des signatures oscillatoires de modes vibratoires actifs à l'état excité et fondamental pour tous les mutants (figure 4), mais leur rôle fonctionnel dans la réaction à l'état excité n'est pas clair. La figure 4a montre une courbe cinétique à une longueur d'onde centrale ESA de AT W76F où les oscillations sont> 4 fois supérieures au bruit de fond. Celles-ci sont isolées en soustrayant une décroissance exponentielle double appropriée des données (figure 4a). En explorant une large plage de 27 nm (444-471 nm) (figure 4c), les résidus de longueur d'onde individuelle correspondent à la superposition (lignes brunes). Une FFT des résidus moyennés (ligne verte) donne le spectre de puissance présenté à la figure 2d avec des contributions dominantes à certaines fréquences. Le résultat général de cette analyse est la présence de modes de vibration situés à (70 ± 20) cm-1, (160 ± 20) cm-1, (210 ± 20) cm-1 et (300 ± 20) cm-1. dans tous les mutants et WT ASR. Les modes> 160 cm-1 proviennent de l'état excité, tandis que la fréquence la plus basse comprise entre 60 et 70 cm-1 et détectée dans la région PA correspond aux oscillations du sol. Les décalages bleu / rouge de la fréquence de chaque mode se produisent dans une plage de ± 20 cm-1, en fonction de la protéine et de la plage de détection.
vi
Fig. 4: Procédure d'extraction des oscillations à partir de données T.A. A) Trace cinétique à 459 nm de DA W76F; Les cercles noirs correspondent aux données expérimentales tandis que les lignes continues rouges et bleues s’adaptent et les résidus, respectivement. B) FFT des résidus déterminés à partir de A). C) Résidus de traces de cinétique dans la gamme de 441nm à 471nm (lignes avec la couleur du vin) et moyenne (vert clair). D) FFT de résidus moyenne de C). Une pause est utilisée pour montrer le bruit de fond défini, qui est ici l'amplitude des pics >1100cm-1.
Un projet parallèle, étroitement lié au projet principal, concerne la production de mutants ASR à rendement quantique de fluorescence amélioré, par rapport au WT-ASR. Les calculs avancés QM / MM effectués par le groupe du professeur Massimo Olivucci ont prédit que des mutations simples ou doubles d'ASR pourraient potentiellement entraîner une augmentation de la fluorescence Q.Y de ces mutants. En réalisant ce type d'ingénierie de l'environnement protéique, il devrait être possible de créer des mutants avec des surfaces d'énergie potentielles spécifiques, en termes de forme et d'énergie relative.
Des mesures pour la détermination de l'ESL et du rendement quantique de fluorescence relatif ont été effectuées. Dans ce dernier but, une configuration de fluorescence sensible à l’état stable a été construite. Les résultats dans le cas du mutant W76S / Y179F ont montré une augmentation relative de Q.Y de fluorescence de 8 par rapport à AT WT ASR (fig. 5a). Ce dernier résultat est également corroboré par la durée de vie ESL déterminée à partir des données SE, alors que nous observons une augmentation relative environ 7 fois supérieure de l'ESL (fig. 5b). Dans le cas du mutant L83Q, un comportement opposé est observé lorsque nous avons une réduction de l'ESL d'un facteur deux, mais deux fois plus grande, Q.Y. relative. Ces dernières observations sont expliquées en termes de mélange électronique S1 et S2. Puisque S2 est un état non réactif, ce mélange conduit à un plateau défavorable de la
vii surface d'énergie potentielle de l'état excité. Ainsi, plus le mélange est prononcé, plus la durée de vie est longue.
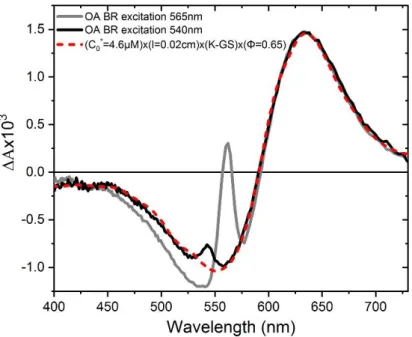
Dans le cas du mutant W76S / Y179F, différents isomères, outre le canonique tout-trans et le 13-cis, sont présents dans l'état fondamental, comme nous l'avons déterminé à partir de notre appareil HPLC. Afin de déterminer que l'isomère AT est effectivement responsable de l'augmentation du QY de fluorescence et de l'ESL, nous avons effectué des expériences sur trois états photostationnaires DA, OA et GA (à l'aide d'une LED verte) où le pourcentage des isomères de différence variait. La clarification de notre hypothèse a également été appuyée expérimentalement et est en outre en accord avec les prévisions théoriques. Nous concluons donc que le mutant W76S / Y179F qui a montré une augmentation de Fl. QY et ESL peuvent être utilisés en optogénétique car les mutants Arch3 déjà utilisés pour différentes applications présentent des propriétés comparables[8].
Fig. 5 (a) Fluorescence à l'état stable pour le mutant AT WT-ASR, DA L83Q et W76S / Y179F (b) Tracés cinétiques de la longueur d'onde centrale de la contribution de la SE pour des échantillons DA WT, DA L83Q, OA et GA W76S / Y179F.
Configurations expérimentales
Une partie de mon travail dans cette thèse consistait à mettre à niveau un spectromètre T.A utilisé auparavant pour la spectroscopie à cohérence vibratoire (VCS) en un spectromètre 2DES fonctionnant dans la plage spectrale UV-Vis. Le spectromètre 2DES utilise une paire d'impulsions de moins de 10fs verrouillées en phase dans la plage du proche UV-bleu 360-430nm et peut être utilisé pour réaliser 2DES sur des systèmes (bio) moléculaires absorbant dans cette gamme spectrale.
Le système TWINS (Translating Wedge-based Identical Pulses eNcoding System) permet de générer deux répliques colinéaires verrouillées en phase de l'impulsion Red-NIR et, conséquence du SFG, deux impulsions proches de l'UV verrouillées en phase. Selon le concept inventé par Brida et al [9], [10], le système TWINS est composé de trois blocs (A, B, C, comme indiqué à la fig.6) en matériau a-BBO. Ce matériau est choisi en raison de ses propriétés de biréfringence, car dans ce type de cristaux uniaxiaux négatifs, l'indice de réfraction ordinaire (o) a des valeurs supérieures à celles de l'extraordinaire.
viii
Fig. 6: Système TWINS composé d'une plaque a-BBO et de quatre cales a-BBO coupées le long d'axes optiques différents (figure adaptée de la référence 10); les axes optiques de chaque élément optique sont indiqués par des flèches vertes à double face. Le bloc A crée un retard négatif initial entre les impulsions polarisées Y et X (épaisseur 2,4 mm). Le bloc B est monté sur un étage motorisé dont la translation, dans la direction Y, modifie le chemin optique de l'impulsion polarisée en Y, introduisant un retard entre les impulsions. Le bloc C sert à corriger l’inclinaison du front de phase et la direction légèrement non colinéaire des impulsions après la sortie du bloc B. Le polariseur P à la fin de la séquence projette les deux impulsions sur un axe de polarisation linéaire incliné à 45 °. Les cales conçues pour les jumeaux ont des dimensions a = 25 mm, b = 3,1 mm et c = 0,5 mm avec un sommet de bord ~ 7 °.
Le bloc A est responsable de la division de l'impulsion entrante en deux impulsions à polarisations perpendiculaires et de même intensité, tout en créant simultanément un retard initial entre elles. Le bloc B, qui est composé d'une paire de coins, sépare dans l'espace et dans le temps (avec une précision attoseconde) les deux polarisés orthogonalement. Ainsi, la variation du retard entre les deux impulsions peut être obtenue. Le bloc C chevauche spatialement la paire de deux impulsions avec le polariseur P les projetant dans une polarisation unique.
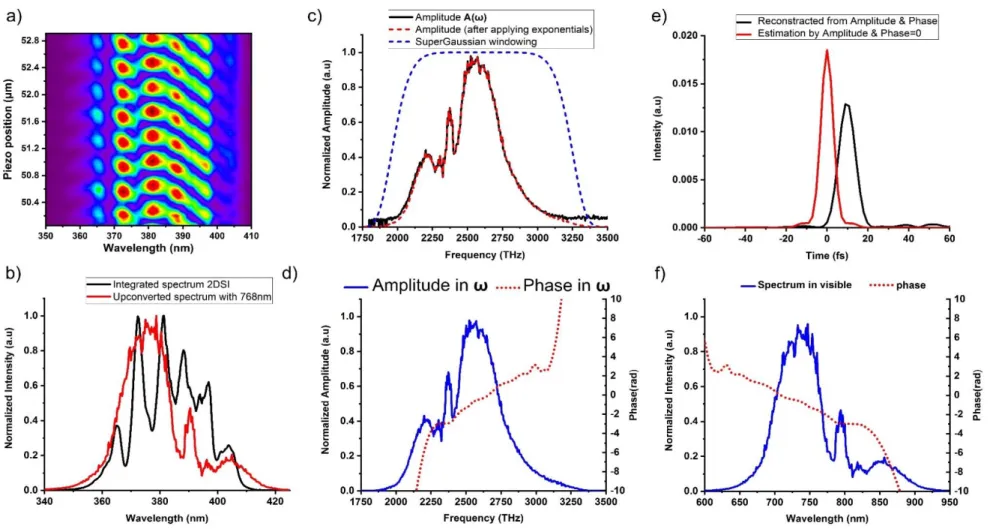
Pour prouver le principe, nous avons enregistré une autocorrélation à résolution spectrale des impulsions proche de l’UV-Vis, enregistrée en faisant varier le délai entre les deux répliques IR-Rouge avec le dispositif TWINS (fig. 7). Comme le montre la figure, le spectre d'impulsions structuré est chiffré sur la carte de traces d'autocorrélation, avec des preuves des interférences constructives et destructives lors du déplacement du moteur TWINS. Ce dernier prouve clairement que nous sommes capables de produire deux répliques colinéaires du pouls UV-Bleu et de retarder l’une par rapport à l’autre. Ce type de mesure d'autocorrélation est utilisé dans la procédure d'étalonnage avant d'effectuer des mesures 2DES (en ayant les deux répliques dispersées dans le spectromètre) et permet ainsi de récupérer l'axe d'excitation..
ix
Fig. 7: Autocorrélation à résolution spectrale des impulsions proches de l'UV-Vis enregistrées en faisant varier le délai entre les deux répliques IR rouge avec le dispositif TWINS; à droite le spectre des impulsions à t1 = 0fs est montré pour comparaison
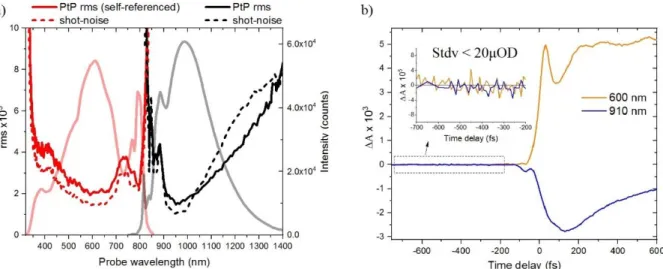
Une partie de mon doctorat en 3ème année a été consacrée à la construction d'un spectromètre à absorption transitoire fonctionnant dans la plage spectrale NIR. Des améliorations supplémentaires ont également été apportées à la plage de détection du spectromètre UV-Vis. La figure 8 récapitule un résumé de ce travail concernant la fenêtre de commande dans les deux configurations avec différents niveaux de bruit (fig.8a). La sensibilité des deux configurations est illustrée à la fig.8b où, pour les longueurs d'onde avec le niveau de bruit le plus faible, nous pouvons atteindre une sensibilité de OD <20x10-6, suffisamment élevée pour obtenir un très bon rapport signal sur bruit et déterminer le ESL des différents échantillons avec la plus grande précision possible.
Fig. 8 : a) Détection équilibrée et non équilibrée pour les configurations UV-Vis et NIR, respectivement; Le bruit de tir est représenté par des lignes pointillées; Pt RMS plus de 1000 impulsions indiquées par des lignes continues; WL pour chaque région de sondage indiquée par des lignes épaisses transparentes b) Les traces cinétiques avec des retards de temps négatifs démontrent la sensibilité des configurations; Les traces cinétiques des configurations UV-Vis (ligne orange) et NIR (ligne bleue) montrent respectivement un Stdv <20x10-6 après une moyenne de 2500 spectres différentiels (temps d'acquisition de 5s)
x
Conclusions
À partir de notre analyse, l'ESL des deux isomères a été déterminée pour tous les échantillons. Initialement, nous avons confirmé les rapports antérieurs sur WT ASR avec une ESL pour les isomères AT et 13C de 0,83ps et 0,2ps respectivement. De plus, les mutations ponctuelles introduites aux positions 76, 83 et 112 semblaient accélérer la réaction d’isomérisation des isomères de l’AT, accompagnées d’un décalage vers le bleu de leurs maxima d’absorption (fig. 9). L'impact le plus important a été observé pour le mutant L83Q avec une réduction d'environ 2 fois de l'ESL (0,48ps). L'origine de cette différence a été attribuée au mélange électronique S1 / S2 (travail de calcul de M. Del Carmen Marín, Y.Orozco-Gonzalez et M.Olivucci).
Au contraire, l'effet sur le 13C-PSBR est exprimé par une augmentation de l'ESL. De manière surprenante, dans le cas du mutant W76F, une ESL différant d'un ordre de grandeur est observée. En cartographiant les résultats obtenus pour le 13C-PSBR, nous voyons que le décalage dans l’absorption s’accompagne d’une augmentation de l’ESL contrairement au cas d’AT.
En plus de l'ESL, nous avons fourni des informations concernant l'activité vibratoire des modes à basse fréquence (plage <400 cm-1). Les expériences réalisées pour les protéines DA et LA ont abouti à quatre modes basse fréquence présentés pour tous les mutants et WT-ASR compris entre 60 cm-1 et 400 cm-1. Ces derniers résultats ont déjà été rapportés dans la littérature pour d’autres protéines de la rétine, en attribuant ces modes aux torsions délocalisées du squelette du chromophore.
Nos travaux sur les mutants ASR ont abouti à la découverte d'un mutant W76S / Y179F qui présente une augmentation d'environ 8 fois du rendement quantique de fluorescence par rapport à WT-ASR. Le mutant en question a une durée de vie picoseconde (ESL de 5,7 ps) avec une fluorescence QY (2,17x10⁻³) pas trop éloignée des mutants Arch3 améliorés appliqués en optogénétique. Dans le manuscrit soumis présenté dans cette thèse, une comparaison à l'égard de WT-ASR et du mutant L83Q est décrite. Les calculs de trajectoire de réaction et de trajectoire montrent que le changement observé dans l'ESL est dû à un changement opposé du caractère de transfert de charge de l'état S1 de la molécule. De tels changements peuvent être décrits comme une augmentation du caractère diradical 2Ag non réactif le long des séries L83Q, WT, W76S / Y179F. La variation de L83Q à WT est dominée par un effet électrostatique alors que la variation de WT à W76S / Y179F est contrôlée par des effets stériques: une modification des détails de la coordonnée d'isomérisation.
xi
Fig. 9 : ESL en ce qui concerne les maxima d'absorption des isomères AT (carrés) et 13C (triangles) dans WT-ASR et les trois mutants. Les lignes pointillées vertes et rouges sont des repères pour l’œil, montrant la tendance des PSBR AT et 13C-PS respectivement.
Concernant notre contribution au développement de nouveaux outils spectroscopiques, nous avons pu mettre à niveau le spectromètre T.A précédemment utilisé pour la spectroscopie à cohérence vibratoire (VCS) en un spectromètre 2DES fonctionnant dans le domaine spectral UV-Vis. Le spectromètre 2DES utilise une paire d'impulsions de moins de 10fs à verrouillage de phase situées dans la plage du proche UV-bleu à 360-430nm et peut être utilisé pour réaliser des 2DES sur des systèmes (bio) moléculaires absorbant dans cette gamme spectrale. En outre, un spectromètre T.A performant dans la plage spectrale NIR (800-1400) nm a été construit, utilisé pour l'étude d'échantillons ASR. Cette dernière configuration permet de mesurer des signaux <10-3, avec un niveau de bruit pouvant aller jusqu’à ~ 20x10-6 sur 5s de temps d’acquisition à 910 nm.
xii
Références
[1] D. Polli et al., “Conical intersection dynamics of the primary photoisomerization event in vision,” Nature, vol. 467, no. 7314, pp. 440–443, Sep. 2010.
[2] J. E. Kim, M. J. Tauber, and R. A. Mathies, “Wavelength Dependent Cis-Trans Isomerization in Vision †,” Biochemistry, vol. 40, no. 46, pp. 13774–13778, Nov. 2001. [3] K.-H. Jung, V. D. Trivedi, and J. L. Spudich, “Demonstration of a sensory rhodopsin in
eubacteria: Sensory rhodopsin in eubacteria,” Molecular Microbiology, vol. 47, no. 6, pp. 1513–1522, Mar. 2003.
[4] O. A. Sineshchekov, V. D. Trivedi, J. Sasaki, and J. L. Spudich, “Photochromicity of
Anabaena Sensory Rhodopsin, an Atypical Microbial Receptor with a cis -Retinal
Light-adapted Form,” Journal of Biological Chemistry, vol. 280, no. 15, pp. 14663–14668, Apr. 2005.
[5] A. Kawanabe and H. Kandori, “Photoreactions and Structural Changes of Anabaena Sensory Rhodopsin,” Sensors, vol. 9, no. 12, pp. 9741–9804, Dec. 2009.
[6] A. Kawanabe, Y. Furutani, K.-H. Jung, and H. Kandori, “Photochromism of Anabaena Sensory Rhodopsin,” Journal of the American Chemical Society, vol. 129, no. 27, pp. 8644–8649, Jul. 2007.
[7] D. Agathangelou et al., “Effect of point mutations on the ultrafast photo-isomerization of Anabaena sensory rhodopsin,” Faraday Discussions, vol. 207, pp. 55–75, 2018.
[8] M. del C. Marín et al., “Fluorescence Enhancement of a Microbial Rhodopsin via Electronic Reprogramming,” Journal of the American Chemical Society, vol. 141, no. 1, pp. 262–271, Jan. 2019.
[9] D. Brida, C. Manzoni, and G. Cerullo, “Phase-locked pulses for two-dimensional spectroscopy by a birefringent delay line,” Optical Society of America, vol. 37, pp. 3027– 3029, Aug. 2012.
[10] J. Réhault, M. Maiuri, A. Oriana, and G. Cerullo, “Two-dimensional electronic spectroscopy with birefringent wedges,” Review of Scientific Instruments, vol. 85, no. 12, p. 123107, Dec. 2014.
1
Part I
2
1 General introduction - Thesis content
Our research interest is located on the photo-physical study of retinal proteins and particularly Sensory Rhodopsins. These are light-sensitive systems which upon light absorption undergo a conformational change called isomerization. The latter process is ultrafast (<10-12s) and takes place on the protein’s retinal chromophore. Through the isomerization mechanism, the absorbed photon’s energy is converted into chemical energy and is used by the system for the execution of a specific biological function. Our studies are focused on this initial step of the chemical reaction where we want to determine the speed and the efficiency of this process, and how these are influenced by the protein environment. The best known example of such a system is Rhodopsin (Rh), which is responsible for vision in vertebrate organisms. Isomerization in Rh occurs within ~200fs, with an outstanding 67% efficiency1. For this example, nature tunes and optimises the protein environment in order for the reaction to occur fast and simultaneously efficient. In the frame of the latter statement, we study a microbial rhodopsin called Anabaena Sensory Rhodopsin (ASR), which represents an alternative model system giving us the opportunity to see the effect of the protein environment on two different all-trans (AT) and 13-cis (13C) retinal conformations/isomers in the same protein environment.
The studies on the native protein (WT-ASR) are described in chapter 3, where the excited state lifetimes and isomerization quantum yields are determined for both ground state reactants. In chapter 4, our work extends on the study of point mutated proteins, by replacement of specific residues in the proximity of the retinal chromophore. Thus, a comparison between different environments is presented, which interestingly have an opposite effect on AT and 13C isomers. Chapter 5 shows a work on fluorescent ASR mutants where, in collaboration with the quantum chemistry team of Prof. M. Olivucci (U Siena & Bowling Green) the origin of the fluorescence enhancement is identified.
Beside our interest on retinal proteins, part of our work is devoted to the development of new spectroscopic tools. In this context, a femtosecond two-dimensional electronic spectroscopy setup is developed, which uses a pair of phase-locked ~sub-10fs pulses at 400nm for excitation. The potential application of the 2DES spectrometer is on (bio)molecular systems which absorb in the near-UV-blue spectral range. In addition, a transient absorption spectrometer performing in the NIR spectral range was developed, and used for the study of the retinal proteins. A detailed description of the experimental setups and the data treatment procedures are presented in chapter 2.
This PhD work took place in the BIODYN group of the Department of Ultrafast Optics and Nanophotonics (DON) at Institut de Physique et Chimie des Matériaux de Strasbourg (IPCMS), in close partnership with theoreticians (M.Olivucci, N.Ferré) and experimentalists (T.Buckup, G.Cerullo). ASR samples were kindly provided by the groups of K-H.Jung and H.Kandori.
3 References
(1) Kim, J. E.; Tauber, M. J.; Mathies, R. A. Wavelength Dependent Cis-Trans Isomerization in Vision
†
5
Part II
Experimental techniques
and Data treatment
6 2.1.1 Non-linear Optics
The interaction of light with matter is a mainstream in nonlinear optics. When a dielectric medium experiences very low intensity of light; such as ambient light, the optical properties of the material remain almost independent of the light intensity. In this case the relationship between the induced macroscopic polarization 𝑃⃗ and the applied electric field 𝐸⃗ remains linear according to eq.1, where ε0 and χe are the vacuum permittivity and electric
susceptibility of the medium respectively.
𝑃⃗ (𝜔) = 𝜀0𝜒𝑒𝐸⃗ (𝜔) eq. 1
On the contrary, when the magnitude of the 𝐸⃗ reaches high values ~1014 W/cm-2; which is the case for pulsed femtosecond lasers, then anharmonic terms rise for χ and thus it can be expressed as a power series of 𝐸⃗ (eq.2).
𝑃⃗ = ∑𝑛𝑖=0𝑃⃗ 𝑖 = 𝑃0 + 𝜀0(𝜒(1)𝐸⃗ +𝜒(2)𝐸⃗ 2+𝜒(3)𝐸⃗ 3+ ⋯ +𝜒(𝑖)𝐸⃗ 𝑖) eq. 2
Under these conditions, the induced dipoles oscillate at higher frequencies than the fundamental of the applied field (i.e 2ω, 3ω etc). Furthermore, these dipoles may oscillate coherently (with a definite phase relation between them), meaning that in certain circumstances they add together constructively (phase matching) producing a much larger intensity. Depending on the material used and the polarization of the electric field several nonlinear phenomena can be observed1. Some of these phenomena are sum frequency generation (SFG), second harmonic generation (SHG), optical parametric amplification (OPA) and white light generation (WLG).
2.1.2 Sum Frequency Generation (SFG)
Sum frequency generation is a 𝜒(2) process which is observed when two polarized waves are met in a non-centrosymmetric medium, fully complying to momentum and energy conservation laws. In principle the medium is birefringent (nonlinear crystal), with the incoming waves experiencing different propagation paths depending on their polarization (along the ordinary or extraordinary optical axes of the crystal).
The phase matching conditions in terms of wave vectors is 𝑘1
⃗⃗⃗⃗ + 𝑘⃗⃗⃗⃗ = 𝑘2 ⃗⃗⃗⃗ eq. 3 3 while simultaneously the energy conservation law requires that
𝜔1+ 𝜔2= 𝜔3 eq. 4
Generally the produced signal (ω3) is polarized perpendicularly to at least one of the two
mixing waves and at higher energy (sum of ω1 and ω2)2. When the polarization of the two
incident waves is the same, the phase matching is Type I (o + o = e), while the alternative case with perpendicular polarizations for waves 1 and 2 results in Type II (o+e→e or e+o→e). Depending on the cut angle of the crystals ellipsoid (θ and φ), the thickness and the mixing frequencies, the SFG process can result in broader bandwidth conversion and higher efficiency3.
7
An example of SFG is shown in fig.21, where a broadband NIR pulse generated in a Hollow Core Fiber (HCF) filled with Neon gas is up-converted with a quasi-monochromatic 800nm pulse. The phase matching was type II on a 80μm thick BBO crystal resulting in a broad UV-Vis pulse centered at 400nm.
2.1.3 Second Harmonic Generation (SHG)
A degenerate case of SFG is the SHG process, where two photons of the incident beam, with the same wave vectors 𝑘⃗⃗⃗⃗ = 𝑘1 ⃗⃗⃗⃗ = 𝑘2 ⃗⃗⃗⃗⃗ and frequencies 𝜔𝜔 1 = 𝜔2 = 𝜔, generate a third photon
in the 𝑘⃗⃗⃗⃗ = 𝑘3 ⃗⃗⃗⃗⃗⃗⃗⃗ direction and double frequency 𝜔2𝜔 3 = 2𝜔. Thus, equations 3 and 4 can be written as follows
𝑘𝜔
⃗⃗⃗⃗⃗ + 𝑘⃗⃗⃗⃗⃗ = 𝑘𝜔 ⃗⃗⃗⃗⃗⃗⃗ , 𝜔 + 𝜔 = 2𝜔 2𝜔
This is the most efficient way to generate a laser pulse by frequency doubling the incident beam. An example of SHG in this thesis, is the generation of a 400nm pulse serving as the pump beam in a non-collinear optical amplifier (section 2.1.5) operating in the visible spectral range. There ~160µJ of the 800nm fundamental beam propagate in a β-barium borate (BBO) crystal resulting in ~40µJ pulse centered at 400nm.
2.1.4 White light generation (WLG)
White light generation is a 𝜒(3) nonlinear process occurring when an intense light pulse is focused in transparent mediums (i.e fused silica, sapphire etc)4. The general result is spectral broadening due to self-phase-modulation (SPM) of the pulse5. In this case, the beam impinging on a material of thickness L, the refractive index of the medium becomes a linear function of the intensity according to equation 5
𝑛(𝑡) = 𝑛0 + 𝑛2𝐼(𝑡) eq. 5
In this way, the nonlinear refraction coefficient n2 is related to 𝜒(3) with the effect of time
variations giving rise to phase changes in the optical carrier wave as shown in eq.6. 𝜑(𝑡) = 𝜔0𝑡 −𝜔0 𝑐0 𝑛(𝑡)𝐿 eq. 6 𝜔(𝑡) = 𝑑𝜑(𝑡) 𝑑𝑡 = 𝜔0(1 − 𝑛2𝐿 𝑐0 𝑑𝐼 𝑑𝑡) eq. 7
The latter leads to a variation of the instantaneous frequency (eq.7), where the leading edge of the pulse (dI/dt>0) is shifted to lower frequencies and supplementary the trailing edge (dI/dt<0) to higher frequencies6. This brief description explains the spectral broadening observed.Other processes which contribute also to the WLG such as focusing, and self-steepening are not commented. In this thesis WLG produced in a 2mm CaF2 crystal
(300nm-840nm) or in a 4mm YAG (800nm-1400nm), serves as probe pulses in transient absorption experiments (fig.1).
8
Fig. 1 : WLG in a 2mm thick CaF2 crystal (320nm-850nm) and a 4mm YAG crystal (800nm-1400nm); WL probe in CaF2 crystal
recorded through KG-1 and KG-5 color filters; WL probe in YAG crystal recorded through RG-9 and RG-850 long pass filters;
2.1.5 Optical Parametric Amplification (OPA)
The purpose of using this nonlinear process arises from the need of pulses different in frequency and shorter in duration than the fundamental laser source in the μJ energy range. Parametric Amplification takes place in a second order nonlinear crystal analogous to the case of SFG. Here, instead of mixing two frequencies ω1 and ω2 to get the sum of the two
(ω3), the opposite process is observed (similar to difference frequency generation). A photon
of frequency ωp (called pump) is absorbed by a virtual level of the material and two photons
at frequencies ωi (idler) and ωs (signal) are emitted. In an OPA, a high intensity beam (pump)
transfers its energy to a lower in intensity and varying in frequency beam (called signal or seed), while a third beam (idler) is also generated with ωi<ωs<ωp.
Some of the crucial parameters for the process efficiency are the phase mismatch Δk, the pump wavelength λp and intensity Ip, the effective nonlinear coefficient deff and length L of
the crystal as described in detail by Cerullo et al6,7.
𝛥𝑘 = 𝑘𝑝− 𝑘𝑠− 𝑘𝑖 eq. 8 𝛤 = √ 8𝜋2𝑑𝑒𝑓𝑓𝐼𝑝
𝑛𝑖𝑛𝑠𝑛𝑝𝜆𝑖𝜆𝑠𝜀0𝑐0 eq. 9
Including these individual parameters in a global parameter Γ (nonlinear coefficient) while assuming a perfect phase matching (Δk=0) in the large gain approximation 𝛤𝐿 ≫ 1, the equations describing signals (Is) and idlers (Ii) intensities can be derived.
𝐼𝑠(𝐿) ≅1 4𝐼𝑠𝜊𝑒 (2𝛤𝐿) eq. 10 , 𝐼 𝑖(𝐿) ≅ 𝜔𝑖 4𝜔𝑠𝐼𝑠𝜊𝑒 (2𝛤𝐿) eq. 11
Thus the gain of the process G can be defined as the ratio of the signals intensity after the process Is (L) with respect to the one before Iso.
𝐺 =𝐼𝑠(𝐿) 𝐼𝑠𝜊 =
1 4𝑒
(2𝛤𝐿) eq. 12
Equation 12 shows that the gain grows exponentially upon increasing crystals length L and the nonlinear coefficient Γ. In addition, the phase matching bandwidth which critically depends on the group velocity mismatch between signal and idler is given by eq.13.
9 ∆𝑣 = 2(𝑙𝑛2) 1 4 𝜋 ( 𝛤 𝐿) 1 4 1 |𝜕2𝑘𝑠 𝜕𝜔𝑠2+ 𝜕2𝑘𝑖 𝜕𝜔𝑖2| eq. 13
The type of phase matching I or II corresponds to broader or narrower amplification bandwidth respectively.
In the same framework as described above, generation of ultrashort pulses <10fs may be achieved by using Non-collinear Optical Parametric Amplifiers (NOPA). The difference with respect to OPAs is the geometry of the beams when phase matching is obtained. While in OPAs pump and signal beam are collinear, in NOPAs they have a small angle α < 8° (fig.2a).
Fig. 2 : Scheme describing a) a non-collinear interaction geometry; b) signal and idler geometrical configuration in the case of collinear interaction; and c) non-collinear interaction (ref.7)
According to fig.2a the idler is emitted at an angle Ω with respect to the signal and the phase matching condition becomes a wave vector equation according to eq.14 and 15. Δkpar and
Δkper is the mismatching projected on directions parallel and perpendicular to the signal wave vector.
𝛥𝑘𝑝𝑎𝑟 = 𝑘𝑝cos 𝑎 − 𝑘𝑠− 𝑘𝑖cos 𝛺 = 0 eq. 14
𝛥𝑘𝑝𝑒𝑟= 𝑘𝑝sin 𝑎 − 𝑘𝑖sin 𝛺 = 0 eq. 15
It is found that when the signal group velocity equals the projection of the idler group velocity along the signal’s direction (eq.16), then broadband phase matching is achieved.
𝑣𝑔𝑠= 𝑣𝑔𝑖cos 𝛺 eq. 16
NOPAs are also able to work in narrowband operation when a broadband chirped pulse serves as the seed beam. Usually the seed beam is a white light generated in sapphire plates or YAG crystals. When WL is used as a seed, idler’s phase stability is ensured as was demonstrated by Baltuska et al8.
Fig. 3 shows the scheme of the NOPA used as excitation source in the pump-probe experiments described in the thesis. Initially 0.16mJ of 40fs pulses at 800nm (1KHz) enter the amplifier and are splitted in a 90:10 ratio using a beam splitter. The 90% of the energy is used to generate the pump beam via SHG on a type I BBO and the 10% for generating the seed beam via WLG in a 2mm sapphire plate (Sa). The pump and seed are spatially overlapped on a type II BBO for obtaining amplification with the temporal overlap of the two established by a manual delay line (D.L). Collimation of the amplified signal is achieved by a concave mirror (S.M) and the dispersion compensation is achieved by setting several bounces on a pair of chirped dielectric mirrors (DCM12 from LaserQuantum).
10
Fig. 3 : Scheme describing the NOPA operating in the visible range
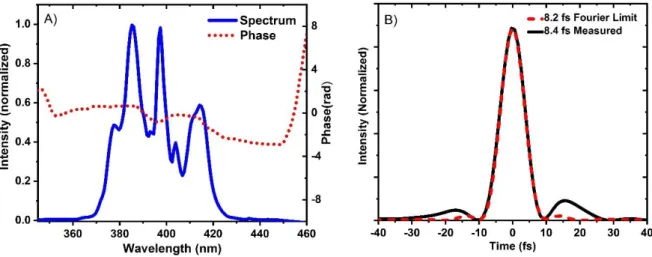
An example of broadband and narrowband operation is shown in fig.4. In broadband operation sub-10fs pulses are supported by the spectrum, while in narrowband operation a 30-40fs duration is supported. The pulse-to-pulse intensity fluctuations of all the pulses were in the range of 0.3% to 0.6%, monitored by a photodiode over 1000 pulses.
Fig. 4: NOPA spectra operating in the Visible range; Black solid line shows the output spectrum in broadband operation and coloured solid lines the different spectra obtained for narrowband operation
2.1.6 Pulse Shaper – 4f line
A 4f line or zero dispersive line is a pulse shaper, which allows access to the amplitude and phase of a pulse in the spectral domain. Originally it is composed by two gratings and two lenses/curved mirrors (fig.5a). The role of the first grating is to angularly disperse the different spectral components. Afterwards a lens located at distance f away from the grating, focuses each of these individual frequencies on small diffraction spots, at the Fourier plane (mask at FP). In this configuration at the F.P all the spectral components are spatially separated and focused. Then another couple of lens and grating placed at mirror positions are recombining all the individual frequencies and delivering them in a single collimated beam at the output of the 4f-line9.
An equivalent and space saving apparatus is the half 4f-line shown in fig.5b; the latter will be used for explaining briefly the concept of operation. In this thesis, our 4f line is based on the half 4f line configuration, where instead of lenses, a spherical mirror is used and a variable slit is placed at the Fourier plane serving as the mask (see fig.6). The slit is a spectral (Mω)
11
and spatial mask (MX) simultaneously. The different geometric properties such as, incident angle θi on the grating, diffraction angle θd, central wavelength λ0, focal length f and grating period d, define the frequency resolution of the pulse shaper as explained below.
Fig. 5 : 4f line pulse shapers schemes (figure from ref.9) a) the zero dispersion line consists of two gratings and two lenses, each placed at a relative distance equal to the focal length of the lenses; in the absence of a mask the incoming pulse remains unchanged on the output b) scheme of half 4f line; the different notations on the scheme are used in the text below for the theoretical description
In our description, we consider a Gaussian beam propagation and linear dispersion, in which a certain frequency ωk can be written as a function of the spatial coordinate in the Fourier plane X with the finite size due to diffraction at the F.P being Δx0.
𝑋𝑘= 𝛼𝜔𝑘 , 𝛥𝑥0 = 2𝑙𝑛(2) 𝑐𝑜𝑠 𝜃𝑖 𝑐𝑜𝑠 𝜃𝑑 𝑓𝜆0 𝜋𝛥𝑥𝑖𝑛 , 𝛼 = 𝜆02𝑓 2𝜋𝑐𝑑 𝑐𝑜𝑠 𝜃𝑑 eq. 17
The frequency resolution δω of the apparatus is determined by the ratio between Δx0 and parameter α. The latter, is defined by the 4f line geometry. The Fourier transform of δω corresponds to a time window T as shown in eq.18.
δω = 𝛥𝑥0/α , 𝑇 = 4ln(2)/δω eq. 18
As shown in the scheme (fig.5b), the incoming pulse 𝐸̃𝑖𝑛(𝜔) is diffracted by a grating with an
angle θd (incident angle is θi) where at a distance f, a lens focuses each spectral component at the FP. Just after the F.P the electric field of the pulse can be written as in eq.19 with g(X) being the spatial extension of a given frequency component.
𝐸̃𝑎𝑓𝑡𝑒𝑟(𝜔, 𝛸) = 𝐸̃𝑖𝑛(𝜔)𝑔(𝛸 − 𝛼𝜔)𝛭𝛸(𝛸) eq. 19
𝑔(𝛸) = exp [−2ln(2)(𝑋/𝛥𝑥0)2] eq. 20
Assuming that the spatial profile is unaffected by the mask, then the relation between (Mω) and (MX) holds.
𝑀𝜔(𝜔) = 𝑀𝑋(𝛼𝜔) eq. 21
Thus, after the backwards propagation (reflection on a flat mirror close to the FP) the electric field of the output pulse is given by eq.22 where H(ω) is the convolution between the spectro-spatial function g(ω) describing the pulse profile and the spectro-spatial mask (Mω).
12
𝐸̃𝑜𝑢𝑡(𝜔) = 𝐻(𝜔)𝐸̃𝑖𝑛(𝜔) eq. 22
𝐻(𝜔) = ∫ 𝑀𝜔΄𝑔(𝜔΄ − 𝜔)𝑑𝜔΄ = 𝑀𝜔⊗ 𝑔(𝜔) eq. 23
Thus, the spectro-spatial filtering of an incoming pulse described by 𝐸̃𝑖𝑛(𝜔), will result in a spectrally narrower pulse and simultaneously temporally broadened as the relationship between bandwidth and duration holds; the 4f line ensures that no dispersion is induced by the filtering process.
In this thesis, we use the 4f line for shaping a NIR pulse centered at 800nm with 40fs duration to generate a quasi-monochromatic NIR pulse at 800nm with ~1ps duration. This pulse is afterwards used for the generation of a pair of sub-10fs pulses at 400nm by SFG with a pair of 7fs NIR pulses (see section 2.3.3).
Fig. 6 : Half 4f line used for producing a tuneable quasi-monochromatic NIR pulse; Instead of lenses a 2-inch concave mirror is used, while a variable slit is playing the role of the spectro-spatial mask at the Fourier plane; From an input pulse with 40fs duration and 0.7mJ we can output up to ~1ps long pulses, conserving simultaneously the nearly Gaussian temporal shape of the pulse; S.M: spherical mirror (concave)
2.2.1 Transient absorption spectroscopy (TAS)
The most common spectroscopic technique which allows to follow in time photochemical reactions with femtosecond resolution is the transient absorption spectroscopy. It measures the changes in the absorption spectrum of a sample after perturbation by an ultrashort pulse10. Two laser pulses are involved, one called pump and the other one called probe (fig.7). The arrival of the pump pulse (resonant with an electronic transition of the sample) at t=0, perturbs the system allowing the appearance of new transitions with specific spectral characteristics (fig.8a). After a certain delay t=T, the probe pulse which is much lower in intensity, arrives on the sample and dissipates its energy along these transitions already activated by the pump. The signal measured ΔΑ(λ,t) is the difference between the probe’s absorption when the pump is present A(λ,t)w and when not A(λ,t)w/o.
According to Beer-Lambert’s law:
∆𝐴(𝜆, 𝑡) = 𝐴(𝜆, 𝑡)𝑤− 𝐴(𝜆, 𝑡)𝑤/𝑜 = − 𝑙𝑜𝑔10 𝐼𝑤
𝐼𝑤/𝑜 eq. 24
The interaction scheme in TAS results in the build-up of a macroscopic third order nonlinear polarization 𝑃𝑁𝐿(3) in the sample.Initially, the pump pulse prepares a coherent vibrational state
13
an absorption to a third electronic state or by stimulated emission back to the ground state11. In this description for a given delay between pump and probe, the latter measures the first-order linear absorption of the nonstationary ground and excited state. Therefore, the TAS signal for a given time delay t can be written as:
∆𝐴(𝜆, 𝑡) = 𝛥𝑐 ∑𝑁 𝑛𝑖(𝑡)
𝑖=1 𝜀𝑖(𝜆, 𝑡) × 𝑙 eq. 25
where Δc is the pump induced concentration change of the absorbing species in their ground states, ni(t) the normalized electronics population kinetics of states “i” accounting for all
species involved in the reaction εi(λ,t) is the time dependent extinction coefficient of state i
and “l” the path length of the sample’s cell. The sum runs over all states involved in or populated by the photo-reaction.
Fig. 7 : Scheme describing transient absorption technique
The different signal contributions appear as positive and negative signatures in TAS (fig.8b). Particularly, ground state bleach (GSB) corresponds to the depletion of the ground state’s population upon excitation of the sample. The concentration in the ground state when the pump is on, is decreased in comparison with the pump off. Thus, the result is a negative signal (blue shade) in the wavelength range of ground state absorption. In another case, stimulated emission (SE) corresponds to the transition from the first electronic state to the ground state. With the pump on, population in S1 increases and upon arrival of the probe
photons, photons from the excited population are emitted; in a way analogous to Einstein’s stimulated emission description for a two-level system. The increase of light in detection (negative extinction coefficient), will lead to the appearance of a negative signal (green shade) in TAS. The spectral shape of SE is analogous to the fluorescence emission and thus can be found at longer wavelengths in comparison with GSB due to shifts (i.e Stokes shift)12. Furthermore, excited state absorption (ESA) corresponds to allowed transitions from population of the first electronic state to higher electronic states. The concentration in the initial S1 state increases when the pump is on, in comparison with the absence of the pump,
resulting in a positive signal (red shade) at certain wavelength regions. Finally, upon excitation of a system (photochemical system or biological), is possible to form long lived molecular states or isomerized states (conformational change occurs), from where transitions to higher electronic states are allowed. The photo-induced absorption to these photo-product states, in a way analogous to ESA, is reflected as a positive TAS signal (orange shade) called photoproduct absorption (PA).
14
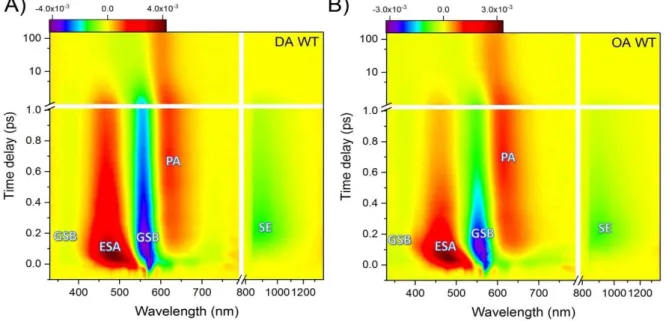
Fig. 8 : a) Electronic transitions observed by TAS shown with coloured arrows; The different signal contributions according to the electronic levels: GSB, ground state bleach; ESA, excited state absorption; SE, stimulated emission; PA, photoproduct absorption b) ΔΑ signal at t=270fs for Dark Adapted Wild Type ASR; The different signal contributions are shown with different color
2.2.2 Pump-probe setup
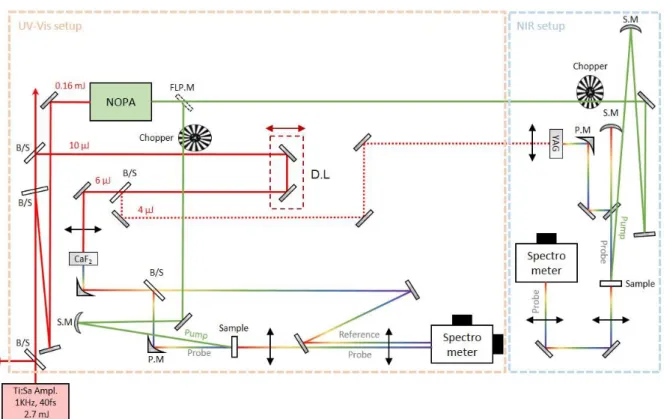
The overview of the TAS setup used in this thesis has been previously described by Gueye et al.13, with an application in vibrational coherent spectroscopy (VCS) demonstrated. However, an upgraded version of the experimental setup is shown here (fig.9) with a novel NIR spectrometer developed (dashed blue frame) and a NOPA serving as the excitation source (section 2.1.5). The latter allowed us to perform TAS on retinal proteins with the probing range spanning from UV to NIR (320nm-1400nm).
Briefly, the fundamental source is a Ti:sapphire amplified laser system, operating at 1kHz repetition rate, delivering 40fs pulses at 800nm. A portion of the fundamental ~0.2mJ, is used for the generation of pump and probe pulses. A first beam splitter (B/S) reflects ~0.16mJ used for seeding a NOPA. The output pulse can be used alternatively in the UV-Vis or in the NIR setups using a flip-mirror. The beam propagates through a chopper, working at 0.5 kHz, establishing continuously the pump-on and pump-off operation. The pump pulse is focuses at the sample’s position using a concave spherical mirror (S.M). A second B/S reflects ~10μJ of the 800nm fundamental, used for the generation of the probe pulses in the UV-Vis and NIR setups. After propagation through a motorized optical delay line (D.L) a third B/S (60:40 ratio), splits the beam between the UV-Vis and NIR setups. In the case of the UV-Vis setup the beam focuses on a 2mm thick calcium fluoride crystal (CaF2), while in the NIR setup on a
4mm thick yttrium aluminum garnet crystal (YAG). In both cases, the WL generated (section 2.1.4) is re-collimated using parabolic mirrors (P.M). Afterwards the probe pulse focuses at sample’s position using a P.M (UV-Vis setup) or using a concave mirror (NIR setup) as shown in the scheme. Finally, after re-collimation of the probe beam using a lens, the beam propagates and refocuses on the vertical slit of a spectrometer. In both cases, the probe beams are dispersed and imaged on CCD sensors (UV-Vis) or on 1D-diode array (NIR). To allow almost no loss of UV photons in detection, the role of the dispersive element in the UV-Vis spectrometer is played by a prism.
15
Fig. 9 : Scheme describing the transient absorption setups for UV-Visible (in orange dashed frame) and NIR range (in light blue frame)
2.2.3 Balanced detection – Sensitivity
The use of a CaF2 crystal for WLG gives the opportunity to have probe photons in the UV
region, but unlikely suffers due to thermal effects introduced by the intense focused beam. To avoid these effects, the crystal is mounted on a moving loudspeaker which allows vertical displacements ~1-2mm (at 1Hz frequency). In addition, to increase the WL stability referenced (balanced) detection is used. The reference beam is obtained by using a metallic neutral density filter OD=0.3 at 60°, which acts as a beam splitter producing an identical pulse such as the probe (intensity and spectrum). Then, this reference pulse is also focused on the slit of the spectrometer with a very small vertical angle with respect to the probe, imaged afterwards on a separate CCD sensor. In this way, correction for WL fluctuations is obtained, resulting in noise reduction during the measurement. The expression for ΔΑ(λ,t) is
∆𝐴(𝜆, 𝑡) = − 𝑙𝑜𝑔10( 𝐼𝑤 (𝜆,𝑡) 𝐼𝑤/𝑜 (𝜆,𝑡)) (
𝐼𝑟𝑒𝑓𝑤/𝑜 (𝜆,𝑡)
𝐼𝑟𝑒𝑓𝑤 (𝜆,𝑡) ) eq. 26
where the indices refw and refw/o correspond to the reference intensity with and without pump.
Referencing allows a flatter noise distribution along the probe wavelengths spanning from UV (320nm) to NIR (840nm) as shown in fig.10a. In the case of the UV-Vis setup the shot-noise (dashed-red line) is limited to 1.4x10⁻³ resulting from the use of two sensors for detection13, with the pulse to pulse fluctuations (PtP) reaching the level of 2x10⁻³ for a sampling over 1000 pulses. An example which documents the sensitivity of the setup is shown in fig.10b, for a kinetic trace probed at 600nm. The signal at negative delays (orange line in the inset) has a standard deviation (Stdv) of <20x10-6 for an average of 2500 differential spectra.
Supplementary, fig.10a shows the shot-noise and PtP rms noise for the NIR setup where referencing is not used (black dashed and solid lines). The shot-noise there is limited to 1x10
-16 3 while the PtP rms reaches 1.5x10⁻³ for 950nm. Even without referencing, is possible to have
PtP rms < 4x10⁻³ for a 400nm range, spanning from 850nm-1250nm, which is the probing region of interest of the samples under study. Analogous to the UV-Vis setup, the sensitivity of this setup is demonstrated in fig.10b, showing similar statistics Stdv<20x10-6 for 910nm probing.
Fig. 10 : a) Balanced and unbalanced detection for UV-Vis and NIR setup respectively; Shot-noise is shown with dashed lines; PtP rms over 1000pulses shown with solid lines; WL for each probing region shown with transparent thick lines b) Kinetic traces at negative time delays demonstrate the sensitivity of the setups; kinetic traces from the UV-Vis (orange line) and NIR (blue line) setups respectively, show a Stdv <20x10-6 after an average of 2500 differential spectra (5s acquisition time)
2.2.4 Artefacts in TAS
After the collection of the raw experimental data, a treatment is needed to avoid unwanted contributions present due to the interaction of pump and probe pulses in the sample. Lorenc et al.14 documented the latter, encoded in a form called “artefacts” in TAS. Here we will refer to two-photon absorption (TPA), stimulated Raman amplification (SRA) and cross-phase modulation (XPM) contributions.
The first artefact is observed when a photon from the pump and a photon from the probe are simultaneously absorbed, resulting in TPA. The amplitude the TPA signal is power dependent and is present mainly in organic solvents upon UV-Vis excitation (250nm-430nm). The second unwanted contribution is SRA present when the pump wavelength is located close to the probe’s wavelength. In this case, the Raman amplification which is a nonlinear process, couples pump and probe beams at Stokes and anti-Stokes frequencies, through material excitation. As a result, an increase/decrease in the differential signal occurs shifted in energy according to the molecular oscillation energy in the medium. An example is shown in fig.11a, where the solvent used is water and the pump pulse is centred at 535nm. The –OH stretching mode of water leads to the appearance of an increased differential signal located at 453nm, 3435cm-1 shifted with respect to pump’s energy, in line with –OH frequency. Finally, in the case where a broadband pulse is used for probing (such as a supercontinuum), the probe pulse experiences a time depended modulation of the refractive index of the medium (eq.5), due to the much higher intensity of the pump pulse. Thus, the spectral distribution of the probe pulse is modified and gives rise to unwanted signal around time zero eq.27, where L is the medium thickness, ω0 the probe’s central frequency and A(t) the amplitude of the