HAL Id: hal-00296233
https://hal.archives-ouvertes.fr/hal-00296233
Submitted on 21 May 2007
HAL is a multi-disciplinary open access
archive for the deposit and dissemination of
sci-entific research documents, whether they are
pub-lished or not. The documents may come from
teaching and research institutions in France or
abroad, or from public or private research centers.
L’archive ouverte pluridisciplinaire HAL, est
destinée au dépôt et à la diffusion de documents
scientifiques de niveau recherche, publiés ou non,
émanant des établissements d’enseignement et de
recherche français ou étrangers, des laboratoires
publics ou privés.
A study on natural and manmade global interannual
fluctuations of cirrus cloud cover for the period
1984?2004
K. Eleftheratos, C. S. Zerefos, P. Zanis, D. S. Balis, G. Tselioudis, K. Gierens,
R. Sausen
To cite this version:
K. Eleftheratos, C. S. Zerefos, P. Zanis, D. S. Balis, G. Tselioudis, et al.. A study on natural and
manmade global interannual fluctuations of cirrus cloud cover for the period 1984?2004. Atmospheric
Chemistry and Physics, European Geosciences Union, 2007, 7 (10), pp.2631-2642. �hal-00296233�
www.atmos-chem-phys.net/7/2631/2007/ © Author(s) 2007. This work is licensed under a Creative Commons License.
Chemistry
and Physics
A study on natural and manmade global interannual fluctuations of
cirrus cloud cover for the period 1984–2004
K. Eleftheratos1,2, C. S. Zerefos1,2,3, P. Zanis4, D. S. Balis5, G. Tselioudis6, K. Gierens7, and R. Sausen7
1Laboratory of Climatology & Atmospheric Environment, University of Athens, Greece 2Foundation for Biomedical Research, Academy of Athens, Greece
3National Observatory of Athens, Greece
4Department of Meteorology and Climatology, Aristotle University of Thessaloniki, Greece 5Laboratory of Atmospheric Physics, Aristotle University of Thessaloniki, Greece
6Goddard Institute for Space Studies, National Aeronautics and Space Administration, USA 7Institute of Atmospheric Physics, DLR, Germany
Received: 17 November 2006 – Published in Atmos. Chem. Phys. Discuss.: 5 January 2007 Revised: 5 April 2007 – Accepted: 4 May 2007 – Published: 21 May 2007
Abstract. The seasonal variability and the interannual
vari-ance explained by ENSO and NAO to cirrus cloud cover (CCC) are examined during the twenty-year period 1984– 2004. CCC was found to be significantly correlated with ver-tical velocities and relative humidity from ECMWF/ERA40 in the tropics (correlations up to −0.7 and +0.7 at some loca-tions, respectively) suggesting that variations in large-scale vertical winds and relative humidity fields can be the ori-gin of up to half of the local variability in CCC over these regions. These correlations reflect mostly the seasonal cy-cle. Although the annual cycle is dominant in all latitudes and longitudes, peaking over the tropics and subtropics, its amplitude can be exceeded during strong El Nino/La Nina events. Over the eastern tropical Pacific Ocean the interan-nual variance of CCC which can be explained by ENSO is about 6.8% and it is ∼2.3 times larger than the amplitude of the annual cycle. Natural long-term trends in the tropics are generally small (about −0.3% cloud cover per decade) and possible manmade trends in those regions are also small. The contributions of NAO and QBO to the variance of CCC in the tropics are also small. In the northern mid-latitudes, on the other hand, the effect of NAO is more significant and can be very important regionally. Over northern Europe and the eastern part of the North Atlantic Flight Corridor (NAFC) there is a small positive correlation between CCC and NAO index during the wintertime of about 0.3. In this region, the interannual variance of CCC explained by NAO is 2.6% and the amplitude of the annual cycle is 3.1%. Long-term trends
Correspondence to: K. Eleftheratos
(kelef@geol.uoa.gr)
over this region are about +1.6% cloud cover per decade and compare well with the observed manmade trends over con-gested air traffic regions in Europe and the North Atlantic as have been evidenced from earlier findings.
1 Introduction
Large-scale natural fluctuations such as the El Nino/Southern Oscillation (ENSO) and North Atlantic Oscillation (NAO) are known to alter the distribution and natural variability of various atmospheric parameters (i.e. temperature, precipita-tion) including cloudiness. Their impact, however, on the natural variability of cirrus clouds is less well quantified and much less it is known about the relative roles of long-term manmade (aviation) trends and natural variability.
Cirrus clouds are optically thin and non-black high, cold clouds composed of ice crystals. Along with low marine stra-tus clouds, they are the principal cloud type controlling the Earth’s radiation budget (Lynch, 1996). Thin cirrus clouds are of significant climatological importance because they produce net heating of the planet. The relatively large parti-cles efficiently scatter sunlight into the forward (downward) direction and thus do not prevent sunlight from reaching the Earth. In the thermal infrared, ice is highly absorptive (and thus highly emissive) and it reradiates part of the energy it receives from the Earth back to the planet (Lynch, 1996).
The distribution of cirrus clouds in the upper troposphere has been examined mainly by satellite observations, which provide global coverage (Liou, 1986; Woodbury and Mc-Cormick, 1986; Wang et al., 1996; Wylie and Menzel, 1999;
Sandor et al., 2000; Sassen and Campbell, 2001; Dessler and Yang, 2003; Bourassa et al., 2005; Chen and Liu, 2005). In the tropics, active tropical cumulonimbus clouds transport large amounts of ice water to the upper troposphere and gen-erate extensive cirrus outflow anvils. Ice crystals can also be generated in situ by slow, synoptic scale uplift of a hu-mid layer (Jensen et al., 1996). At hu-mid-latitudes their for-mation is linked to synoptic and frontal weather systems (Sassen and Campbell, 2001). Mid-latitude cirrus clouds form in ice-supersaturated regions (ISSRs, Gierens et al., 1999, 2000) the global distribution of which has been de-scribed by Spichtinger et al. (2003).
Previous studies examining the effects of El Nino on up-per tropospheric cirrus have based their results on observa-tions by satellites from space (Wang et al., 1996; Mergen-thaler et al., 1999; Sandor et al., 2000; Massie et al., 2000; Cess et al. 2001). Massie et al. (2000) analysed geographi-cal distributions of aerosol extinction data in the troposphere and stratosphere for 1993–1998 from the Halogen Occulta-tion Experiment (HALOE) and showed that during El Nino conditions of 1997 upper tropospheric cirrus increased over the mid-Pacific and decreased over Indonesia. Longitudinal centroids of cirrus in the Pacific and over Indonesia shifted eastward by 25◦in the troposphere in 1997 whereas longi-tudinal centroids of aerosol in the lower stratosphere did not exhibit longitudinal shifts in 1997, indicating that the effects of El Nino upon equatorial particle distributions are confined to the troposphere. More recently, Wang et al. (2003) exam-ined the characteristics of cloud distributions with empha-sis on cloud longwave radiative forcing during the peak of the 1997/1998 El Nino in relation to climatological condi-tions, based on SAGE II measurements. Their results indi-cated above-normal high-altitude opaque cloud occurrence over the eastern tropical Pacific and an opposite situation over the Pacific warm pool, generally consistent with the pat-tern of the tropical sea surface temperature and precipitation anomalies. A similar behavior was also noticed in the distri-bution of subvisual clouds near the tropical tropopause.
In the present study we calculate the percent of the inter-annual variance of CCC, caused by ENSO, NAO and long-term trends. The results are also compared with observed long-term trends in CCC over congested air traffic regions in Europe and the North Atlantic (Zerefos et al., 2003; Stordal et al., 2005; Stubenrauch and Schumann, 2005) to evaluate the significance of the anthropogenic (aviation) effect with respect to the natural variability. To account for dynamical and thermo-dynamical influences on CCC variability, cirrus cloud averages have been studied in relation to large-scale meteorological parameters such as vertical velocities and rel-ative humidity.
It is important to note the objective of this analysis and how it is different from previous such works. Why is it im-portant to know the scales of variability of cirrus clouds? It should be also pointed out that now we have available more than two decades of cloud cover from ISCCP that include
several ENSO and NAO cycles. This along with the avail-ability of detailed atmospheric conditions data from the re-analyses products allows us for the first time to conduct a complete study of the time and space scales of variability of cirrus cloud cover along with an analysis of the dynamic and thermodynamic influences on the cirrus cloud cover. The availability of this long dataset and the completeness of the analysed time and space scales and dependencies distinguish this work from previous ones.
2 Data sources and methodology
The cloud data set analysed in this study was produced by the International Satellite Cloud Climatology Project (ISCCP) (Rossow and Schiffer, 1991; Rossow et al., 1996). The latest available (D2) version of the data set used in this study has a spatial resolution of 280 km (2.5◦at the equator) and covers the period 1984–2004. The data set provides monthly aver-ages of cloud properties of fifteen different cloud types based on radiometric definitions that rely on cloud optical thickness and cloud top pressure. Use was made of the equal-angle map grid of D2 version which has equal 2.5◦increments in
latitude and longitude providing data at latitudes from −90◦
to 90◦and longitudes from 0◦to 360◦(positive eastward). In
the ISCCP D2 satellite cloud dataset, cirrus clouds are de-fined as those with optical thickness less than 3.6 and cloud top pressure less than 440 mb. High cloud amounts from this data set have been compared with those from SAGE II (Liao et al., 1995) and have been recently used in several contrail-cirrus-climate studies (Zerefos et al., 2003; Minnis et al., 2004; Stordal et al., 2005). In order to avoid artificial satel-lite cloud retrievals after the Mt. Pinatubo eruption in 1991 (Rossow and Schiffer, 1999; Luo et al., 2002) cirrus cloud data taken in 1991 and 1992 were not used in our analysis.
To examine the consistency of the ISCCP data we also analysed vertical velocities and relative humidity at 300 hPa from the ECMWF/ERA40 Reanalysis datasets (http://data. ecmwf.int/data/d/era40 moda/). The level of 300 hPa was selected in this study as a compromise for an upper tropo-spheric level for both the tropics and the middle and the high latitudes. However, we have looked also at 200 hPa for the tropics. ERA40 data contain daily and monthly averages of various natural parameters at the surface and at various pres-sure levels from September 1957 to August 2002. Data are provided on 2.5◦×2.5◦ grid boxes at latitudes from 90◦ to −90◦and longitudes from 0◦to 360◦(positive eastward). In order to be as close as possible to the ISCCP data we made use of ERA40 data for the period 1984–2001. For brevity, the terms VV300 and RH300 were used to indicate the vertical velocities and relative humidity at 300 hPa.
Cirrus cloud amounts from ISCCP were correlated with vertical velocities from ERA40 based on a simple regression statistical model:
Where i denotes the month and j is the year of the examined variables, a is the slope and b is the intercept of the regres-sion model. Equation (1) was also used for the calculation of correlation coefficients between CCC and RH300. The cor-relation analysis between the examined parameters was per-formed at each individual grid box 2.5◦×2.5◦from January 1984 to December 2001 (data points, N=216). The effect of ENSO on cirrus clouds has been examined by linear regres-sion analysis between monthly mean CCC and Southern Os-cillation Index (SOI) in the examined 21-years period, using the model described in Eq. (1). The occurrence of decadal-scale changes in cloud frequency in the tropics (Wang et al., 2002) could affect our correlation analysis if they were not taken into account. In order to avoid possible effects from decadal changes in cloud occurrence in the tropics, we first removed from cirrus coverage variability related to the sea-sonal cycle and long-term trends for the period 1984–2004 based on the following regression model:
CCC(i, j ) = S(i, j ) + T (i, j ) + residuals (2)
Where i denotes the month and j is the year of CCC and its components, i.e. the seasonal (S) and the long-term trend (T) as described by Zerefos et al. (1994). The deseasonal-ized time series of CCC at each grid box was calculated by subtracting from each individual monthly value the overall mean monthly value for the whole period 1984–2004. The trend component was removed with linear regression analy-sis which was applied at each grid box between the deseason-alized time series of CCC and the time. The residuals from Eq. (2) were used as input for the correlation analysis be-tween the anomalies of CCC and SOI. SOI was provided by the Bureau of Meteorology of the Australian Government at http://www.bom.gov.au/climate/current/soi2.shtml. The cor-relation between CCC and NAO index has been computed for the winter months (December, January and February) over Europe and the North Atlantic. The NAO index was provided by the Climate Analysis Section at http://www.cgd.ucar.edu/ cas/jhurrell/indices.html. The results from the correlation analyses are described in Sects. 3.2 and 3.3. In Sect. 3.1 we provide a short overview of the basic climatological charac-teristics of cirrus clouds from the ISCCP dataset on which we base all the analysis.
3 Results and discussion
3.1 Climatological characteristics of cirrus clouds
Figure 1 shows the global distribution of annual mean CCC from ISCCP for the period 1984–2004. In general, the geographical features of CCC from ISCCP are consistent with those published in earlier studies (Woodbury and Mc-Cormick, 1986; Wang et al., 1996; Wylie and Menzel, 1999; Bourassa et al., 2005). More analytically, the region bounded by latitudes 20◦N–20◦S and by longitudes 60◦E–170◦W is
-180 -120 -60 0 60 120 180 -90 -60 -30 0 30 60 90 0.0 2.5 5.0 7.5 10.0 12.5 15.0 17.5 20.0 22.5 25.0 27.5 30.0
Fig. 1. Global map of annual mean CCC from 1984 to 2004 by
ISCCP (in % cloud cover).
the area of the Earth covered by the largest amounts of cir-rus clouds. Their generation over this region is associated with two important features of the general circulation, the Walker circulation along the equator and the Monsoon wind system in Southeast Asia. High cirrus amounts are also ob-served over the South Pacific Convergence Zone, the Ama-zon area and central Africa as a result of strong upward air motions and high amounts of upper tropospheric humidity. At latitudes near 30◦, the existence of subtropical high pres-sure belts limits the formation of cirrus clouds and therefore CCC over the subtropical zones is significantly lower than over the tropics. More specifically, low amounts of cirrus are found over extensive ocean regions, i.e. off the western coasts of South America and South Africa while in the north-ern subtropics low CCC is found over the Pacific Ocean off the western coasts of North America, the Saharan desert and the Arabian Peninsula.
As we move to higher latitudes, cirrus clouds concentrate over regions with highland climate (group H in K¨oppen’s cli-matic classification system), i.e. the high mountain chains of the Rocky and Appalachian Mountains in North America, the southern part of the Andes in South America, the Himalayas and the Tibetan Plateau in Asia. Although not apparent from Fig. 1, these are mainly orographically induced cirrus clouds (the spatial scales of the vertical air motions are not resolved in the ERA40 data). The large amounts of cirrus clouds over the Tibetan Plateau, which occurs from March to April, is believed to be generated by relatively warm and moist air be-ing slowly lifted over a large area by an approachbe-ing cold front and topographic lifting (Chen and Liu, 2005). In addi-tion, the high amounts of cirrus over the greater area of Asia could be related to the formation of the Tibetan low pressure cell during the summer. Apart from orographic generation of cirrus wave clouds because of the mountainous terrains, nat-ural cirrus cloud formation over the northern mid-latitudes is also related to synoptic and meso-scale weather patterns such as movements of jet streams and frontal systems (Sassen and
-180 -120 -60 0 60 120 180 -90 -60 -30 0 30 60 90 -70.0 -50.0 -40.0 -30.0 -20.0 -10.0 0.0 10.0 20.0 30.0 40.0 50.0 70.0 -180 -120 -60 0 60 120 180 -90 -60 -30 0 30 60 90 0.0 7.5 15.0 22.5 30.0 37.5 45.0 52.5 60.0 67.5 75.0 82.5 90.0
Fig. 2. (a) Global map of annual mean VV300 from 1984 to 2001
by ECMWF/ERA40 (in mPa/s). The negative and the positive val-ues indicate the upward and the downward air motions respectively. The more negative (positive) the value is, the more upward (down-ward) the air motion. (b) Same as (a) but for the annual mean RH300 (in %).
Cambell, 2001). Meso-scale gravity waves may also gener-ate ice-supersaturgener-ated regions due to lifting of air masses and trigger the formation of optically thick natural cirrus clouds (Spichtinger et al., 2005). In the middle and high latitudes of the Southern Hemisphere where most of the surface is cov-ered by water, there are low amounts of cirrus over the entire zones.
Apart from their natural formation, cirrus cloud formation over the high air traffic northern mid-latitudes is also related to anthropogenic sources such as aviation activities (Zerefos et al., 2003; Minnis et al., 2004; Stordal et al., 2005; Stuben-rauch and Schumann, 2005). Air traffic may contribute to high-level cloudiness by producing contrails (direct effect), which can then be transformed into contrail-cirrus clouds, or indirectly, by emitting soot and other particles which can stay in the atmosphere and get involved in cloud formation processes (Lohmann and Feichter, 2005; Sausen et al., 2005; Schumann, 2005). However, in the tropics it is difficult to de-tect possible effects of regional persistent contrails on cirrus cloud trends. This is because trends in dynamics and
thermo-dynamics mask possible man-made trends in cirrus clouds in those regions. Taking also into account that flight frequen-cies and fuel consumption are moderate over the tropical air traffic corridors, it makes it even more difficult to detect and quantify any possible anthropogenic effects (Zerefos et al., 2007).
3.2 Comparison with large-scale meteorological parame-ters
The corresponding distributions of annual mean VV300 and annual mean RH300 from ECMWF/ERA40 are shown in Figs. 2a and b. In the vertical velocities map (Fig. 2a), the negative values indicate the upward air motions and the pos-itive values indicate downward air motions. Regions shown by blue and dark blue colors are regions where we usually find strong upward air motions, while regions shown by red and dark red colors are regions where we usually find strong downward air motions. As can be seen from Figs. 1 and 2, there are consistent similarities between the geographical distributions of CCC, VV300 and RH300, indicating the ex-istence of strong links of cirrus clouds with dynamical pa-rameters. It also appears that natural cirrus clouds are prefer-ably formed along major atmospheric circulation cells.
In regions with downward air motions and low relative hu-midity CCC is lower while over regions with upward air mo-tions and high relative humidity CCC is higher. This sug-gests that over these regions the formation of cirrus clouds is related to the formation of deep convective cloud systems and therefore to convective activity. In order to better under-stand the relations between CCC, VV300 and RH300, Fig. 3a shows the correlation coefficients, R, between monthly mean CCC and monthly mean VV300 from January 1984 to De-cember 2001 in each map grid box and Fig. 3b shows the re-spective R between CCC and RH300. From Fig. 3a it appears that the highest correlations between CCC and VV300 are found in the tropics and subtropics (30◦N–30◦S). At some locations there is a R2=0.5 coefficient of determination be-tween the large-scale vertical velocity field and CCC which means that variations in the large-scale vertical velocity field are the origin of up to half of the local variability in CCC. The remaining variability can probably be explained by un-resolved dynamics (meso-scale and micro-scale), and unre-solved variations in the humidity, temperature, and aerosol fields. Also, cirrus clouds detached from the convective ac-tivity contribute to the remaining variability. At the level of 200 hPa in the tropics and subtropics the respective correla-tion coefficients between cirrus clouds and vertical velocities are similar to those observed in Fig. 3a. In the mid-latitudes on the other hand, where the correlation coefficients are lower, the formation of cirrus clouds is less related to large-scale convection and more affected by synoptic and meso-scale systems. In such systems, cirrus clouds are formed in pre-frontal regimes with weak dynamic forcings and are not well correlated with the large scale baroclinic updrafts.
In addition, they often occur in combination with low level clouds and, due to the resulting mid-tropospheric thermal emission level, are classified as middle level clouds by IS-CCP (Tselioudis and Jakob, 2002). The lower correlation in the mid-latitudes is probably also due to higher influence of unresolved dynamics (i.e. gravity waves, meso-scale influ-ence), and potentially also due to a larger importance of het-erogeneous nucleation processes in the polluted air masses of the northern mid-latitudes (Gierens et al., 2000).
A significant part of the correlations in Fig. 3 could be attributed to the seasonal cycle of the examined parameters which is quite distinct. Figure 4 shows the seasonal varia-tions of zonal mean CCC averaged for the period 1984–2004 as well as of VV300 and RH300 averaged for the period 1984–2001. From Fig. 4 it appears that there is high correla-tion between the seasonal cycles of the examined parameters, indicated by their close seasonal match. As it was previously discussed, the higher correlations are found in the tropics (30◦N–30◦S) comprising about 50% of the Earth’s surface. Most obvious is the northward movement of the Hadley cir-culation cell during June, July and August. In boreal spring and summer there are higher amounts of CCC in the tropics as compared to the winter due to stronger upward air motions and higher relative humidity resulting from the Asian Mon-soon. Over the subtropics, there are lower amounts of CCC due to dominating downward motions of air masses. Over middle and high latitudes where CCC is less correlated to large-scale vertical velocities the seasonal variations do not exhibit consistent patterns except for a Northern Hemisphere winter maximum.
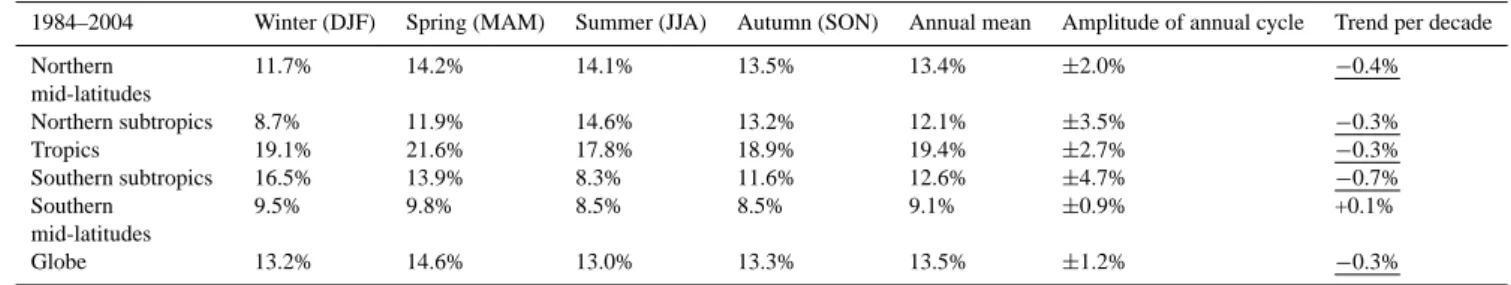
Table 1 summarizes the seasonal and annual average amounts of CCC for the period 1984–2004 over six lat-itudinal belts: the northern mid-latitudes (30◦N–60◦N),
the northern subtropics (15◦N–30◦N), the tropics (15◦N– 15◦S), the southern subtropics (15◦S–30◦S), the southern mid-latitudes (30◦S–60◦S) and the global region (60◦N– 60◦S). As can be seen from Table 1, the highest amounts of cirrus clouds are found over the tropical deep convective areas in all seasons. In the tropics, the annual mean cirrus coverage (according to ISCCP) is about 20% and the ampli-tude of the annual cycle is ∼2.7%. The lowest and highest coverage in the tropics is about 18% and 22%, correspond-ing to the summertime and sprcorrespond-ingtime averages, respectively. Over the northern and the southern subtropics CCC averages to about 12% annually and the amplitudes of the annual cy-cle are about 3.5% and 4.7% respectively. Over the northern mid-latitudes CCC can range from about 12% in winter to about 14% in spring. The lowest amounts of CCC in all sea-sons are found over the oceans of the southern mid-latitudes. Globally (60◦N–60◦S), cirrus clouds cover about 14% of the Earth’s upper troposphere (ISCCP 1984–2004 annual aver-age) and the amplitude of the annual cycle is about 1.2%. Table 1 also shows the long-term changes in CCC from Jan-uary 1984 to December 2004 over the examined regions af-ter removing the annual cycle. According to ISCCP, cirrus
-180 -120 -60 0 60 120 180 -90 -60 -30 0 30 60 90 -0.8 -0.5 -0.4 -0.3 -0.2 -0.1 0.0 0.1 0.2 0.3 0.4 0.5 0.8 -180 -120 -60 0 60 120 180 -90 -60 -30 0 30 60 90 -0.8 -0.5 -0.4 -0.3 -0.2 -0.1 0.0 0.1 0.2 0.3 0.4 0.5 0.8
Fig. 3. (a) Global map of correlation coefficients between monthly
mean CCC and monthly mean VV300 from January 1984 to De-cember 2001. Only correlation coefficients above/below ±0.3 are shown. The highest correlations between cirrus clouds and large-scale vertical velocities (up to −0.7 at some locations) are found in the tropics. (b) Same as (a) but between CCC and RH300.
clouds tend to decrease everywhere in the globe except over the southern mid-latitudes where no trends are observed.
It should be noted that the average cirrus amounts, which are shown in Table 1, depend on the satellite instrument used to obtain the cirrus data and the thresholds that are used to de-fine cirrus clouds. Therefore different satellite climatologies can provide different cirrus cloud amounts. The frequency of all high-level clouds from SAGE II, for example, is about 3 times higher than the cloud amount from ISCCP with lit-tle seasonal variation (Liao et al., 1995). However, despite this large systematic difference, both datasets showed similar large-scale relative variations with latitude, which strength-ens our findings (correlation between the zonal mean curves was high, 0.88 (99.99% confidence level) for July and 0.82 (99.99% confidence level) for January).
3.3 Natural fluctuations of cirrus clouds
Although the annual cycle is dominant in all latitudes and longitudes, peaking over the tropics and subtropics, its
-50 -40 -30 -20 -10 0 10 20 30 40 50 0.0 2.5 5.0 7.5 10.0 12.5 15.0 17.5 20.0 22.5 25.0 27.5 30.0 D D J F M A M J J A S O N -50 -40 -30 -20 -10 0 10 20 30 40 50 -70.0 -50.0 -40.0 -30.0 -20.0 -10.0 0.0 10.0 20.0 30.0 40.0 50.0 70.0 D D J F M A M J J A S O N -50 -40 -30 -20 -10 0 10 20 30 40 50 0.0 7.5 15.0 22.5 30.0 37.5 45.0 52.5 60.0 67.5 75.0 82.5 90.0 D D J F M A M J J A S O N 0% 2% 4% 6% 8% 10% -50 -40 -30 -20 -10 0 10 20 30 40 50 Amplitude of annual cycle of CCC (in % cloud cover)
Fig. 4. (a) Seasonal variations of zonal mean CCC (in % cloud cover) averaged for the period 1984–2004. (b) Same as (a) but for VV300 (in
mPa/s) averaged for the period 1984–2001. (c) Same as (b) but for RH300 (in %). (d) Amplitude of annual cycle of CCC (in % cloud cover) at each latitudinal belt (2.5◦).
amplitude can be exceeded under circumstances of strong El Nino/La Nina events. After removing from the time se-ries of cirrus coverage the variability related to the seasonal cycle and long-term trends, ENSO signals become domi-nant over the eastern and western tropical Pacific Ocean, de-termining a significant part of the cirrus cloud interannual natural variability. Figure 5 shows the correlation coeffi-cients between the deseasonalized and detrended time series of CCC and SOI from 60◦N to 60◦S. As can be seen from
Fig. 5, the strongest correlations between the two variables are found in the tropical Pacific. Negative correlation sug-gests large amounts of thin cirrus clouds during warm (El Nino) episodes and positive correlation their absence. More analytically, Fig. 6 shows the deseasonalized and detrended time series of CCC from 1984 to 2004 versus SOI over (a) the eastern tropical Pacific region (10◦S–10◦N, 80◦W–180◦W) and (b) the western tropical Pacific region (10◦S–10◦N, 80◦E–150◦E). From Fig. 6 it appears that CCC is strongly
Table 1. Seasonal and annual mean CCC (in % cloud cover) in ISCCP D2 data from January 1984 to December 2004 over the northern
mid-latitudes (30◦N–60◦N), the northern subtropics (15◦N–30◦N), the tropics (15◦N–15◦S), the southern subtropics (15◦S–30◦S), the southern mid-latitudes (30◦S–60◦S) and the global region (60◦N–60◦S). The amplitude of the annual cycle of CCC is in % cloud cover. Long-term trends are in % cloud cover per decade. Underlined long-term trends are statistically significant at the 95% confidence level.
1984–2004 Winter (DJF) Spring (MAM) Summer (JJA) Autumn (SON) Annual mean Amplitude of annual cycle Trend per decade Northern mid-latitudes 11.7% 14.2% 14.1% 13.5% 13.4% ±2.0% −0.4% Northern subtropics 8.7% 11.9% 14.6% 13.2% 12.1% ±3.5% −0.3% Tropics 19.1% 21.6% 17.8% 18.9% 19.4% ±2.7% −0.3% Southern subtropics 16.5% 13.9% 8.3% 11.6% 12.6% ±4.7% −0.7% Southern mid-latitudes 9.5% 9.8% 8.5% 8.5% 9.1% ±0.9% +0.1% Globe 13.2% 14.6% 13.0% 13.3% 13.5% ±1.2% −0.3% -180 -120 -60 0 60 120 180 -60 -30 0 30 60 -0.8 -0.5 -0.4 -0.3 -0.2 -0.1 0 0.1 0.2 0.3 0.4 0.5 0.8
Fig. 5. Correlation coefficients between the deseasonalized and
de-trended time series of CCC and SOI from January 1984 to Decem-ber 2004 in the region (60◦N–60◦S). Only correlation coefficients above/below ±0.3 are shown. The highest correlations are found over the tropical Pacific Ocean. Rectangles show the regions in east-ern and westeast-ern Pacific in which cirrus cloud averages have been studied.
anti-correlated with SOI over eastern Pacific (R=−0.7) and positively correlated (R=+0.6) over its western part, which practically confirms the correlation map of Fig. 5. The two correlation coefficients are statistically significant at the 99% confidence level and suggest that southern oscillation and its associated events (warm and cold) play key roles in the dis-tribution and appearance of thin cirrus clouds over these lo-cations, explaining about one third to half of their large-scale natural variability.
The percent of the interannual variance of CCC explained by ENSO over the two locations was investigated by recon-structing the time series of CCC from SOI, based on the fol-lowing linear regression model:
a × SOI(i, j ) + b = reconstructed CCC (ij ) (3)
Where a is the slope and b is the intercept of the correlation analysis between the deseasonalized and detrended time se-ries of CCC and SOI. The reconstructed time sese-ries of CCC at the two locations is shown in Fig. 6 by the lines with grey colour. The annual mean CCC, the amplitude of the annual cycle, the interannual variance explained by ENSO, and the
1984 1988 1992 1996 2000 2004 -10 0 10 -20 0 20 -10 0 10 -20 0 20 E. Pacific (10S-10N, 80-180W) W. Pacific (10S-10N, 80-150E) R= -0.7 (99%) R= +0.6 (99%) C C C a n o m a li e s SO I Fig. 6a Fig. 6b Anomalies of CCC (in % cloud cover)
Reconstructed CCC from SOI SOI
Fig. 6. (a) Time series of deseasonalized and detrended CCC from
1984 to 2004 and of SOI over the eastern tropical Pacific region (10◦S–10◦N, 80◦W–180◦W). (b) Same as (a) but for the west-ern tropical Pacific region (10◦S–10◦N, 80◦E–150◦E). R is the correlation coefficient between the two lines. Values in brackets re-fer to statistical significance of R. With grey colour is shown the reconstructed time series of CCC from SOI at the two locations, in-dicating the interannual variance of CCC explained by ENSO (in % cloud cover).
long-term trends of CCC over the studied regions are sum-marised in Table 2a. As can be seen from Table 2a, over the eastern tropical Pacific Ocean the annual mean CCC is 12.5% and the amplitude of the annual cycle is 3%. This means that CCC can range between 15.5% and 9.5%. However, this am-plitude can be exceeded during strong ENSO episodes. For example during El Nino 1986/87, La Nina 1988/89 and El Nino 1997/98 (Fig. 6), the interannual variance of CCC ex-plained by ENSO is 6.8% and it is about 2.3 times larger than the amplitude of the annual cycle. Accordingly, over
1984 1988 1992 1996 2000 2004 -20 0 20 -20 0 20 -20 0 20 -20 0 20 E. Pacific (10S-10N, 80-180W) W. Pacific (10S-10N, 80-150E) R= +0.7 (99%) R= -0.6 (99%) V V 3 0 0 a n o m a li e s SO I Fig. 7a Fig. 7b Anomalies of VVEL300 (in mPa/s)
Reconstructed VV300 from SOI SOI
Fig. 7. (a) Time series of deseasonalized and detrended VV300
from 1984 to 2001 and of SOI over the eastern tropical Pacific region (10◦S–10◦N, 80◦W–180◦W). (b) Same as (a) but for the western tropical Pacific region (10◦S–10◦N, 80◦E–150◦E). R is the correlation coefficient between the two lines. Values in brackets refer to statistical significance of R. With grey colour is shown the reconstructed time series of VV300 from SOI at the two locations, indicating the interannual variance of VV300 explained by ENSO (in mPa/s).
the western part of the tropical Pacific the interannual vari-ance of CCC explained by ENSO is 5.9%, which is about 2.4 times larger than the amplitude of the annual cycle.
In order to further understand the altered equatorial CCC during Southern Oscillation episodes we also examined the correlations of the deseasonalized and detrended time series of VV300 with SOI (Fig. 7). As can be seen from Fig. 7, the correlation coefficients between the two variables over the examined locations are similar in magnitude with those observed in Fig. 6 but with opposite signs. The positive cor-relation in Fig. 7a suggests increased rising of warm moist air over the eastern tropical Pacific during El Nino and therefore enhanced convective activity in the area, whereas the nega-tive correlation in Fig. 7b indicates sinking air motion over its western part and therefore reduced convection during El Nino. This circulation was responsible for the observed vari-ability of natural cirrus clouds in Fig. 6. For example, dur-ing El Nino 1997/98 CCC increased by more than 10% over the eastern tropical Pacific due to enhanced convective activ-ity, whereas reduced convective activity over its western part caused comparable decreases in agreement with the findings of earlier studies (Massie et al., 2000; Cess et al., 2001; Wang et al., 2003). The contribution of ENSO to the interannual variance of VV300 at the two regions is shown in Fig. 7 by the lines with grey colour. As a further illustration of the
im--120 -80 -40 0 40 80 15 30 45 60 -0.8 -0.5 -0.4 -0.3 -0.2 -0.1 0.0 0.1 0.2 0.3 0.4 0.5 0.8 -120 -80 -40 0 40 80 15 30 45 60 -0.8 -0.5 -0.4 -0.3 -0.2 -0.1 0.0 0.1 0.2 0.3 0.4 0.5 0.8
Fig. 8. (a) Correlation coefficients between the deseasonalized and
detrended time series of CCC from 1984 to 2004 and NAO index during the wintertime (December, January and February) in the re-gion (15◦N–65◦N, 120◦W–80◦E). (b) Same as (a) but for VV300 from 1984 to 2001. Only correlation coefficients above/below ±0.3 are shown. Dotted line bounds regions where correlation coeffi-cients are statistically significant at the 95% confidence level (t-test). Rectangles show the regions in which cirrus cloud averages have been studied.
pact of the 1997/98 El Nino on the Earth-atmosphere system, Wang et al. (2003) estimated the changes in cloud longwave radiative forcing based on cloud observations from SAGE II. During the 1997/1998 El Nino, the magnitude of the cloud longwave radiative forcing was significantly reduced over the Pacific warm pool, Indonesia, northern South America and tropical Africa, implying increased outgoing longwave radiation. Concurrent with those changes was the greatly en-hanced cloud longwave radiative forcing over the eastern Pa-cific, corresponding to significantly reduced outgoing long-wave radiation.
The other natural oscillation that has been examined as to its effect on CCC is the North Atlantic Oscillation (NAO). As it is known, NAO has two phases; a positive and a neg-ative phase. The positive phase of NAO is characterized by an enhanced Icelandic low and an enhanced subtropical high pressure system resulting in a stronger pressure gradient with more and stronger winter storms crossing the Atlantic Ocean on a more northerly track, bringing moist air to northern Europe. Its negative phase is characterized by a weak Ice-landic low and a weak subtropical high pressure system re-sulting in fewer and weaker winter storms crossing on a more west-east pathway, bringing moist air into the Mediterranean. Such mode of natural climate variability over North Atlantic and Europe could have an effect on cirrus clouds. To study
Table 2. (a) Annual mean CCC (in % cloud cover), amplitude of annual cycle of CCC (in % cloud cover), interannual variance explained by
ENSO (in % cloud cover), and long-term trend (in % cloud cover per decade) from January 1984 to December 2004 over the ENSO regions (Eastern Pacific; 10◦S–10◦N, 80◦W–180◦W, Western Pacific; 10◦S–10◦N, 80◦E–150◦E). (b) Same as (a) but for the NAO regions (Eastern part of the North Atlantic and the Mediterranean; 25◦N–40◦N, 30◦W–20◦E, Northern Europe and the eastern part of NAFC; 50◦N–65◦N, 20◦W–10◦E). Underlined long-term trends are statistically significant at the 95% confidence level.
(a) ENSO regions
1984–2004 Annual mean Amplitude of annual
cy-cle
Interannual variance explained by ENSO
Trend per decade
Eastern Pacific 12.5% ±3% ±6.8% +0.6%
Western Pacific 29.4% ±2.4% ±5.9% −2.3%
(b) NAO regions
1984–2004 Annual mean Amplitude of annual
cy-cle
Interannual variance con-tributed by NAO
Trend per decade
Eastern part of the North At-lantic and the Mediterranean
9% ±3.6% ±2.4% −0.5%
Northern Europe and the east-ern part of NAFC
8.5% ±3.1% ±2.6% +1.6%
this effect, Fig. 8 shows the correlation coefficients between the deseasonalized and detrended time series of CCC and NAO index during the wintertime (December, January and February) in the region bounded by latitudes 15◦N–65◦N and by longitudes 120◦W–80◦E. For comparison purposes, the respective correlation coefficients between VV300 and NAO index are also presented. The positive correlations be-tween CCC and NAO index are shown by red and dark red colours whereas the negative correlations by blue and dark blue colours. The dotted line in Fig. 8 bounds the regions where the correlation coefficients are statistically significant at the 95% confidence level (Student’s t-test).
As can be seen from Fig. 8a, the correlation coefficients of CCC with NAO index during the wintertime show a dipole structure in the area, consisting of negative correlations over regions extending from the eastern part of the North Atlantic to the Mediterranean (up to −0.5 at some locations) and pos-itive correlations over northern Europe and the eastern part of NAFC, explaining part of the cirrus cloud long-term natural variability. Over these regions, the correlation coefficients are statistically significant at the 95% confidence level and compare well with those observed between VV300 and NAO (Fig. 8b). The negative correlations over the eastern part of North Atlantic and the Mediterranean (25◦N–40◦N, 30◦W–
20◦E) could suggest that when the NAO index is positive,
CCC is lower than normal in the area, possibly due to en-hanced sinking of air masses in the area caused by a stronger than usual high pressure system at Azores while less frequent west-east advection of moisture and more cold and dry air penetrations from north to southeast Europe is taking place. As we move to the north, the correlation coefficients over northern Europe and the eastern part of NAFC (50◦N–65◦N,
20◦W–10◦E) are less statistically significant and cover a smaller area when compared to those between VV300 and NAO. Possibly, this could be explained by the fact that during the wintertime there are limited satellite cloud observations by ISCCP over 57◦, and in that case our correlation results over 57◦are likely to be underestimated. However, it should be considered that other factors i.e. existence of complicated weather conditions and high natural cloud variability during the wintertime in the area may also mask this issue.
Figure 9 shows the time series of the anomalies of CCC from 1984 to 2004 versus NAO index during the winter-time over (a) the eastern part of the North Atlantic and the Mediterranean (25◦N–40◦N, 30◦W–20◦E) and (b) northern Europe and the eastern part of NAFC (50◦N–65◦N, 20◦W– 10◦E). From Fig. 9 it appears that CCC is anti-correlated with NAO index over the eastern part of the North Atlantic and the Mediterranean (R=−0.5, significant at the 95% con-fidence level) and positively correlated over northern Europe and the eastern part of NAFC (R=+0.3, significant at the 90% confidence level), confirming the correlation results of Fig. 8a.
As in the case of ENSO, we also calculated the percent of the interannual variance of CCC explained by NAO over the two regions by reconstructing the time series of CCC from NAO index based on Eq. (3). The reconstructed time se-ries of CCC at the two locations is shown in Fig. 9 by the lines with grey colour. The annual mean CCC, the ampli-tude of the annual cycle, the interannual variance explained by NAO, and the long-term trends of CCC over the studied regions are summarised in Table 2b. As can be seen from Table 2b, over the eastern part of the North Atlantic and the Mediterranean (25◦N–40◦N, 30◦W–20◦E) the amplitude of
-8 -4 0 4 8 -8 -4 0 4 8 -8 -4 0 4 8 -8 -4 0 4 8 Eastern part of the North Atlantic and
the Mediterranean (25N-40N, 30W-20E)
Northern Europe and the eastern part of NAFC (50N-65N, 20W-10E)
R= -0.5 (99%) R= +0.3 (90%) C C C a n o m a li e s N A O in d e x Fig. 9a Fig. 9b Anomalies of CCC (in % cloud cover)
Reconstructed CCC from NAO index NAO index D e c 8 4 D e c 8 6 D e c 8 8 D e c 9 0 D e c 9 2 D e c 9 4 D e c 9 6 D e c 9 8 D e c 0 0 D e c 0 2 D e c 0 4 Wintertime (Dec-Jan-Feb) Wintertime (Dec-Jan-Feb)
Fig. 9. (a) Time series of CCC anomalies and NAO index from 1984
to 2004 during the wintertime (December, January and February) over the eastern part of the North Atlantic and the Mediterranean (25◦N–40◦N, 30◦W–20◦E). (b) Same as (a) but for northern Eu-rope and the eastern part of NAFC (50◦N–65◦N, 20◦W–10◦E). R is the correlation coefficient between the two lines. Values in brack-ets refer to statistical significance of R. With grey colour is shown the reconstructed time series of CCC from NAO index at the two locations, indicating the interannual variance of CCC explained by NAO (in % cloud cover).
the annual cycle of CCC is 3.6% and the interannual variance of CCC explained by NAO is up to 2.4%. Accordingly, over northern Europe and the eastern part of NAFC (50◦N–65◦N, 20◦W–10◦E) the interannual variance of CCC explained by
NAO is up to 2.6% and it is also smaller than the amplitude of the annual cycle (3.1% cloud cover). Therefore, in north-ern mid-latitudes the percent of the interannual variance of CCC explained by NAO does not exceed the amplitude of the annual cycle.
Furthermore, to evaluate the significance of the anthro-pogenic (aviation) effect with respect to the natural vari-ability we have compared our results with manmade long-term trends over Europe and the NAFC as evidenced from earlier studies (Zerefos et al., 2003; Stordal et al., 2005; Stubenrauch and Schumann, 2005). According to Sausen et al. (1998), at altitude levels around 300 hPa regions that are susceptible to the formation of contrails are located more in the extra-tropics than over the tropics. Over Europe and the NAFC, flight frequencies and flight consumption are high (shown, for example, in Fig. 1 of Zerefos et al., 2003) and situations favourable for contrail formation have been esti-mated to occur about 7% over Europe and 5% over the NAFC (Stubenrauch and Schumann, 2005). Therefore, over Europe and the NAFC it is possible that cirrus amounts may also
in-clude persistent contrails and therefore the cirrus trends can be explained not only by natural long-term variability, but also by variability in manmade cirrus contrails. As can be seen from Table 2b, there is a positive trend in CCC over northern Europe and the eastern part of NAFC, which in the long-term amounts to about +1.6% per decade. This trend has been calculated after removing from the time series of CCC the fraction of the natural variability that is explained by NAO (shown in Fig. 9b by the grey line). This trend is statistically significant at the 95% confidence level and com-pares well with the observed positive manmade trends in cir-rus clouds over congested air traffic regions in Europe and the North Atlantic as have been evidenced from earlier stud-ies (Zerefos et al., 2003; Stordal et al., 2005; Stubenrauch and Schumann, 2005). On the other hand, over the other region which is influenced by NAO (25◦N–40◦N, 30◦W–
20◦E), there is a negative trend in CCC of about −0.5% per
decade, which follows the large-scale negative trends in CCC observed by ISCCP over most of the northern mid-latitudes. It should be noted that the respective trends in VV300 over the two studied areas are of the same sign (the order of +1.5 mPa/s per decade), which suggests that the differences in trends in CCC over the two regions cannot be attributed to differences in trends in vertical winds.
Possible effects of the stratospheric Quasi Biennal Oscil-lation (QBO) on cirrus clouds were also examined but there were no significant correlations between the two parameters (correlation coefficients less than 0.2). The correlation coef-ficients were small even for different month lags (−24, −18, −12, −6, 0, 6, 12, 18, 24) as well as for the pair VV300-QBO, providing indications that the stratospheric QBO does not affect the distribution and variability of upper tropo-spheric cirrus clouds.
4 Summary and conclusions
This study analysed globally cirrus cloud data from the IS-CCP D2 1984–2004 dataset and calculated the percent of the interannual variance of CCC explained by ENSO, NAO and QBO. The major findings and conclusions can be sum-marised as follows:
The variability of cirrus clouds is different over different geographical regions and originates from different causes. CCC was found to be strongly correlated with large-scale vertical velocities and relative humidity in the tropics (corre-lations with vertical velocities up to −0.7 at some locations and with relative humidity up to +0.7), suggesting that varia-tions in large-scale vertical winds and relative humidity fields explain the origin of up to half or more of the local variability in CCC over these regions. These correlations reflect mostly the seasonal cycle, indicated by the close seasonal match of the examined parameters. The highest amounts of cirrus clouds in all seasons were found in the tropics in agreement with earlier findings. In the tropics, the annual mean cirrus
coverage is about 20% and the amplitude of the annual cycle is 2.7%. The amplitude of annual cycle is almost symmetric about the equator peaking at 15◦N and 15◦S to about 7–8%
of total cloud cover. Its latitudinal distribution reflects the extent and the seasonal shifts of the Hadley circulation cell. Over the middle latitudes the amplitude of the annual cycle is smaller than over the subtropics reaching a maximum of 5% in the Northern Hemisphere. Globally (60◦N–60◦S), cir-rus clouds cover about 14% of the Earth’s upper troposphere (ISCCP 1984–2004 annual average) and the amplitude of the annual cycle is about 1.2%.
Although the annual cycle is dominant in all latitudes and longitudes, peaking over the tropics and subtropics, its amplitude is exceeded during strong El Nino/La Nina events. Over the eastern tropical Pacific Ocean (10◦N–10◦S, 80◦W–180◦W) the annual mean CCC is 12.5% and the
am-plitude of the annual cycle is 3%. However during ENSO, the interannual variance of CCC explained by ENSO is 6.8% and it is about 2.3 times larger than the amplitude of the an-nual cycle at these regions. The effects of NAO and QBO on natural cirrus cloudiness in the tropics were found to be small. Natural long-term trends in CCC in the tropics and subtropics are generally small (between −0.3% and −0.7% per decade) excluding the south extra tropics where no trends have been observed. Possible manmade trends in the tropics are small.
In the northern mid-latitudes, on the other hand, the ef-fect of NAO is more significant and can be very important regionally. More specifically, over the region bounded by latitudes 25◦N–40◦N and by longitudes 30◦W–20◦E (east-ern part of the North Atlantic and the Mediterranean) cirrus clouds are negatively correlated with NAO index during the wintertime by about −0.5. Over the region between 50◦N–
65◦N and 20◦W–10◦E (northern Europe and the eastern part of NAFC) the correlation is positive (+0.3). These correla-tions are statistically significant at the 90% confidence level and compare well with those observed between the vertical velocities at 300 hPa and NAO. Over northern Europe and the eastern part of NAFC the percent of the interannual vari-ance of CCC which is explained by NAO is ∼2.6% and it is smaller than the amplitude of the annual cycle (3.1% cloud cover). After removing the fraction of the interannual vari-ance that is explained by NAO, we find a significant increas-ing trend in CCC of about +1.6% per decade. This trend may be related to manmade cirrus contrails. On the other hand, over the other region which is influenced by NAO (25◦N–
40◦N, 30◦W–20◦E), there is a negative trend in CCC which
follows the general negative trends observed by ISCCP over most of the northern mid-latitudes. QBO and ENSO were not found to be significantly correlated with variations in cirrus clouds over the northern mid-latitudes.
The results of this work can be used to evaluate cirrus cloud cover and variability in climate model simulations. It is important for the climate models to get the cirrus covers right and this work can form the basis for an evaluation of both the
mean cirrus cover and scales of variability but also can give modellers a chance to examine whether the models simulate the dependence of cirrus cover on basic dynamic and ther-modynamic parameters. The global relationships between cirrus cloud cover and seasonal variability, ENSO and NAO derived in this paper can be tested in climate model simu-lations in order to quantify cirrus cloud dependencies in the model atmosphere. This would allow modellers to attribute model cirrus cloud deficiencies to either incorrect represen-tation of atmospheric dynamics processes or to problems in the parameterization of cirrus cloud formation.
Acknowledgements. This study was conducted within the FP6 Integrated Project “Quantifying the Climate Impact of Global and European Transport Systems” (QUANTIFY, Contract No 003893-GOCE) and contributes to the ECATS Network of Excellence, both funded by the European Commission. The study also contributes to the national project PENED (O3ED57) funded by the General Secretariat of Research and Technology. We would like to thank A. Sheffield from NASA/GISS for her assistance in the analysis of the equal-angle map grid of ISCCP D2 dataset. We also thank the reviewers who have helped improving the study.
Edited by: A. Nenes
References
Bourassa, A. E., Degenstein, D. A., and Llewellyn, E. J.: Climatol-ogy of the subvisual cirrus clouds as seen by OSIRIS on Odin, Adv. Space Res., 36, 807–812, 2005.
Cess, R. D., Zhang, M., Wang, P.-H., and Wielicki, B. A.: Cloud structure anomalies over the tropical Pacific during the 1997/98 El Nino, Geophys. Res. Lett., 28, 4547–4550, 2001.
Chen, B. and Liu, X.: Seasonal migration of cirrus clouds over the Asian Monsoon regions and the Tibetan Plateau mea-sured from MODIS/Terra, Geophys. Res. Lett., 32, L01804, doi:10.1029/2004GL020868, 2005.
Dessler, A. E. and Yang, P.: The Distribution of Tropical Thin Cir-rus Clouds Inferred from Terra MODIS Data, J. Climate, 16, 1241–1247, 2003.
Gierens, K., Schumann, U., Helten, M., Smit, H. G. J., and Marenco, A.: A distribution law for relative humidity in the up-per troposphere and lower troposphere derived from three years of MOZAIC measurements, Ann. Geophys., 17, 1218–1226, 1999,
http://www.ann-geophys.net/17/1218/1999/.
Gierens, K., Schumann, U., Helten, M., Smit, H., and Wang, P. H.: Ice–saturated regions and subvisible cirrus in the northern midlatitude upper troposphere, J. Geophys. Res, 105, 22 743– 22 754, 2000.
Jensen, E. J., Toon, O. B., Selkirk, H. B., Spinhirne, J. D., and Schoeberl, M. R.: On the formation and persistence of subvisi-ble cirrus clouds near the tropical tropopause, J. Geophys. Res., 101(D16), 21 361–21 375, 1996.
Liao, X, Rossow, W. B., and Rind, D.: Comparison between SAGE II and ISCCP high-level clouds, 1. Global and zonal mean cloud amounts, J. Geophys. Res., 100(D1), 1121–1135, 1995.
Liou, K. N.: Influence of cirrus clouds on weather and climate pro-cesses: a global perspective, Mon. Wea. Rev., 114, 1167–1199, 1986.
Lohmann, U. and Feichter, J.: Global indirect aerosol effects: a review, Atmos. Chem. Phys., 5, 715–737, 2005,
http://www.atmos-chem-phys.net/5/715/2005/.
Luo, Z., Rossow, W. B., Inoue, T., and Stubenrauch, C. J.: Did the Eruption of the Mt. Pinatubo Volcano Affect Cirrus Properties?, J. Climate, 17, 2806–2820, 2002.
Lynch, D. K.: Cirrus clouds: Their role in climate and global change, Acta Astronautica, 38(11), 859–863, 1996.
Massie, S., Lowe, P., Tie, X., Hervig, M., Thomas, G., and Russell III, J.: Effect of the 1997 El Nino on the distribution of upper tropospheric cirrus, J. Geophys. Res., 105(D18), 22 725–22 741, 2000.
Mergenthaler, J. L., Roche, A. E., Kumer, J. B., and Ely, G. A.: Cryogenic Limb Array Etalon Spectrometer observations of trop-ical cirrus, J. Geophys. Res., 104, 22 183–22 194, 1999. Minnis, P., Ayers, J. K., Palikonda, R., and Phan, D.: Contrails,
Cirrus Trends, and Climate, J. Climate, 17, 1671–1685, 2004. Rossow, W. B. and Schiffer, R. A.: ISCCP Cloud data products,
Bull. Amer. Meteorol. Soc., 72, 2–20, 1991.
Rossow, W. B., Walker, A. W., Beuschel, D. E., and Roiter, M. D.: International Satellite Cloud Climatology Project (ISCCP) Documentation of New Cloud Datasets, WMO/TD 737, World Climate Research Programme, Geneva, Switzerland, 1996. Rossow, W. B. and Schiffer, R. A.: Advances in understanding
clouds from ISCCP, Bull. Amer. Meteorol. Soc., 80, 2261–2287, 1999.
Sandor, B. J., Jensen, E. J., Stone, E. M., Read, W. G., Waters, J. W., and Mergenthaler, J. L.: Upper tropospheric humidity and thin cirrus, Geophys. Res. Lett., 27(17), 2645–2648, 2000. Sassen, K. and Campbell, J. R.: A Midlatitude Cirrus Cloud
Clima-tology from the Facility for Atmospheric Remote Sensing. Part I: Macrophysical and Synoptic Properties, J. Atmos. Sci., 58, 481– 496, 2001.
Sausen, R., Gierens, K., Ponater, M., and Schumann, U.: A diag-nostic study of the global distribution of contrails, part I: present day climate, Theor. Appl. Climatol., 61, 127–141, 1998. Sausen, R., Isaksen, I., Grewe, V., Hauglustaine, D., Lee, D. S.,
Myhre, G., K¨ohler, M. O., Pitari, G., Schumann, U., Stordal, F., and Zerefos, C.: Aviation radiative forcing in 2000: An update on IPCC (1999), Meteorol. Z., 14(4), 555–561, 2005.
Schumann, U.: Formation, properties and climate effects of con-trails, C. R. Physique, 6, 549–565, 2005.
Spichtinger, P., Gierens, K., and Read, W.: The global distribu-tion of ice-supersaturated regions as seen by the microwave limb sounder, Quart. J. Roy. Meteorol. Soc., 129, 3391–3410, 2003.
Spichtinger, P., Gierens, K., and D¨ornbrack, A.: Formation of ice supersaturation by mesoscale gravity waves, Atmos. Chem. Phys., 5, 1243–1255, 2005,
http://www.atmos-chem-phys.net/5/1243/2005/.
Stordal, F., Myhre, G., Stordal, E. J. G., Rossow, W. B., Lee, D. S., Arlander, D. W., and Svendby, T.: Is there a trend in cirrus clouds cover due to aircraft traffic?, Atmos. Chem. Phys., 5, 2155–2162, 2005,
http://www.atmos-chem-phys.net/5/2155/2005/.
Stubenrauch, C. J. and Schumann, U.: Impact of air traf-fic on cirrus coverage, Geophys. Res. Lett., 32, L14813, doi:10.1029/2005GL022707, 2005.
Tselioudis, G. and Jakob, C.: Evaluation of midlatitude cloud prop-erties in a weather and a climate model: dependence on dy-namic regime and spatial resolution, J. Geophys. Res., 107(D24), AAC–14, 2002.
Wang, P.-H., Minnis, P., McCormick, M. P., Kent, G. S., and Skeens, K. M.: A 6-year climatology of cloud occurrence fre-quency from Stratospheric Aerosol and Gas Experiment II ob-servations (1985–1990), J. Geophys. Res., 101, 29 407–29 429, 1996.
Wang, P. H., Minnis, P., Wielicki, B. A., Wong, T., and Vann, L. B.: Satellite observations of long-term changes in tropical cloud and outgoing longwave radiation from 1985 to 1998, Geophys. Res. Lett., 29, 1397, doi:10.1029/2001GL014264, 2002.
Wang, P.-H., Minnis, P., Wielicki, B. A., Wong, T., Cess, R. D., Zhang, M., Vann, L. B., and Kent, G. S.: Charac-teristics of the 1997/1998 El Nino cloud distributions from SAGE II observations, J. Geophys. Res., 108(D1), 4009, doi:10.1029/2002JD002501, 2003.
Woodbury G. E. and McCormick, M. P.: Zonal and Geographical Distributions of Cirrus Clouds Determined From SAGE Data, J. Geophys. Res., 91(D2), 2775–2785, 1986.
Wylie, D. P. and Menzel, W. P.: Eight Years of High Cloud Statistics Using HIRS, J. Climate, 12, 170–184, 1999.
Zerefos, C. S., Tourpali, K., and Bais, A. F.: Further studies on possible volcanic signal to the ozone layer, J. Geophys. Res., 99, 25 741–25 746, 1994.
Zerefos, C. S., Eleftheratos, K., Balis, D. S., Zanis, P., Tselioudis, G., and Meleti, C.: Evidence of impact of aviation on cirrus cloud formation, Atmos. Chem. Phys., 3, 1633–1644, 2003,
http://www.atmos-chem-phys.net/3/1633/2003/.
Zerefos, C. S., Eleftheratos, K., Zanis, P., Balis, D. S., and Tse-lioudis, G.: Search for manmade cirrus-contrails over South-east Asia, Special Issue of East Asia Climate and Environment (EACE) in TAO, in press, 2007.