HAL Id: hal-00317349
https://hal.archives-ouvertes.fr/hal-00317349
Submitted on 8 Apr 2004
HAL is a multi-disciplinary open access
archive for the deposit and dissemination of
sci-entific research documents, whether they are
pub-lished or not. The documents may come from
teaching and research institutions in France or
abroad, or from public or private research centers.
L’archive ouverte pluridisciplinaire HAL, est
destinée au dépôt et à la diffusion de documents
scientifiques de niveau recherche, publiés ou non,
émanant des établissements d’enseignement et de
recherche français ou étrangers, des laboratoires
publics ou privés.
equatorward drifting arcs during a substorm growth
phase
J. R. T. Jussila, A. T. Aikio, S. Shalimov, S. R. Marple
To cite this version:
J. R. T. Jussila, A. T. Aikio, S. Shalimov, S. R. Marple. Cosmic radio noise absorption events
associated with equatorward drifting arcs during a substorm growth phase. Annales Geophysicae,
European Geosciences Union, 2004, 22 (5), pp.1675-1686. �hal-00317349�
Cosmic radio noise absorption events associated with equatorward
drifting arcs during a substorm growth phase
J. R. T. Jussila1, A. T. Aikio1, S. Shalimov2, and S. R. Marple3
1Department of Physical Sciences, P.O. Box 3000, FIN-90014 University of Oulu, Finland 2Institute of physics of the Earth, Moscow, Russia
3Department of Communication systems, University of Lancaster, UK
Received: 15 May 2003 – Revised: 20 October 2003 – Accepted: 21 October 2003 – Published: 8 April 2004
Abstract. Cosmic radio noise absorption (CNA) events
as-sociated with equatorward drifting arcs during a substorm growth phase are studied by using simultaneous optical au-roral, IRIS imaging riometer and EISCAT incoherent scatter radar measurements. The CNA is generally attributed to en-ergetic particle precipitation in the D-region. However, it has been argued that plasma irregularities or enhanced electron temperature (Te) in the E-region could also produce CNA.
Both of the latter mechanisms are related to intense electric fields in the ionosphere. We present two events which occur during a substorm growth phase in the evening MLT sector. In both of the events, an auroral arc is drifting equatorward, together with a region of CNA (auroral absorption bay) lo-cated on the equatorward side and outside of the arc. Both of the events are associated with enhanced D-region elec-tron density on the equatorward side of the auroral arc, but in the second event, a region of intense electric field and en-hanced electron temperature in the E-region is also located on the equatorward side of the arc. We show that in the stud-ied events neither plasma instabilities nor enhanced Teplay
a significant role in producing the measured CNA, but the CNA in the vicinity of the equatorward drifting arcs is pro-duced by D-region energetic electron precipitation.
Key words. Ionosphere (auroral ionosphere; particle
precip-itation; electric fields and currents)
1 Introduction
The height-integrated ionospheric attenuation of high fre-quency cosmic radio waves, i.e. cosmic radio noise absorp-tion (CNA) is measured by riometers operating in the fre-quency range of 20–50 MHz. Under disturbed conditions the CNA is generally attributed to the enhancement of region ionization produced by particle precipitation. The D-region can be ionized by energetic electrons (≥30 keV) or Correspondence to: J. R. T. Jussila
protons of MeV range. It has also been suggested that CNA could be produced in the E-region by plasma irregularities (D’Angelo, 1976) or by an enhanced electron temperature (Stauning, 1984). Both of these E-region mechanisms are related to strong ionospheric electric fields.
The aim of this paper is to study the relative importance of the conventional D-region precipitation and the proposed E-region processes producing CNA in the vicinity of quiet auroral arcs occurring during a substorm growth phase.
It is well known that auroral arcs are drifting equatorward during the growth phase of a substorm. The development of auroral absorption substorms has been studied in several pa-pers (Hargreaves et al., 1975; Pytte et al., 1976; Ranta et al., 1981; Pellinen et al., 1982; Ranta and Ranta, 1984; Ranta et al., 1999). Studies show a pre-onset absorption bay that often precedes an onset of a substorm. The absorption bay is extended in the east-west direction, moves slowly equator-ward and is typically 50–100 km wide latitudinally. Optical data has very seldom been available in absorption studies. The study by Pellinen et al. (1982) showed that the maxi-mum of CNA was located on the equatorward side of the growth phase auroral arc. Also, many studies have utilized wide-beam riometer antennas, and, therefore, it has not been possible to determine the extent of the actual absorption area with a high accuracy. Stoker et al. (1997) studied the rela-tionship of CNA and discrete auroral arcs or pulsating auroral patches by an imaging riometer during disturbed conditions and they concluded that the CNA occurred adjacent to the auroral forms.
Sergeev et al. (1990) proposed that the observed CNA dur-ing a substorm growth phase was due to pitch-angle scatter-ing of energetic electrons in the equatorial current sheet and the equatorward movement of the CNA region was due to configuration changes in the magnetotail. On the other hand, Williams et al. (1990), Opgenoorth et al. (1990), Aikio et al. (1993) and Aikio et al. (2002) have shown that an enhanced meridional electric field and an accompanying enhanced E-region electron temperature are often observed outside of an auroral arc, on the equatorward side of an eveningside arc. In
addition, there is evidence that CNA can occur outside of an arc and that the enhanced electric field associated with drift-ing quiet arc is also located outside of the arc. Our aim is to study whether these two phenomena (CNA and enhanced electric field) are related causally.
We have looked for events of equatorward drifting quiet growth phase arcs with simultaneous measurements of 1) au-roras by the Kilpisj¨arvi (KIL) all-sky camera (ASC), 2) CNA by the IRIS imaging riometer at Kilpisj¨arvi and 3) plasma parameters (Ne, Te, Ti and E) by the EISCAT incoherent
scatter facility in Tromsø within the field-of-view (fov) of both the KIL ASC and IRIS. We selected two good events: 7 December 1999 and 8 April 1998. In the latter event the au-roral arc is associated with a region of enhanced electric field and increased Te in the E-region on the equatorward side of
the arc, as discussed by Aikio et al. (2002).
For these events, the CNA measured by IRIS will be com-pared to the CNA calculated from the EISCAT data using the equation of the conventional nondeviative absorption. This equation is formulated mainly for D-region absorption phe-nomena and if E-region instabilities play a major role, the calculated CNA should be significantly less than the mea-sured one.
2 Measurements
2.1 Instrumentation
The CNA was measured by the IRIS (Imaging Riometer for Ionospheric Studies) system, which is located at Kilpisj¨arvi (69.05◦N, 20.79◦E). IRIS consists of 49 (7×7) narrow beams with widths between 13◦ and 16◦, and it operates at a frequency of 38.2 MHz (Browne et al., 1995). The basic time resolution is 1 s, but in this study we have used integra-tion times of 10 s. The calculated absorpintegra-tion was mapped to the altitude of 80 km in both events, and the data was interpo-lated to produce a grid comprising 67.8–70.2◦N and 17.75– 23.75◦E, with a resolution of 0.1◦N×0.25◦E.
Auroras were recorded by an all-sky camera of the MIR-ACLE network (Syrj¨asuo et al., 1998) at Kilpisj¨arvi. The IRIS fov is located inside that of the ASC. The wavelength of 557.7 nm originating from the O1S emission was used for the interference filter of the ASC. The time resolution of the ASC during both of the events was 20 s. The exposure time of each image was 1 s. ASC images were mapped to the ge-ographical grid by assuming the lower border of auroras at 100 km (Event 1) or 120 km (Event 2).
The EISCAT (European Incoherent SCATter radar) UHF-radar (Risbeth and van Eyken, 1993) was measuring during both of the events in the CP-1 magnetic field-aligned mode. The basic time resolution of the data was 5 s, but the data were post-integrated to 60 or 120 s resolution. The altitude resolution of the data used was 3 km. The CP-1 experiment contained several pulse codes: long pulses, alternating codes and power profiles. The use of EISCAT data is explained in more detail in the following section.
2.2 Method to calculate the CNA from EISCAT measure-ments
The nondeviative absorption of a vertically incident radio wave is given, for example, by Hargreaves (1992)
A(db) =4.6 · 10−5 Z h Neνen νen2 +(ω − e)2 dh , (1)
where Ne is the electron density in m−3, νen the
electron-neutral collision frequency, ω the angular frequency of the radio wave and ethe electron gyrofrequency.
To calculate the absorption with Eq. (1), the electron den-sity was obtained from the EISCAT measurement. The alter-nating code pulse scheme extended from 86 to 270 km (Event 1) or to 191 km (Event 2), and it provided true electron densi-ties. At lower heights, only the power profile data was avail-able. The relationship between the true electron density Ne
and the so-called raw electron density Neraw provided by the power profiles is Ne Neraw = 1 2(1 + k 2λ2 d)(1 + Te Ti +k2λ2d), (2)
where λd=(ε0kBTe/Nee2)1/2 is the Debye length and k is
the wave number of the EISCAT UHF-radar (λ=0.322 m−1). It can be seen that if the Debye term can be omitted and the electron and ion temperatures are equal, then the raw and true electron densities are also equal. In order to make a correction for the raw electron density, we have estimated the Debye length by using the raw electron density as Neand by
assuming Te=Ti=Tn, which is usually a good approximation
in the D- and lower E-region. The Tnprofiles were obtained
from the MSIS model (Hedin, 1991). Then the power profile data, together with Eq. (2), was used to estimate Nebetween
70 and 86 km. The alternating code provided Nebetween 86
and 140 km.
To calculate the absorption, the electron-neutral collision frequency profile was also needed and it was calculated by νen=νeO+νeO2+νeN2 (3)
(Doe et al., 1995), where the individual collision frequencies for atomic and molecular oxygen, and molecular nitrogen are given by νeO =8.9·10−17[O](1 + 0.00057·Te) p Te (4) νeO2 =1.8·10−17[O2](1 + 0.036·Te) p Te (5) νeN2 =2.3·10−17[N2](1 + 0.00012·Te) p Te, (6)
where the number densities of |O], [O2]and [N2]are taken
from the MSIS model. The electron temperature for the height region 100–140 km was taken from the EISCAT mea-surement and below this from MSIS, assuming Te=Tn. The
electron gyrofrequency was calculated by using the IGRF magnetic field model for Tromsø.
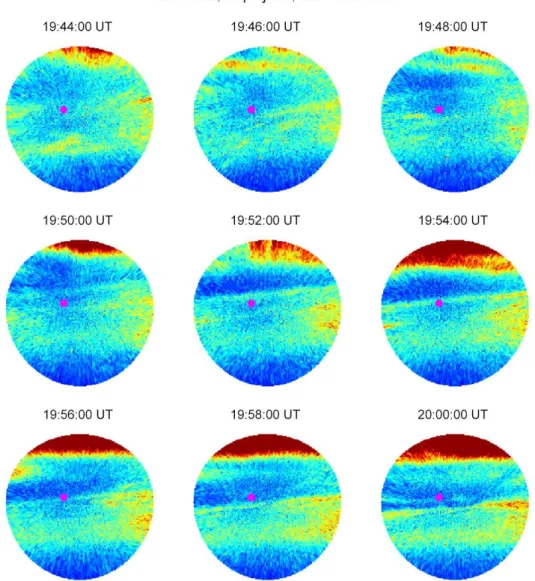
Fig. 1. Kilpisj¨arvi ASC data from nine selected times from Event 1 on 7 December 1999. The ASC images are shown in false colour, mapped to the longitude-latitude grid, assuming the height of 100 km for the structures. The auroral intensities are arbitrary and scaled from the original 8-bit gray scale image. The studied arc can be seen from 19:48 UT onward, on the poleward side of the diffuse aurora. It drifts equatorward and reaches the EISCAT beam location (marked with magenta dot) at 19:54 UT. At 20:00 UT the second weak arc can be seen in the location of EISCAT.
To estimate how sensitive the results were to the electron-neutral collision frequency profile selected, we also calculated the absorption by using an equation νen=5.8·10−11N Te5/6from Gurevich (1978), where N is the
neutral density from the MSIS model, but the difference was negligible.
3 Studied events
3.1 Event 1, 7 December 1999
The first event occurred between 19:40 and 20:05 UT on 7 December 1999 during a growth phase of a small substorm. Selected images of ASC and IRIS data from this event are shown in Figs. 1 and 2. Figure 1 shows the 557.7 nm
emis-sion from the KIL ASC in geographic coordinates by assum-ing an altitude of 100 km as the lower border of optical auro-ras. The altitude was selected on the basis of EISCAT elec-tron density profiles. The location of EISCAT is marked with a magenta dot. The optical data shows a wide region of dif-fuse aurora with a weak discrete arc at the poleward edge, which becomes visible at 19:48 UT. At the poleward hori-zon, more intense aurora exist. The weak arc and the diffuse aurora drift slowly equatorward. Also, scanning photome-ter data at 557.7 nm from Karesuvanto (68.47◦N, 22.44◦E)
show this equatorward drift clearly (data not shown). New arcs form on the poleward side of the studied arc, as seen at 20:00 UT. The onset of the substorm occurs at about 20:08 UT.
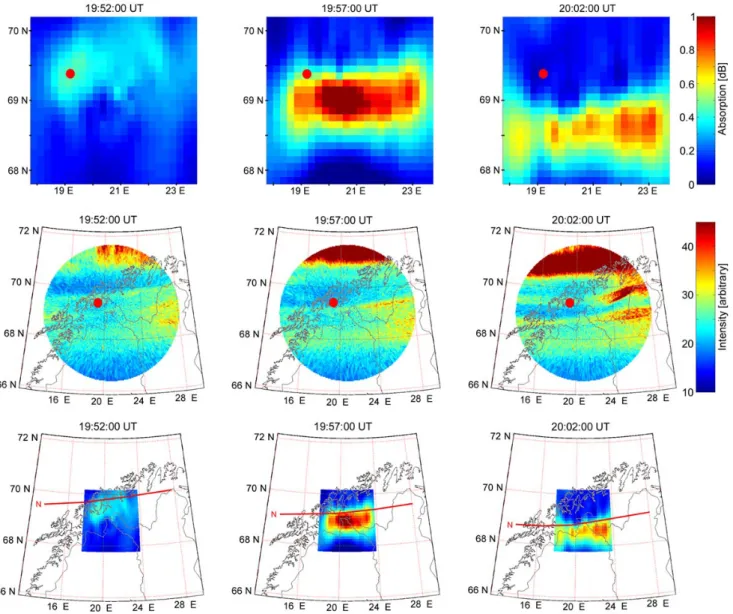
The top panel of Fig. 2 shows the CNA measured by IRIS in a geographic grid, assuming an altitude of 80 km for
Fig. 2. Absorption, optical and combined data from three selected times from Event 1 on 7 December 1999. The top panel shows the colour coded absorption from IRIS mapped to the longitude-latitude grid to the 80 km altitude. The maximum for the absorption is 1 dB. The middle panel shows the whole ASC image, mapped to the longitude-latitude grid, assuming the height of 100 km for the structures. The bottom panel shows the combined IRIS and ASC data. Only the location of the edge (N for northern edge, S for southern edge, depending on the location of the arc referred to the site) of the arc is shown with the absorption data.
absorption. The data shows a longitudinally stretched ab-sorption region, which drifts equatorward. The total width of this region is all the time below 100 km, and the half-width is of the order of 50 km. The absorption region contains struc-tures changing with time, in agreement with the observations of pulsating absorption patches by Ranta et al. (1999). Fur-thermore, absorption shows intensity variations and it is the most intense with a maximum value of 1 dB between 19:55 and 19:59 UT, when the maximum of the CNA region is no longer within the EISCAT beam (red circle in the figure).
The middle panel of Fig. 2 shows the ASC data in geo-graphic coordinates from the same time intervals as the IRIS
data in top panel. Again, the structures are mapped to the altitude of 100 km. All auroral structures drift equatorward and the velocity of the studied arc is about 170 m s−1. The 20:02 UT image shows the intensification of the arcs to the east of EISCAT and IRIS.
The bottom panel of Fig. 2 combines the IRIS and optical images from the top and middle panels. Here the location of the arc at the poleward boundary of the diffuse aurora is shown by a red line. Since the mapping height of the arc was 100 km and the IRIS measurement 80 km, an accurate comparison would require mapping of the arc location 20 km further down along magnetic field lines. Since the inclination
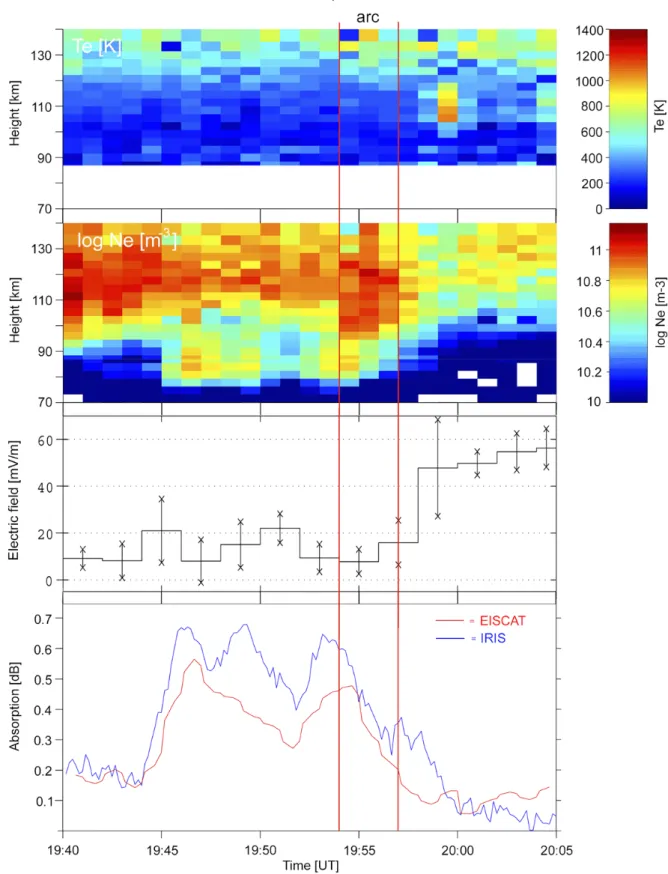
Fig. 3. The EISCAT data for Event 1 on 7 December 1999. The top panel shows the electron temperature Tefrom EISCAT for the height
range 100–140 km with a 60 s integration time. The Tewas obtained from the MSIS model for the height range of 70–100 km (not shown).
The second panel shows the electron density Nefrom a power profile for 70–86 km and from analyzed Nefrom 86 to 140 km with a 60 s
integration time. The third panel shows the total intensity of the horizontal electric field. The integration time of 120 s was used for calculating the electric field. The bottom panel shows the total absorption measured with IRIS (blue line) and calculated from EISCAT measurements (red line).
of the magnetic field lines is only 12◦at KIL, this correction
would account for a shift of the arc of only about 4 km to the poleward direction, which would not be visible in the figure, so that correction is omitted. The figure clearly demonstrates that the absorption region is located on the equatorward side of the weak arc, within the same region as the weak diffuse aurora.
Figure 3 shows the EISCAT measurement and the mea-sured and calculated CNA. The top panel shows the elec-tron temperature from 100 to 140 km altitude. In the cal-culation the values of Te were used from the MSIS model
for the height range of 70–100 km. The electron tempera-ture remains rather small throughout the event, except for 19:59–20:00 UT, on the poleward side of the studied arc at an altitude of about 110 km. We argue that the Teenhancement
is not related to the studied arc but to the arc on the poleward side of it, since the analysis of the electric field shows that at this location the northward electric field reaches a value of 50 mV m−1 and thus that arc obeys the typical electro-dynamic pattern of some eveningside arcs (e.g. Aikio et al., 2002).
The second panel shows the raw electron density between 70 and 86 km, and the electron density from the alternating code between 86 and 140 km, as used in the calculation of the CNA. As explained in the previous section, the raw electron density was corrected for the Debye effect, which accounted for a correction factor of the order of 1.1 for the density. The diffuse aurora is visible as the electron density enhancement mainly between the 110 and 130 km altitude. The studied arc is measured between 19:54–19:57 UT by EISCAT, and it is visible both as an electron density enhancement and as a decrease of the lower edge down to 100 km. After 20:00 UT there are small electron density enhancements within a broad range of altitudes above 110 km, which are related to other auroral arcs drifting to the EISCAT beam. Between 19:45 and 19:55 UT, on the equatorward side of the studied arc, there are enhancements of electron density at lower altitudes, with a maximum at about 83 km. They are obviously pro-duced by energetic electron precipitation.
The third panel shows the total intensity of the electric field measured by EISCAT. The electric field is enhanced from 19:58 UT onward in the region of decreased electron density in the E-region poleward of the arc.
The bottom panel shows the calculated total absorption from the EISCAT data (red curve) and that measured by IRIS (blue curve) at the location of the EISCAT beam. The absorp-tion from EISCAT shows two peaks corresponding to the two strong enhancements of electron densities between 80 and 90 km. The IRIS data shows the same two peaks and an addi-tional middle peak at about 19:49 UT. These peaks reflect the temporal and spatial variation in absorption. When analysing EISCAT data with a 20-s integration time, D-region elec-tron density values showed significant variations within one minute time, e.g. 19:49:00–19:49:20 UT, where a clear max-imum was obtained. Obviously, the D-region precipitation varied in time and space and this, together with the nar-row beam of EISCAT (0.6◦) compared to the wide beam of
IRIS (13◦), resulted in the absence of a clear middle peak
from the calculated CNA. During 19:50–19:53 UT, CNA was small throughout the IRIS fov and after 19:56 UT absorp-tion reached its maximum value, but since the region of CNA had drifted away from the EISCAT beam, it is not visible in Fig. 3. It can be further noticed that during the time interval of high E-region Te, 19:59–20:00 UT, the CNA produced be-tween 100 and 120 km is only 0.006 dB. The two curves show clearly the same characteristics with similar background ab-sorption values. The measured CNA values are larger than the calculated ones, but the difference is rather small, with a mean value of 0.1 dB (average over 19:44–20:00 UT). The possible reasons for this difference are discussed in Sect. 4.
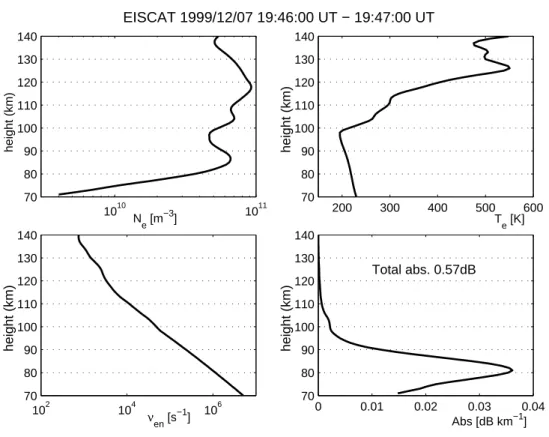
Figure 4 shows altitude profiles of electron density, elec-tron temperature, elecelec-tron-neutral collision frequency and in-cremental absorption (absorption per unit height), calculated from the EISCAT data at the first peak of CNA in Fig. 3, 19:46–19:47 UT. Absorption is produced below 90 km with a maximum close to 81 km, close to the maximum of the D-region electron density, which is located at 87 km altitude. 3.2 Event 2, 8 April 1998
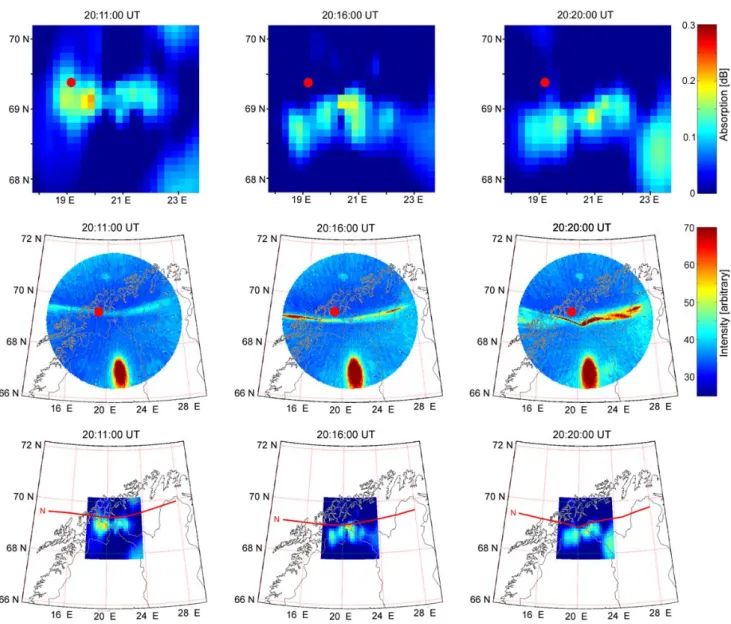
The second event occurred between 19:45 and 20:20 UT on 8 April 1998, also during a growth phase of a small substorm. Figure 5 shows IRIS and optical data in the same format as Fig. 2 but now the auroral arc has been mapped to 120 km, as deduced by the EISCAT data. The top panel shows again a region of east-west elongated and patchy CNA drifting equa-torward. The absorption area is slightly wider than in Event 1, the total width exceeds 120 km and the half-width is about 60 km. In this case the CNA is very weak, with a maximum value of about 0.3 dB. The all-sky camera was switched on at 20:11 UT, just prior to a faint discrete arc which drifted to the beam of EISCAT. The arc continued to drift equatorward until the substorm onset at 20:20 UT, when the arc intensified and a fold developed in the arc. The average drift speed of the arc was 120 m s−1, and the width of the arc was 15 km (Aikio et al., 2002). Again, the region of CNA was located on the equatorward side of the arc, which can be seen from the bottom panel.
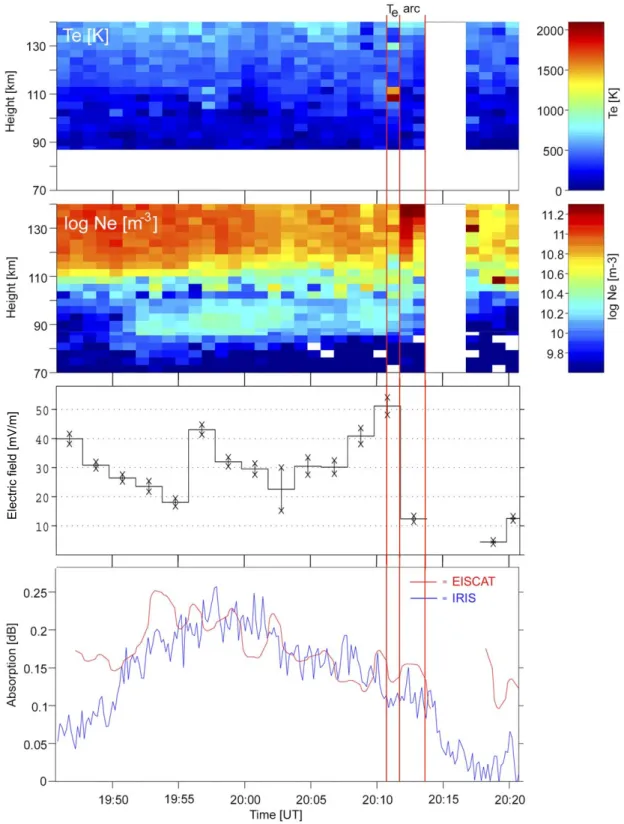
Figure 6 shows EISCAT and IRIS data in the same format as Fig. 3. Electron temperature (top panel) shows a signifi-cant enhancement centered at 110 km just on the equatorward side of the arc, with values reaching 1700 K during 20:10:45– 20:11:45 UT. Within the same region, the mainly northward electric field magnitude reaches 51 mV/m, as shown in the third panel. The discrete auroral arc is visible as an increased electron density above 120 km during 20:11:45–20:12:45 UT (second panel), after which there is a short data gap. On the equatorward side of the arc there is some electron precipita-tion to the E- as well as the D-region. The D-region electron density has a maximum value at about 90 km, between 19:51 and 20:11 UT. The bottom panel of Fig. 6 shows the values of total absorption from IRIS (blue line) and EISCAT (red line). The values of CNA measured with IRIS were small, with a maximum value of about 0.3 dB. At the location of
1010 1011 70 80 90 100 110 120 130 140 Ne (m−3) 200 300 400 500 600 70 80 90 100 110 120 130 140 Te (K) height (km) 102 104 106 70 80 90 100 110 120 130 140 height (km) 0 0.01 0.02 0.03 0.04 70 80 90 100 110 120 130 140 height (km) Total abs. 0.57dB height (km) T e [K] Abs [dB km−1] νen [s−1] N e [m −3] EISCAT 1999/12/07 19:46:00 UT − 19:47:00 UT
Fig. 4. Examples of altitude profiles of electron density (top left), electron temperature (top right), electron-neutral collision frequency (bottom left) and calculated incremental absorption for the 70 to 140 km altitude in Event 1. The total absorption is obtained by integrating the incremental absorption over height.
the EISCAT beam the maximum was 0.25 dB. The enhanced absorption is co-located with the enhanced electron density in the D-region from 19:51 to 20:14 UT. During this time interval, the measured and calculated absorption are almost equal. However, the calculated background values are about 0.1 dB larger than the measured ones.
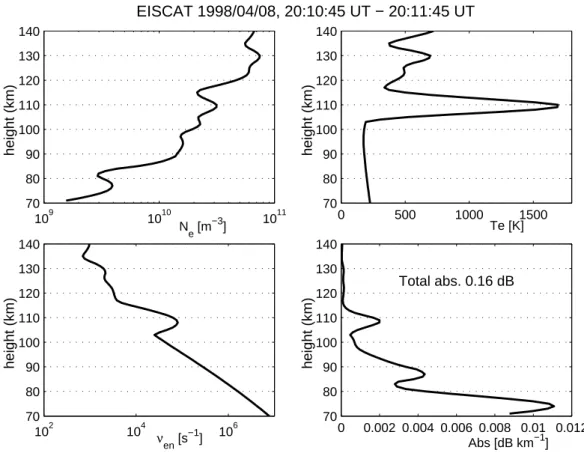
Within the narrow region of the enhanced electric field and electron temperature on the equatorward side of the arc, there is no increase in the measured CNA. Also, the calculated CNA is at the same level as inside the arc. Figure 7 shows the altitude profiles from this time interval. The Teenhancement
centered at the altitude of 110 km produces a small ment to the incremental absorption profile. The enhance-ment amounts to about 0.01 dB between altitudes of 100 and 120 km, so its effect to the total absorption is small, and the main contribution comes below the altitude of 90 km.
4 Discussion
We have studied two stable drifting arcs, which were associ-ated with a region of CNA on the equatorward side of them. The CNA close to magnetic midnight hours is generally at-tributed to the enhancement in the D-region electron densi-ties, which, together with the high electron-neutral collision
frequency in the D-region, is capable of absorbing a part of the cosmic radio noise (Collis et al., 1996; Stauning, 1996).
Previous studies have also shown that drifting auroral arcs during a substorm growth phase are often associated with an enhanced electric field and enhanced electron temperature in the E-region on the equatorward side of them, indicative of a plasma instability (Williams et al., 1990; Opgenoorth et al., 1990; Aikio et al., 1993). The frequency range generally in use by riometers corresponds to the few-meter-length E-region irregularities produced by the Farley-Buneman (FB) instability. These waves are known to be generated in the electrojet layer during periods of strong electric fields (Far-ley, 1963; Bunemann, 1963). Initially, the mechanism has been proposed to be operated in the equatorial electrojet (D’Angelo, 1976) and then the conclusion has been extended to the auroral electrojet (D’Angelo, 1978; D’Angelo, 1981; Mehta and D’Angelo, 1980). However, Farley et al. (1981) pointed out that the irregularities are highly field-aligned, and since the magnetic field is nearly vertical in the auroral zone, even very strong irregularities will be unable to scatter back into space cosmic noise coming from more or less overhead. Analysis of riometer observations by Siren (1982) supported the idea that scattering of cosmic radio waves is unable to quantitatively account for the observed absorption intensities at high latitudes.
Fig. 5. Absorption, optical and combined data from three times for Event 2 on 8 April 1998. The top panel shows the colour coded absorption from IRIS mapped to the longitude-latitude grid to the 80 km altitude. The maximum value of absorption is 0.3 dB. The middle panel shows the whole ASC image in false colour, mapped to the longitude-latitude grid at 120 km height. The auroral intensities are arbitrary and scaled from the original 8-bit gray scale image. The bright red spot on the lower part of the images is the full Moon. The bottom panel shows the combined IRIS and ASC data.
Fig. 6. The EISCAT data for the Event 2, with an integration time of 60 s for Teand Ne, and 120 s for the electric field. The data format is
the same as in Fig. 3. The panels from top to bottom are electron temperature, electron density, total intensity of electric field and absorption, both from IRIS and EISCAT.
109 1010 1011 70 80 90 100 110 120 130 140 Ne [m−3] height (km) 0 500 1000 1500 70 80 90 100 110 120 130 140 Te [K] height (km) 102 104 106 70 80 90 100 110 120 130 140 height (km) 0 0.002 0.004 0.006 0.008 0.01 0.012 70 80 90 100 110 120 130 140 Abs [dB km−1] height (km) Total abs. 0.16 dB νen [s−1] EISCAT 1998/04/08, 20:10:45 UT − 20:11:45 UT
Fig. 7. Altitude profiles of electron density (top left), electron temperature (top right), electron-neutral collision frequency (bottom left) and
incremental absorption for the 70 to 140 km altitude at 19:46–19:47 UT for Event 2. The strong enhancement in the Te, and its effect on the
collision-frequency and absorption at about 110 km altitude are clearly visible.
The E-region absorption has also been attributed to the en-hanced electron temperature directly. Stauning (1984) ex-plained the absorption event with values below 1.0 dB in the summer cusp by an enhanced classical collision frequency in the strongly heated E-region, in association with strong ionospheric electric fields exceeding 50 mV/m. This value of the electric field magnitude corresponds quite well to the ex-perimentally determined “threshold” condition which should be met in order for strong electron heating to start operat-ing (Williams et al., 1990; Haldoupis et al., 1993; Aikio et al., 2002). It was also pointed out by Stauning (1984) that an event of this type requires a relatively dense E-region and substantially elevated electron temperatures to cause visible effects in the measured absorption. Due to this, daytime pro-files were selected in his work from the polar cusp, and dur-ing the selected events, the density at 105 km height stayed close to 2·1011m−3. During similar conditions, Olesen et al. (1986) have shown that the frequency selective absorption (lacuna) at the E-region critical frequency might well be ex-plained by the enhanced deviative absorption caused by the increased electron-neutral collision frequency in the heated E-region. High electron temperature, therefore, seems a pos-sible explanation for lacuna and associated cosmic noise ab-sorption events.
The analysis of EISCAT data for these two events showed that within the regions of CNA, enhanced electron densities in the D-region existed. However, on the equatorward side of an arc an elevated electron temperature in the E-region and enhanced electric field was found in Event 2. The nondevia-tive absorption was calculated between 70 and 140 km, and it was compared to the measured absorption at the point of EISCAT observation. In Event 1, CNA varied with time, and this temporal variation was similar, both in the IRIS data and the calculated CNA. However, the calculated CNA was on the average 0.1 dB smaller than the measured one in Event 1, and there were some differences in the behaviour. There are several possible reasons for these differences. First, CNA was spatially structured, and this may have some effect, since the beam width of EISCAT is only 0.6◦as compared to the IRIS beam of about 13◦. Second, the EISCAT beam is not located exactly at any single IRIS beam position but the IRIS measurements have been interpolated to the location of EIS-CAT. Third, there are uncertainties in the calculated CNA. We used the MSIS model to estimate the electron tempera-ture for the lowest altitudes, and they were used in calculat-ing the electron-neutral collision frequencies and the Debye-correction for the electron density. The number densities of neutral molecules are from the MSIS model and thus, the υenis probably the largest source of error in the calculation.
its. Despite these uncertainties, the calculated and measured CNA are in good agreement in both of the events.
The maximum absorption was produced at an altitude of about 80 km in both events. The maximum altitude of the D-region electron density enhancement took place at 84 km (Event 1) and at 90 km (Event 2). Both the altitude of the density enhancement and the peak absorption remained rather constant throughout the events. The electrons caus-ing density enhancement in D-region may originate from the radiation belts but the discussion of the precipitation mecha-nisms is beyond the scope of this paper and we refer to the paper by Sergeev et al. (1990).
In Event 2, a region of elevated Te, centered at 110 km,
was located on the equatorward side of the arc, with the value reaching 1700 K, about 1300 K above the background level. The width of the region of enhanced Tewas of the order of
the arc width, 15 km. The altitude range of the temperature enhancement was about 10 km (height resolution was 3 km), so it was very narrow. The incremental absorption profile showed a clear enhancement between 100 and 120 km, com-pletely accounting for the absorption of the order of 0.01 dB. However, the main part of the absorption comes from alti-tudes below 90 km. The small effect of the enhanced Teon
the absorption is partly due to the very low Ne within the
same region: the enhanced electric field and Tetend to occur
in the auroral cavity (Aikio et al., 2002).
In Event 2, the enhancement of Te, with a value of 1300 K
over the background in the narrow region just equatorward of the arc, was well correlated with the electric field value exceeding 50 mV/m, in accordance with FB instability. We can argue that during this time the electric field is responsi-ble for the Teenhancement in relatively low density plasma.
However, in this narrow region no measurable enhance-ment in CNA due to plasma instability can be detected. In Event 1, the magnitude of the electric field remains small (≤20 mV/m) within the region of CNA. Poleward of this region the arc electric field intensifies to a level of about 50 mV/m and somewhat above. Also, the Tearound 110 km
is increased within this region, and the maximum (500 K above background) is obtained at a point where the electric field is about 50 mV/m but the variance is very large. No significant increase in CNA is observed within this region.
If the wave scattering mechanism would have played a sig-nificant role in these events, the calculated absorption would have been clearly smaller than the measured one. In that case it had been necessary to replace the classical collision fre-quency with an effective collision frefre-quency caused by the collective interaction of electrons with waves.
5 Conclusions
We have presented simultaneous data from optical auroral, cosmic radio noise absorption and plasma parameter mea-surements for two events, 7 December 1999 (Event 1) and 8 April 1998 (Event 2). Our aim was to study whether the
produce the measured absorption bay during the substorm growth phase. The proposed mechanisms to cause absorp-tion are (1) the enhancement of D-region electron density by precipitated energetic electron or protons, (2) the wave scattering of cosmic radio noise due to instabilities in the E-region and/or (3) the effect of the highly enhanced electron temperature in the E-region.
Both of the events studied occurred during the growth phase of an auroral substorm in the evening MLT sector, when a quiet auroral arc and a region of CNA in the vicinity of the arc drifted equatorward. It was shown that the region of the most intense absorption in the absorption bay was lo-cated on the equatorward side and outside of the optical au-roral arc. Both of the events studied were associated with enhanced Nein the D-region, with a maximum between the
altitudes of 80 to 90 km. Event 2 was also associated with an intense electric field and an enhanced electron temperature centered at an altitude of 110 km, on the equatorward side of the arc. The analyzed data show clearly that the effect of both the electric field exceeding 50 mV/m, and the enhanced Teat 110 km altitude with values up to 1700 K, for the total
absorption, is small.
The measured value of the electric field exceeded the threshold value of Farley-Bunemann instability. However, IRIS measured no increase in CNA within the latitudinally narrow region of the high electric field and increased Te.
This is in accordance with the theoretical predictions that field-aligned irregularities are unable to scatter back a sig-nificant amount of cosmic noise (Farley et al., 1981). Our calculations also showed that even though the value of Te
was tripled, it didn’t produce an observable effect on the total absorption by using the equation of nondeviative absorption. Due to the location of the Te enhancement in the E-region,
the effect on the electron-neutral collision frequency remains small. In addition, the enhancement is located in an auroral density cavity, which further decreases its effect. The situa-tion may be different in the dayside, as indicated by observa-tions of Stauning (1984) and Olesen et al. (1986).
As a conclusion, we argue that the absorption observed in the vicinity of auroral arcs during a substorm growth phase, i.e. the absorption bay can entirely be explained by precipita-tion of electrons with energies over 30 keV from the plasma sheet, increases the electron density in the D-region. Acknowledgements. The Imaging Riometer for Ionospheric Studies (IRIS) is operated by the Department of Communications Systems at Lancaster University (UK) in collaboration with the Sodankyl¨a Geophysical Observatory, and funded by the Particle Physics and Astronomy Research Council (PPARC). EISCAT is an International Association funded by France (CNRS), Finland (SA), the federal re-public of Germany (MPG), Japan (NIPR), Norway (NFR), Sweden (NFR) and the United Kingdom (PPARC). The MIRACLE network is operated as an international collaboration under the leadership of the Finnish Meteorological Institute. The IMAGE magnetometer data are collected as a Finnish-German-Norwegian-Polish-Russian-Swedish project. IRF-U, MPAE/Lindau, and CNR-IFSI participate to the data distribution and maintenance of the STARE radar and
all-sky cameras. The Ph. D. work of the first author, J. R. T. Jussila, is funded by Vilho, Yrj¨o and Kalle V¨ais¨al¨a Foundation of Finnish Academy of Science.
Topical Editor M. Lester thanks T. Kikuchi and another referee for their help in evaluating this paper.
References
Aikio A. T., Opgenoorth, H. J., Persson, M. A. L., Kaila, K. U.: Ground-based measurements of an arc-associated electric field, J. Atm. Terr. Phys., 55, 797–808, 1993.
Aikio, A. T., Lakkala, T., Kozlovsky, A., Williams, P. J. S.: Elec-tric fields and currents of stable drifting auroral arcs in the evening sector, J. Geophys. Res., 107. A12, pp. SIA 3–1, DOI 10.1029/2001JA009172, 2002.
Bunemann O.: Excitation of field-aligned sound waves by electrom streams, Phys. Rew. Lett., 10, 285–289, 1963.
Browne, S., Hargreaves, J. K., and Honary, B.: An imaging riome-ter for Ionospheric studies, Electronics and Communication En-gineering Journal, 7(5), 209–217, 1995.
Collis, P. N., Hargreaves, J. K., and White, G. P.: A localised co-rotating auroral absorption event observed near noon using imag-ing riometer and EISCAT, Ann. Geophys., 14, 1305–1316, 1996. D’Angelo, N.: On riometers, J. Geophys. Res., 81, 5581–5582,
1976.
D’Angelo, N.: On high-latitude CNA, F-lacuna and SEC, Ann. Geophys., 34, 51–54, 1978.
D’Angelo, N.: On pulsating cosmic (radio) noise absorption, Ann. Geophys., 37, 417–421, 1981.
Doe R. A., Vickrey, J. F., and Mendillo, M.: Electrodynamic model for the formation of auroral ionospheric cavities, J. Geophys. Res., 100, 9683–9696, 1995.
Farley, A.: A plasma instability resulting field-aligned irregularities in the ionosphere, J. Gephys. Res., 68, 6083–6097, 1963. Farley D. T., Ierkis, H. M., and Fejer, B. G.: The absolute scattering
cross section at 50 MHz of equatorial electrojet irregularities, J. Gephys. Res., 86, 1569–1575, 1981.
Gurevich A. V.: Nonlinear phenomena in the ionosphere, Physics and Chemistry in Space, 10, Springer Verlag, ISBN 0-387-08605-6, 1978.
Haldoupis, C., Schlegel, K., and Nielsen, E.: Some observations of radio auroral backscatter at 140 MHz during E-region electron gas heating, Ann. Geophys., 11, 283–295, 1993.
Hargreaves, J. K., Chivers, H. J. A., and Axford, W. I.: The develop-ment of the substorm in auroral radio absorption, Planet. Space Sci., 23, 905–911, 1975.
Hargreaves, J. K., Chivers, H. J. A., and Nielsen, E.: Properties of spike events in auroral radio absorption, J. Geophys. Res., 84, 4245–4250, 1979.
Hargreaves, J. K.: The solar-terrestrial environment. An introduc-tion to geospace – The science of the terrestrial upper atmo-sphere, ionosphere and magnetoatmo-sphere, Cambridge atmospheric and space science series 5, 5, Cambridge University Press, ISBN 0-521-32748-2, 1992.
Hedin, A. E.: Extension of the MSIS Thermospheric Model into the Middle and Lower Atmosphere, J. Geophys. Res., 96, 1159– 1172, 1991.
Mehta, N. C., and D’Angelo, N.: Cosmic noise “absorption” by E-region plasma waves, J. Geophys. Res., 85, 1779–1782, 1980. Olesen, J. K., Stauning, P., Tsunoda, R. T.: On a unified interpreta-tion of the polar Slant E Condiinterpreta-tion (SEC) and other high E field related phenomena, Radio Science, 21, 127–140, 1986. Opgenoorth, H. J., H¨aggstr¨om, I., Williams, P. J. S., and Jones, G.
O. L.: Regions of strongly enhanced perpendicular electric fields adjacent to auroral arcs, J. Atm. Terr. Phys., 52, 449–458, 1990. Pellinen, R. J., Baumjohann, W., Heikkila, W. J., Sergeev, V. A.,
Ianin, A. G., Melnikov, A. O., and Marklund, G.: Event study on pre-substorm phaes and their relation to the energy coupling between solar wind and magnetosphere, Planet. Space Sci., 30, 371–379, 1982.
Pytte, T., Trefall, H., Kremser, G., Jalonen, L., and Riedler, W.: On the morphology of energetic (≥ 30 keV) electron precipitation during the growth phase of magnetospheric substorms, J. Atm. Terr. Phys, 38, 739–755, 1976.
Ranta, H., Ranta, A., Collis, P. N., and Hargreaves, J. K.: De-velopment of the auroral absorption substorm: Studies of pre-onset phase and sharp pre-onset using an extensive riometer network, Planet. Space Sci., 29, 1287–1313, 1981.
Ranta, A. and Ranta, H.: Development of an auroral absorption substorm, Proc. Conf. achievements of the IMS, ESA SP-217, 299–303, 1984.
Ranta, A., Ranta, H., Turunen, T., Silen, J., and Stauning, P.: High resolution observations of D-region by EISCAT and their com-parison to riometer measurements, Planet. Space Sci., 33, 583– 598, 1985.
Ranta, H., Ranta, A., and Hargreaves, J. K.: Small-scale structure of ionospheric absorption of cosmic noise during pre-onset and sharp onset phases of an auroral absorption substorm, Geophys-ica, 35, 45–57, 1999.
Rishbeth, H., and van Eyken, A. P.: EISCAT; Early history and the first ten years of operation, J. Atm. Terr. Phys., 55, 525–542, 1993.
Sergeev, V. A., Tanskanen, P., Mursula, K., Korth, A., and Elphic, R. C.: Current sheet thickness in the Near-Earth plasma sheet during substorm growth phase, J. Geophys. Res., 95, 3819–3828, 1990.
Siren, J. C.: Do E-region plasma irregularities affect an auroral zone riometer?, J. Geophys. Res., 87, 6271–6280, 1982.
Stauning, P.: Absorption of cosmic noise in the E-region dur-ing electron heatdur-ing events. A new class of riometer absorption events, Geophys. Res. Lett., 11, 1184–1187, 1984.
Stauning, P.: Investigations of ionospheric radio wave absorption processes using imaging riometer techniques, J. Atm. Terr. Phys., 58, 753–764, 1996.
Stoker, P. H., Mathews, M. J., and Scourfield, M. W. J.: Cosmic radio noise absorption related to structres in auroral luminosity, Geophys. Res. Lett., 102, 7439–7447, 1997.
Syrj¨asuo, M. T., Pulkkinen, T.I., Janhunen, P., Viljanen, A., Pelli-nen, R. J., Kauristie, K., Opgenoorth, H. J., Wallman, S., Eglitis, P., Karlsson, P., Amm, O., Nielsen, E., and Thomas, C.: Obser-vations of substorm electrodynamics using the MIRACLE net-work, in Substorms-4, edited by Kokubun, S. and Kamide, Y., Terra Scientific Publishing Company, Tokyo, 111–114, 1998. Williams, P. J. S., Jones, G. O. L., Jones, B. , Opgenoorth, H.,
and H¨aggstr¨om, I.: High-resolution measurements of magneto-spheric electric fields, J. Atm. Terr. Phys., 52, 439–448, 1990.