Don’t Underestimate the Benefits of Being Misunderstood
The MIT Faculty has made this article openly available. Please share
how this access benefits you. Your story matters.
Citation Gibson, Edward et al. “Don’t Underestimate the Benefits of Being Misunderstood.” Psychological Science 28, 6 (April 2017): 703–712 © 2017 The Author(s)
As Published https://doi.org/10.1177/0956797617690277
Publisher Sage Publications
Version Author's final manuscript
Citable link http://hdl.handle.net/1721.1/113024
Terms of Use Creative Commons Attribution-Noncommercial-Share Alike
Don’t underestimate the benefits of being misunderstood
Edward Gibsona, Caitlin Tana, Richard Futrella, Kyle Mahowalda, Lars Koniecznyb, Barbara Hemforthc, Evelina Fedorenkoa,d,e
a Department of Brain and Cognitive Sciences, MIT b University of Freiburg, Center for Cognitive Science
c Le Centre national de la recherche scientifique (CNRS), Université Paris, Diderot d Harvard Medical School
e Massachusetts General Hospital
Corresponding authors:
Edward Gibson, [email protected]
Ev Fedorenko, [email protected]
Manuscript dated December 28, 2016
Word count: 1783 words in Introduction and Discussion (not counting Methods and Results)
Abstract
Being a non-native speaker of a language poses challenges. Individuals often feel embarrassed by the errors they make when talking in their second language (L2). However, here we report an advantage of being an L2 speaker: native speakers give foreign-accented speakers the benefit of the doubt when interpreting their utterances, such that apparently implausible utterances delivered in a foreign accent are more likely to be interpreted in a plausible way. Across three replicated experiments, we demonstrate that native English speakers are more likely to interpret implausible utterances such as “the mother gave the candle the daughter” as similar plausible utterances (“the mother gave the candle to the daughter”) when those utterances are produced with a foreign accent. This result follows from the general model of language interpretation in a noisy channel (Gibson et al., 2013), under the hypothesis that listeners assume a higher error rate in foreign-accented speech.
1. Introduction
Being a non-native speaker of a language poses challenges. Individuals often feel embarrassed by their accents and the errors they make when speaking in their second language (L2) (Gluszek & Dovidio, 2010). Indeed, individuals with foreign accents are perceived to be less credible (Bourdieu, 1991; Lev-Ari & Keysar, 2010; Livingston et al., 2014), less educated (Fraser & Kelly, 2012), less intelligent (Fuertes, Potere & Ramirez, 2002; Anderson et al., 2007), and less hirable (Huang, Frideger & Pearce, 2014). In this work, we find a possible advantage of being an L2 speaker: native speakers give foreign-accented speakers the benefit of the doubt when interpreting their utterances, such that implausible utterances delivered in an foreign accent are more likely to be interpreted in a plausible way.
Recent work has demonstrated that when we understand language, we combine information about what is likely to be communicated – our prior semantic expectations or priors – with information on how messages can get corrupted by noise (Levy, 2008; Levy et al., 2009; Gibson, Bergen & Piantadosi, 2013). Gibson et al. formalize this account in terms of an ideal observer (Marr, 1982; Geisler, 1989) model of language comprehension, where the comprehender engages in Bayesian decoding of the intended meaning:
(1) P(si | sp) ∝ P(si) P(si → sp)
In Equation (1), sp is the sentence perceived by the comprehender and si is the sentence
intended by the producer. The left-hand side, P(si | sp) gives the probability assigned by
the comprehender to any particular hypothesized si given the observed linguistic input sp.
By Bayes rule, this can be re-written as the right-hand side of (1), as a product of the prior probability P(si) that a producer would wish to communicate si, and the likelihood
of the comprehender receiving sp given that the speaker intended si (which is often
notated as P(sp|si)). We write this likelihood as P(si → sp) to make it clear that the
likelihood represents the probability of si being corrupted to sp in the process of
communication. The prior P(si) represents all of the comprehender’s relevant linguistic
constructions and the plausibility of different meanings. This term biases comprehenders towards a priori plausible utterances—things which are likely to be uttered. By trading off between the prior P(si) and the likelihood P(si → sp), comprehenders may arrive at
interpretations which differ from the literal meanings of the specific sentences they perceive.
For example, consider the double-object (DO) / prepositional-phrase object (PO) syntactic alternation in (2):
(2)
a. DO, plausible: The mother gave the daughter the candle. b. PO, plausible: The mother gave the candle to the daughter. c. DO, implausible: The mother gave the candle the daughter. d. PO, implausible: The mother gave the daughter to the candle. e. Question: Did the daughter receive something/someone?
For the plausible versions, (2a) and (2b), the candle is the patient which is given to the daughter, and thus a literal reader should answer “Yes” to the comprehension question in (2e). However, in the implausible versions, (2c) and (2d), the syntax suggests that the daughter is the patient which is given to the candle, a highly implausible event. Thus a reader who relies on the literal meaning suggested by the syntax would answer “No”, whereas a reader who infers that noise has somehow distorted the ordering or inclusion of words in (2c) and (2d) would answer “Yes”.
Importantly, Gibson et al. (2013) further showed that comprehenders are highly sensitive to the overall amount of noise in the signal: as the perceived noise rate
increases, participants rely more on their semantic priors (see also Gibson et al., 2015; Poppels & Levy, 2016). In Gibson et al. (2013), the perceived noise rate was varied by manipulating the number of errors (misspellings, added or deleted words, word swaps, etc.) in the distractor materials. Thus, participants who encountered implausible
statements like (2c) or (2d) in the context of many other sentences containing errors were more likely to infer the more plausible meaning (of the mother giving the candle to the daughter).
Communicating with non-native speakers plausibly leads to high perceived noise rates through a combination of a) our a priori knowledge that non-native speakers are more likely to make syntactic errors, and b) our situation-specific learning of the noise rate of the particular individual we are communicating with. Consistent with this framework, prior work suggests that comprehenders adapt to the higher error rate of L2 speech. For example, Hanulíková et al. (2012) showed that the ERP P600 signature is reduced for syntactic errors in accented speech. If the P600 indexes aspects of correcting errors (Gibson, Stearns et al., 2013), then Hanulíková et al.’s result suggests that listeners are more likely to assume accented speech contains errors as a baseline, with the
consequence that some errors are not corrected. A self-paced reading experiment conducted by Konieczny, Hemforth & Scheepers (1994) in German also comes out as predicted by the noisy-channel framework, although it was not originally discussed in these terms. Participants in Konieczny et al.’s experiment were directed to read the sentences to be presented to them by one of two experimenters: one native German speaker, and one native English speaker who spoke German with an accent. There were N-V-N sequences in the reading materials, which were disambiguated as Object-Verb-Subject by German morphology, but which had equal plausibility to the (ungrammatical) Subject-Verb-Object interpretation. Responses to questions following sentence trials indicated that the participants who were given the instructions by the non-native German experimenter interpreted many of these N-V-N sequences as Subject-Verb-Object – a much more frequent syntactic frame than Object-Verb-Subject – whereas the participants who were given the instructions by the native German experimenter were more likely to interpret them as Object-Verb-Subject. Konieczny et al.’s results therefore suggest that when the experimental participants are interacting with non-native speakers, they are likely to rely more on their syntactic prior for an NVN sequence – the Subject-Verb-Object interpretation – probably because they think that non-native speakers might not know the rare but possible Object-Verb-Subject interpretation.
In the current paper, we test whether the interpretation of sentences with strong world knowledge biases is affected by the accent (or lack thereof) of the speaker. If so, this could provide situations where L2-accent speakers have an advantage over L1-accent speakers in that listeners might be more likely to interpret their implausible utterances in
a more plausible way. That is, a straightforward prediction of the noisy-channel
approach is that when communicating with non-native speakers, comprehenders should give the speaker the benefit of the doubt, and therefore be more likely to rely on their semantic priors in interpreting their utterances, and less likely to interpret utterances strictly literally. We tested this prediction in a language comprehension study consisting of six experiments where participants listened to auditory versions of Gibson et al.’s (2013) implausible materials, like (2c) and (2d), and answered simple comprehension questions, as in (2e). The critical manipulation in each experiment was whether the speaker had a heavy accent (+accent), or no accent. The first three experiments investigate three syntactic alternations from Gibson et al. (2013). The last three
experiments consist of a replication of the first three, with an additional control condition, as described below.
2. Experiments E1-E3
2.1 Methods
Participants. We posted surveys for 960 distinct workers in three experiments consisting
of four groups of 80 workers each, on Amazon.com’s Mechanical Turk using the
Turkolizer software from Gibson, Piantadosi, and Fedorenko (2011). Since we expect the presence of a foreign accent to change participants' perceived noise rates, we use a sample size of 320 participants per experiment, similar to Experiment 2 from Gibson, Bergen & Piantadosi (2013), which found an effect of increased perceived noise rate in 300 participants.1 All participants were paid for their participation. Participants were
asked to indicate their native language and country of origin, but payment was not contingent on their responses to these questions. In order to constrain the population to American English speakers, we restricted the IP addresses to those in the US.
Furthermore, we filtered participants who indicated either that their native language was not English or that they were not originally from the US. These restrictions caused the elimination of 75 participants’ data across the three experiments. In addition, we only
1 Furthermore, the replication experiments E4-E6 used the same number of participants / experiment, and
analyzed data from participants who answered at most one survey (they were instructed to fill out only one, but occasionally a participant would fill out 2 or more) and who answered at least 75% of the questions for the 60 filler sentences correctly (the mean across participants and experiments was over 90% before excluding these participants). These restrictions caused the elimination of a further 45 participants’ data across the three experiments, leaving 840 participants across experiments for analyses (an average of 280 participants / experiment, corresponding to an average of 70 participants / list).
Design and materials. There were three between-participant experiments (corresponding
to three syntactic alternations, as discussed below), each crossing accent (+accent, no-accent) with the speaker of the materials (speaker 1, speaker 2). To counterbalance the identity of the speaker, each set of target items was produced by two speakers, in two versions: speaker 1 (Idan Blank, from Israel) spoke the materials in near-native English, and with a strong Israeli accent; and speaker 2 (Nezar Abdenur, from Canada, but with expertise as an actor speaking in many accents) spoke the materials in native English, and with a strong Hindi accent. These target materials were combined with the filler materials produced by the other speaker recorded with no accent, for a total of 4 versions of each experiment: i) speaker 1 +accent, speaker 2 fillers, ii) speaker 1 no-accent, speaker 2 fillers, iii) speaker 2 +accent, speaker 1 fillers, and iv) speaker 2 no-accent, speaker 1 fillers. Thus any difference that we observe cannot be due to the particular speaker.
The three experiments corresponded to three syntactic alternations from Gibson et al. (2013): the double-object (DO) / prepositional phrase object (PO) alternation, as in (2); the transitive / intransitive alternation, as in (3); and the active / passive alternation, as in (4). Only implausible versions were used in Experiments E1-E3, as in (2c,d) (above), (3c,d) and (4c,d):
(3)
a. (not used in E2; used in E5)
transitive, plausible: The tax law benefited the businessman. b. (not used in E2; used in E5)
c. transitive, implausible: The businessman benefited the tax law.
d. intransitive, implausible: The tax law benefited from the businessman. (4)
a. (not used in E3; used in E6)
active, plausible: The girl kicked the ball. b. (not used in E3; used in E6)
passive, plausible: The ball was kicked by the girl. c. active, implausible: The ball kicked the girl.
d. passive, implausible: The girl was kicked by the ball.
For the implausible materials, Gibson et al. found that participants made more inferences to the plausible interpretation for the DO/PO and transitive/intransitive alternations, compared to the active/passive alternation. In contrast, even in the presence of noise (errors) in the filler materials, participants interpreted the implausible active and passive constructions literally most of the time. Gibson et al. hypothesized that this difference between the DO/PO and transitive/intransitive constructions on the one hand vs. the active/passive constructions on the other was due to the noise likelihood. In particular, only one edit (addition or deletion of a function word) is needed to get from an
implausible DO/PO or transitive/intransitive construction to a more plausible alternative, whereas two edits are needed to get from an implausible active or passive construction to a more plausible alternative. Because fewer edits are required, a noise process is more likely to corrupt a plausible DO/PO utterance to an implausible one, than it is to corrupt a plausible active/passive utterance to an implausible one. If our noise manipulation
(+accent / no-accent) follows the pattern of Gibson et al.’s results, we may find an effect of accent for the DO/PO and transitive/intransitive constructions but not for the
active/passive constructions.
We used the 20 items from each of these three alternations from Gibson et al. (2013)’s materials, along with their 60 filler items to generate our auditory materials. The two speakers also produced the 60 filler items in native / near-native English. The
+accent / no-accent versions of one speaker’s target materials were combined with the 60 filler items spoken by the other speaker. All materials are available at osf.io/7c9bw .
Procedure
For each of the twelve sub-experiments (3 constructions x 4 versions each, as described above), we created two experimental lists. Each list contained the fillers and half of the target items, which were distributed between the lists following a Latin Square design. Each participant received one list, and the order of trials was randomized for each participant. All participants then read the following simple instructions:
This is a set of 80 auditory sentences. Answer the questions immediately following, according to what you think the speaker intended.
There was a single yes-no question following each item, e.g., (2e), (3e) and (4e): (2e) Question: Did the daughter receive something/someone?
(3e) Question: Did the girl kick something/someone? (4e) Question: Did the tax law benefit from anything?
Participants’ answers to the questions following the target implausible materials provided strong cues as to whether they interpreted the sentences literally (implausibly) or inferred the more plausible meaning.
It took approximately 10-15 minutes for each participant to complete the task.
Evaluating the comprehensibility of the materials
Our critical measure is how often participants interpreted implausible items as their corresponding more plausible alternatives in the +accent condition compared to the no-accent condition. Our hypothesis is that participants would make a high-level inference about the likely meaning based on the rate of noise in L2 vs. L1 speech. However, a higher rate of plausibility-based interpretations in the +accent condition could result for a
less interesting reason: perhaps participants simply cannot discern the words in the utterance and are answering at random and/or rely on the plausibility of the event based on the partial information in the question. To test whether participants could accurately perceive the content of our +accent materials, we performed a norming experiment.
An additional 480 Mechanical Turk participants were asked to transcribe what each speaker said, even if it was implausible, across four surveys: 120 participants for the implausible target sentences from each of Speaker 1 and Speaker 2, for each of their +accent and no-accent productions. For each of the four surveys, the 60 target items (20 items, with two versions each, as in (2c) and (2d) x 3 syntactic alternations) were divided across two lists, so that each participant did 60 transcriptions. Because we wanted to match the information that these participants got and the information that the participants in the critical experiment would receive, the target sentences were presented alongside the accompanying questions.
The transcriptions were coded for differences from the intended sentence in two ways: (a) whether a content word was misheard (e.g., “was in” instead of “worsened”; “boy” instead of “ball”); and (b) whether a function word was added or deleted in order to arrive at a more plausible alternative (e.g., “The mother gave the candle to the daughter” instead of “The mother gave the candle the daughter”). A small number of recordings proved difficult for participants to understand, leading to inaccurate transcriptions on more than 50% of trials. For example, the word “worsened” was
transcribed as “was in” by over half of the participants for one speaker’s +accent version. These recordings (a total of 6 item/condition/speaker/accent combinations out of the 480 total recordings) were omitted from later analyses.2 Furthermore, because we were most interested in inferences that participants made when hearing an implausible sentence (not ones that were misheard initially), we also omitted from later analyses
item/condition/speaker/accent combinations that contained errors in their function-word transcriptions on over 20% of the trials, resulting in a further 6 recordings being omitted,
2 The results were qualitatively the same with or without these omissions. All relevant inferential statistics
result in similar effect sizes and similar significance test levels. Furthermore, the results were qualitatively the same when more item/condition/speaker/accent combinations were filtered (with the corresponding effect that differences in error rates on remaining data were almost eliminated). For example, if we filter item/condition/speaker/accent combinations with error rates of 10% or more, then all relevant inferential statistics still result in similar effect sizes and similar significance test levels.
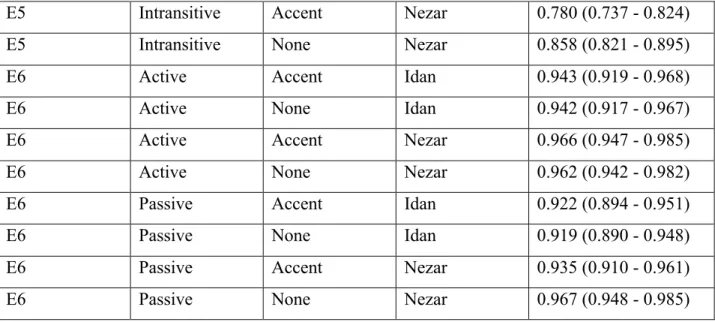
leaving 468 (97.5%) item/condition/speaker/accent recordings to be analyzed in the critical experiment. The transcription error rates across conditions (see Table SI-1) show that the function word transcription error rates are all below 2% for all but the DO materials, and these have an error rate of only 3.4% (no-accent) and 5.9% (+accent). Thus, the inference rates observed in the critical experiment for the DO/PO and
transitive/intransitive constructions, which are between 12.9% (intransitive, no-accent) and 64.2% (DO, +accent) (see Figure 1) cannot be explained by difficulties with discerning the utterance.
2.2 Results
Participants correctly answered comprehension questions for the filler sentences at a rate of 93% across experiments, varying between 91% and 96%, suggesting that participants were performing the required task. Our critical measure is how often participants
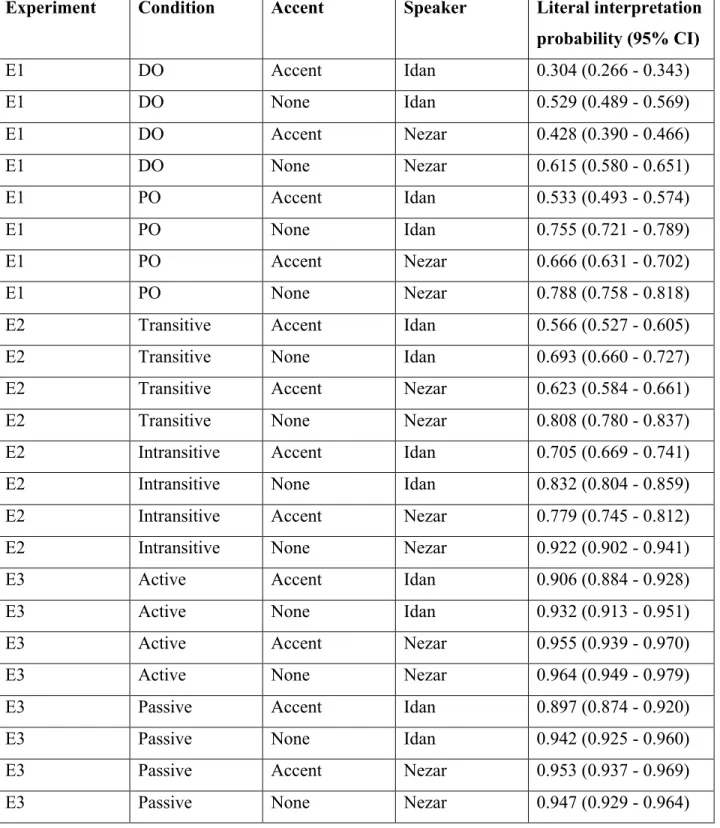
interpreted implausible items as their corresponding more plausible alternatives in the +accent, compared to the no-accent condition. The means across conditions with confidence intervals, collapsing across speakers, are presented in Figure 1. The means across conditions, including speakers, are presented in Table 1.
Figure 1. Percent of literal interpretations across the Experiments E1-E3. Lower
Experiment Condition Accent Speaker Literal interpretation probability (95% CI) E1 DO Accent Idan 0.304 (0.266 - 0.343) E1 DO None Idan 0.529 (0.489 - 0.569) E1 DO Accent Nezar 0.428 (0.390 - 0.466) E1 DO None Nezar 0.615 (0.580 - 0.651) E1 PO Accent Idan 0.533 (0.493 - 0.574) E1 PO None Idan 0.755 (0.721 - 0.789) E1 PO Accent Nezar 0.666 (0.631 - 0.702) E1 PO None Nezar 0.788 (0.758 - 0.818)
E2 Transitive Accent Idan 0.566 (0.527 - 0.605)
E2 Transitive None Idan 0.693 (0.660 - 0.727)
E2 Transitive Accent Nezar 0.623 (0.584 - 0.661)
E2 Transitive None Nezar 0.808 (0.780 - 0.837)
E2 Intransitive Accent Idan 0.705 (0.669 - 0.741)
E2 Intransitive None Idan 0.832 (0.804 - 0.859)
E2 Intransitive Accent Nezar 0.779 (0.745 - 0.812)
E2 Intransitive None Nezar 0.922 (0.902 - 0.941)
E3 Active Accent Idan 0.906 (0.884 - 0.928)
E3 Active None Idan 0.932 (0.913 - 0.951)
E3 Active Accent Nezar 0.955 (0.939 - 0.970)
E3 Active None Nezar 0.964 (0.949 - 0.979)
E3 Passive Accent Idan 0.897 (0.874 - 0.920)
E3 Passive None Idan 0.942 (0.925 - 0.960)
E3 Passive Accent Nezar 0.953 (0.937 - 0.969)
E3 Passive None Nezar 0.947 (0.929 - 0.964)
We analyzed the experiments using sum-coded mixed-effect logistic regressions (Gelman & Hill, 2007) with intercepts for participants and items, as well as slopes for accent (+accent, no-accent) and construction (e.g., DO/PO, transitive/intransitive, ative/passive) for both participants and items in the random effect structure. The active-passive experiment (Experiment 3) did not converge with slopes in the random effect structure, but none of the critical main effects were close to significant in any analysis that we tried. This is likely because the means were close to ceiling in this experiment. Each experiment consisted of eight sub-experiments: 2 constructions (e.g., DO, PP) x 2 accent conditions (+accent, no-accent) x 2 speakers (speaker 1, speaker 2). See Tables SI-2 – SI-4 for full tables associated with the model results that we report here.
There was a reliable main effect of speaker in Experiments 1 and 2 such that participants made more plausibility-based inferences for speaker 1 than speaker 2
(Experiment 1 - DO/PO: β=0.71; p = .01; Experiment 2 - transitive/intransitive: β=0.77; p = .0007). This effect was non-significant for Experiment 3. These main effects may simply mean that speaker 1 had a stronger accent than speaker 2, which plausibly led to a greater perceived noise rate.
As predicted by the noisy-channel hypothesis, the rate of literal interpretation was lower for the +accent conditions for the DO/PO and transitive/intransitive constructions (Experiment 1 - DO/PO: β=1.41; p < .0001; Experiment 2 - transitive/intransitive:
β=1.16; p < .0001). There was also an effect of construction in Experiment 1 (β=1.65; p < .0001), such that people made more plausibility-based inferences in the DO construction, and in Experiment 2 (β=1.27; p = .0005), such that people made more plausibility-based inferences in the transitive construction. These within-experiment between-construction differences (DO vs. PO; transitive vs. intransitive) replicate Gibson et al. (2013), who argued that people make more plausibility-based inferences in conditions where the implausible version could be generated from the plausible alternative via a deletion of a function word than in conditions where the implausible version would require an insertion. In Experiment 3 (active/passive constructions), we found that accent had no reliable effect (β=0.85; p = .12). This result is parallel to results from Gibson et al., who found no effect on perceived noise rate in active/passive constructions, as manipulated by
the inclusion of errors in the filler materials. Finally, we found no difference in inference rate between the active and passive constructions (β=0.29; p = .19), also replicating the results from Gibson et al. There were no reliable interactions in any of the models.
3. Experiments 4-6: Replications
A helpful reviewer (Kristin Lemhöfer) suggested that our effects might be driven in part by the lack of plausible target materials spoken by the accented speaker. Consequently, we ran a replication of all three experiments with plausible control materials spoken by the target speaker. That is, the designs of these three experiments were identical to those of Experiments E1 - E3, except that each set of target materials had four conditions: the two implausible conditions, and two plausible ones, as in (2a,b), (3a,b) and (4a,b).
3.1 Methods
Participants. We posted surveys for 960 additional workers in three experiments
consisting of four groups of 80 workers each, on Amazon.com’s Mechanical Turk using the software from Gibson, Piantadosi, and Fedorenko (2011), all distinct from
participants who took part in the other experiments reported here. All participants were paid for their participation. Participants were asked to indicate their native language and country of origin, but payment was not contingent on their responses to these questions. In order to constrain the population to American English speakers, we restricted the IP addresses to those in the US. Furthermore, we filtered participants who indicated either that their native language was not English or that they were not originally from the US. These restrictions caused the elimination of 69 participants’ data across the three
experiments. In addition, we only analyzed data from participants who answered at least 75% of the questions for the 60 filler sentences correctly (the mean across participants and experiments was over 90% before excluding these participants). These restrictions caused the elimination of a further 84 participants’ data across the three experiments,
leaving 807 participants across experiments for analyses (an average of 269 participants / experiment, corresponding to an average of 67 participants / list).
Design and materials. As in Experiments E1-E3, there were three between-participant
experiments each crossing accent (+accent, no-accent) with the speaker of the materials (speaker 1, speaker 2). Experiments E4-E6 corresponded to the three syntactic
alternations in Experiments E1-E3. Unlike Experiments E1-E3, both plausible and implausible versions were used in Experiments E4-E6. We used the same 20 items from each of Experiments E1-E3 (along with their 60 filler items), but now broken into a 2x2 design, crossing construction and plausibility. The +accent / no-accent versions of one speaker’s target materials were combined with the 60 filler items spoken by the other speaker.
Procedure
The procedure was identical to that of E1-E3.
3.2 Results
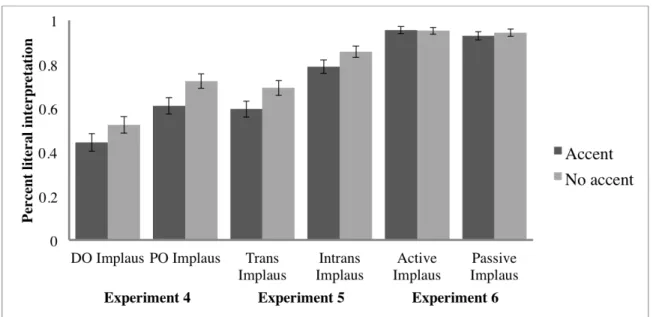
Participants correctly answered comprehension questions for the filler sentences at a rate of 93% across experiments, varying between 92% and 94%, suggesting that participants were performing the required task. The means across conditions with confidence
intervals, collapsing across speakers, are presented in Figure 2. The means across conditions, including speakers, are presented in Table 2.
Figure 2. Percent of literal interpretations across Experiments E4-E6. Lower
percentages indicate more inferences of the more plausible interpretation.
Experiment Condition Accent Speaker Literal interpretation probability (95% CI) E4 DO Accent Idan 0.390 (0.333 - 0.447) E4 DO None Idan 0.514 (0.459 - 0.569) E4 DO Accent Nezar 0.489 (0.435 - 0.543) E4 DO None Nezar 0.532 (0.482 - 0.583) E4 PO Accent Idan 0.579 (0.523 - 0.635) E4 PO None Idan 0.710 (0.661 - 0.760) E4 PO Accent Nezar 0.638 (0.587 - 0.688) E4 PO None Nezar 0.735 (0.690 - 0.780)
E5 Transitive Accent Idan 0.540 (0.487 - 0.594)
E5 Transitive None Idan 0.689 (0.641 - 0.737)
E5 Transitive Accent Nezar 0.647 (0.598 - 0.696)
E5 Transitive None Nezar 0.696 (0.647 - 0.744)
E5 Intransitive Accent Idan 0.797 (0.754 - 0.840)
E5 Intransitive Accent Nezar 0.780 (0.737 - 0.824)
E5 Intransitive None Nezar 0.858 (0.821 - 0.895)
E6 Active Accent Idan 0.943 (0.919 - 0.968)
E6 Active None Idan 0.942 (0.917 - 0.967)
E6 Active Accent Nezar 0.966 (0.947 - 0.985)
E6 Active None Nezar 0.962 (0.942 - 0.982)
E6 Passive Accent Idan 0.922 (0.894 - 0.951)
E6 Passive None Idan 0.919 (0.890 - 0.948)
E6 Passive Accent Nezar 0.935 (0.910 - 0.961)
E6 Passive None Nezar 0.967 (0.948 - 0.985)
Table 2. Likelihood of literal interpretation across Experiments E4-E6.
The results of these replications were very similar to the results of Experiments E1-E3. As in E1-E3, we analyzed the three experiments using sum-coded mixed-effect logistic regressions (Gelman & Hill, 2007), with intercepts for both participants and items, as well as slopes for accent (+accent, no-accent) and construction (e.g., DO/PO, transitive/intransitive, active/passive) for both participants and items in the random effect structure for each model. Each experiment consisted of eight sub-experiments: 2
constructions (e.g., DO, PP) x 2 accent conditions (+accent, no-accent) x 2 speakers (speaker 1, speaker 2). See Table SI-5 – SI-7 for full tables associated with the model results that we report here.
As predicted by the noisy-channel hypothesis, the rate of literal interpretation was lower for the +accent conditions for the DO/PO and transitive/intransitive constructions (Experiment 1 - DO/PO: β=0.68; p = .008; Experiment 2 - transitive/intransitive: β=0.60; p = .002). There was also an effect of construction in Experiment 1 (β=1.31; p < .0001), such that people made more plausibility-based inferences in the DO construction, and in Experiment 2 (β=1.28; p = .0003), such that people made more plausibility-based inferences in the transitive construction. These within-experiment between-construction differences (DO vs. PO; transitive vs. intransitive) again replicate Gibson et al. (2013). In Experiment 3 (active/passive constructions), we found that accent had no reliable effect
(β=0.17; p = .68). This result is also parallel to results from Gibson et al. Finally, we found a small difference in inference rate between the active and passive constructions (β=0.46; p = .03) such that people made more inferences for the actives than passives. This is in the direction as predicted by the deletion / insertion asymmetry, but this
particular result is hard to interpret given the proximity of both conditions to ceiling (95% vs. 93% literal interpretations). There were no reliable interactions in any of the models.
4. Discussion
Inspired by a recent re-conceptualization of high-level language interpretation as a combination of our knowledge of a) what is likely to be communicated (priors), and b) how messages can get corrupted by noise during communication (e.g., Levy, 2008; Levy et al. 2009; Gibson et al., 2013), we here examined the processing of accented speech. Gibson et al. previously showed that increasing the perceived noise rate in the linguistic input (by adding errors) led comprehenders to rely more strongly on their semantic priors. We tested whether a similar increase in plausibility-based inferences would occur for accented speech. Indeed, across four constructions, we observed more plausibility-based inferences (approximately 10%) for sentences produced with an accent. Furthermore, we also showed that experimental participants can correctly transcribe exactly what was spoken almost all the time. Thus our results suggest that, under certain circumstances, people may be more likely to give a non-native speaker a benefit of the doubt in
interpreting their utterances: people will assume a speaker with a foreign accent has more knowledge relative to what they literally say than a non-accented speaker.
It is an interesting open question whether all accents are equally likely to induce plausibility-based inferences like the ones discussed here. In our experiments, there were only two speakers: one who spoke English natively, and who could speak English with a Hindi accent well; and a near-native speaker of English who could speak English with an Israeli accent. There was no main effect of speaker in our experiments: listeners made approximately the same inferences for each speaker. But it is possible that listeners would make more or fewer plausibility-based inferences depending on their sociolinguistic perception of the speaker, relative to their dialect of English. Future work should
investigate these sociolinguistic consequences, varying both the target language (English in the current case) and the accented languages.
How can our results be reconciled with the observations that foreign accent speakers are often attributed less credibility, intelligence and education? In terms of meaning interpretation, when one (erroneously) produces an incorrect / implausible sentence, there appears to be an advantage of being an L2 compared to a native speaker because the utterance will be re-interpreted. But this also comes with the disadvantage of being perceived as ‘syntactically unstable’ – native speakers also expect the L2 speaker to make syntactic errors and are not very surprised by them (Hanulíková et al., 2012), which in turn might give rise to the perception of reduced intelligence and credibility.
But still, while previous work has shown disadvantages for speakers with foreign accents, the results reported here suggests an advantage to having a foreign accent, in a particular situation. Imagine you are in a situation where you want to appear
knowledgeable about a domain, but are in fact uncertain about it, perhaps at a cocktail party where you want to make business connections. If you say something implausible or wrong, the person that you are talking with may think less of you for your confusion. It would be advantageous for you if your implausible statement were interpreted as a more plausible similarly sounding alternative. We demonstrate that such favorable
misinterpretations are much more likely for non-native speakers. In the words of Arianna Huffington, “I moved to New York in 1980 and met Henry Kissinger, who told me not to worry about my accent, because you can never, in American public life, underestimate the advantages of complete and total incomprehensibility.” (Smith College
5. References
Anderson, A., Downs, S. D., Faucette, K., Griffin, J., King, T., & Woolstenhulme, S. (2007). How Accents Affect Perception of Intelligence, Physical Attractiveness, and Trustworthiness. BYU Undergraduate Journal of Psychology, 3, 5-11. Bourdieu, P., & Thompson, J. B. (1991). Language and symbolic power. Harvard
University Press.
Clayards, M., Tanenhaus, M. K., Aslin, R. N., & Jacobs, R. A. (2008). Perception of speech reflects optimal use of probabilistic speech cues. Cognition, 108(3), 804-809.
Fraser, C., & Kelly, B. (2012). Listening between the lines: Social assumptions around foreign accents. Australian Review of Applied Linguistics, 35(1).
Fuertes, J. N., Potere, J. C., & Ramirez, K. Y. (2002). Effects of speech accents on interpersonal evaluations: implications for counseling practice and research. Cultural Diversity and Ethnic Minority Psychology, 8(4), 346.
Geisler, W.S. (1989). Sequential ideal-observer analysis of visual discriminations. Psychological Review, 96, 267-314.
Gibson, E., Bergen, L. & Piantadosi, S.T. (2013). The rational integration of noisy evidence and prior semantic expectations in sentence interpretation. Proceedings of the National Academy of Sciences U.S.A., 110(20), 8051-8056.
Gibson, E., Stearns, L., Bergen, L., Eddy, M. & Fedorenko, E. (2013). The P600 indexes rational error correction within a noisy-channel model of human communication. Talk presented at the CUNY Sentence Processing conference, Columbia, SC. Gibson, E., Sandberg, C., Fedorenko, E., Bergen, L., & Kiran, S. (2015). A rational
inference approach to aphasic language comprehension. Aphasiology, 1-20. Gluszek, A. & Dovidio, J. F. (2010). The way they speak: a social psychological
perspective on the stigma of non-native accents in communication. Personality and Social Psychology Review.
Hanulíková, A., Van Alphen, P. M., Van Goch, M. M., & Weber, A. (2012). When one person's mistake is another's standard usage: The effect of foreign accent on
Huang, L., Frideger, M., & Pearce, J. L. (2014). How non-native speakers can crack the glass ceiling. Harvard business review, 92(6), 27-28.
Konieczny, L., Scheepers, C., and Hemforth, B. (1994). Reanalyses vs. internal repairs: non- monotonic processes in sentence reanalysis vs. internal repairs. In Hemforth, B., Konieczny, L., Scheepers, C., and Strube, G. (editors), First Analysis,
Reanalysis and Repair, pp. 1-21. IIG-Berichte 8, University of Freiburg. Lev-Ari, S., & Keysar, B. (2010). Why don't we believe non-native speakers? The
influence of accent on credibility. Journal of Experimental Social Psychology, 46(6), 1093-1096.
Levy, R. (2008) A noisy-channel model of rational human sentence comprehension under uncertain input. Proceedings of the 13th Conference on Empirical Methods in Natural Language Processing (Association for Computational Linguistics, Stroudsburg, PA), pp. 234–243.
Levy, R., Bicknell, K., Slattery, T., & Rayner, K. (2009). Eye movement evidence that readers maintain and act on uncertainty about past linguistic input. Proceedings of the National Academy of Sciences, 106(50), 21086-21090.
Livingston, B. A., Schilpzand, P., & Erez, A. (2014). Not What You Expected to Hear Accented Messages and Their Effect on Choice. Journal of Management, 0149206314541151.
Marr, D. (1982). Vision. W.H. Freeman and Company, New York.
Poppels, T. & Levy, R. (2016). Structure-sensitive noise inference: comprehenders expect exchange errors. Proceedings of the 38th Annual Meeting of the Cognitive Science Society.
Acknowledgements
We thank: Idan Blank and Nezar Abdenur for producing the materials; Caitlyn Hoeflin for recording the materials; Roger Levy, Alex Paunov, and Rachel Ryskin, and the reviewers for Psychological Science – Kristin Lemhöfer and an anonymous reviewer – for their helpful comments. The work was supported by grants from (a) the National Science Foundation Linguistics Program, Award 1534318 to EG; (b) the Simons
Foundation to the Simons Center for the Social Brain at MIT; and (c) the Brain &
Language Research Institute grant 11-LABX-0036; and (d) A*MIDEX grant ANR-11-IDEX-0001-02.
Supplementary Information
Condition Accent Content word
errors Function word errors DO +accent 4.5% 5.7% DO no-accent 1.9% 3.3% PO +accent 7.2% 1.1% PO no-accent 3.9% 0.4% Transitive +accent 3.0% 0.8% Transitive no-accent 0.6% 1.2% Intransitive +accent 3.9% 0.3% Intransitive no-accent 1.0% 0.3% Active +accent 4.3% 0.0% Active no-accent 2.4% 0.4% Passive +accent 3.4% 0.0% Passive no-accent 1.6% 0.0%
Table SI-1. Transcription error rates, broken down into content word errors and function
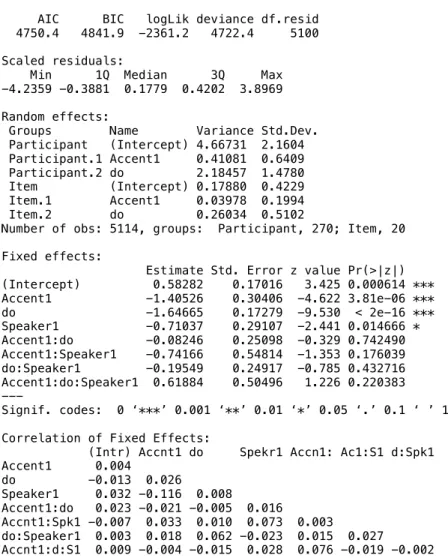
## DO, with interaction with Speaker1
Generalized linear mixed model fit by maximum likelihood (Laplace Approximation) ['glmerMod']
Family: binomial ( logit )
Formula: Correct ~ Accent1 * do * Speaker1 + (1 | Participant) + (0 + Accent1 | Participant) + (0 + do | Participant) + (1 | Item) + (0 + Accent1 | Item) + (0 + do | Item)
Data: dopodata
Control: glmerControl(optimizer = "optimx", optCtrl = list(method = "nlminb")) AIC BIC logLik deviance df.resid
4750.4 4841.9 -2361.2 4722.4 5100 Scaled residuals:
Min 1Q Median 3Q Max -4.2359 -0.3881 0.1779 0.4202 3.8969 Random effects:
Groups Name Variance Std.Dev. Participant (Intercept) 4.66731 2.1604 Participant.1 Accent1 0.41081 0.6409 Participant.2 do 2.18457 1.4780 Item (Intercept) 0.17880 0.4229 Item.1 Accent1 0.03978 0.1994 Item.2 do 0.26034 0.5102
Number of obs: 5114, groups: Participant, 270; Item, 20 Fixed effects:
Estimate Std. Error z value Pr(>|z|) (Intercept) 0.58282 0.17016 3.425 0.000614 *** Accent1 -1.40526 0.30406 -4.622 3.81e-06 *** do -1.64665 0.17279 -9.530 < 2e-16 *** Speaker1 -0.71037 0.29107 -2.441 0.014666 * Accent1:do -0.08246 0.25098 -0.329 0.742490 Accent1:Speaker1 -0.74166 0.54814 -1.353 0.176039 do:Speaker1 -0.19549 0.24917 -0.785 0.432716 Accent1:do:Speaker1 0.61884 0.50496 1.226 0.220383 --- Signif. codes: 0 ‘***’ 0.001 ‘**’ 0.01 ‘*’ 0.05 ‘.’ 0.1 ‘ ’ 1 Correlation of Fixed Effects:
(Intr) Accnt1 do Spekr1 Accn1: Ac1:S1 d:Spk1 Accent1 0.004 do -0.013 0.026 Speaker1 0.032 -0.116 0.008 Accent1:do 0.023 -0.021 -0.005 0.016 Accnt1:Spk1 -0.007 0.033 0.010 0.073 0.003 do:Speaker1 0.003 0.018 0.062 -0.023 0.015 0.027 Accnt1:d:S1 0.009 -0.004 -0.015 0.028 0.076 -0.019 -0.002
Table SI-2. Generalized Linear Mixed Effect Regression model for Experiment 1,
DO-PO materials, with 3 sum-coded factors: Accent, do (DO vs. DO-PO), and Speaker. This model includes intercepts for both participants and items, as well as slopes for accent (+accent, no-accent) and construction (DO/PO) for both participants and items in the random effect structure for each model.
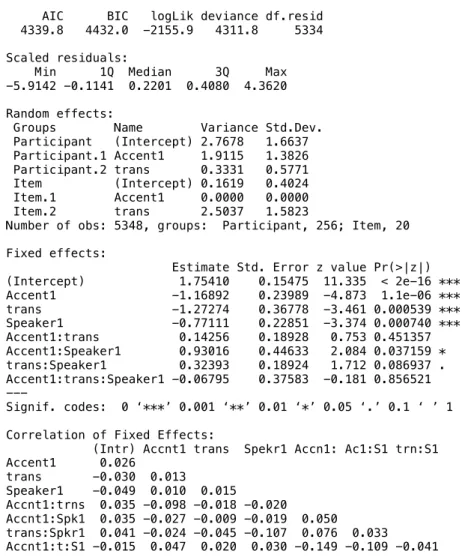
## trans, with interactions with Speaker1
Generalized linear mixed model fit by maximum likelihood (Laplace Approximation) ['glmerMod']
Family: binomial ( logit )
Formula: Correct ~ Accent1 * trans * Speaker1 + (1 | Participant) + (0 + Accent1 | Participant) + (0 + trans | Participant) + (1 |
Item) + (0 + Accent1 | Item) + (0 + trans | Item) Data: transintransdata
Control: glmerControl(optimizer = "optimx", optCtrl = list(method = "nlminb")) AIC BIC logLik deviance df.resid
4339.8 4432.0 -2155.9 4311.8 5334 Scaled residuals:
Min 1Q Median 3Q Max -5.9142 -0.1141 0.2201 0.4080 4.3620 Random effects:
Groups Name Variance Std.Dev. Participant (Intercept) 2.7678 1.6637 Participant.1 Accent1 1.9115 1.3826 Participant.2 trans 0.3331 0.5771 Item (Intercept) 0.1619 0.4024 Item.1 Accent1 0.0000 0.0000 Item.2 trans 2.5037 1.5823
Number of obs: 5348, groups: Participant, 256; Item, 20 Fixed effects:
Estimate Std. Error z value Pr(>|z|) (Intercept) 1.75410 0.15475 11.335 < 2e-16 *** Accent1 -1.16892 0.23989 -4.873 1.1e-06 *** trans -1.27274 0.36778 -3.461 0.000539 *** Speaker1 -0.77111 0.22851 -3.374 0.000740 *** Accent1:trans 0.14256 0.18928 0.753 0.451357 Accent1:Speaker1 0.93016 0.44633 2.084 0.037159 * trans:Speaker1 0.32393 0.18924 1.712 0.086937 . Accent1:trans:Speaker1 -0.06795 0.37583 -0.181 0.856521 --- Signif. codes: 0 ‘***’ 0.001 ‘**’ 0.01 ‘*’ 0.05 ‘.’ 0.1 ‘ ’ 1 Correlation of Fixed Effects:
(Intr) Accnt1 trans Spekr1 Accn1: Ac1:S1 trn:S1 Accent1 0.026 trans -0.030 0.013 Speaker1 -0.049 0.010 0.015 Accnt1:trns 0.035 -0.098 -0.018 -0.020 Accnt1:Spk1 0.035 -0.027 -0.009 -0.019 0.050 trans:Spkr1 0.041 -0.024 -0.045 -0.107 0.076 0.033 Accnt1:t:S1 -0.015 0.047 0.020 0.030 -0.149 -0.109 -0.041
Table SI-3. Generalized Linear Mixed Effect Regression model for Experiment 2,
transitive-intransitive materials, with 3 factors: Accent, trans, and Speaker. This model includes intercepts for both participants and items, as well as slopes for accent (+accent, no-accent) and construction (transitive/intransitive) for both participants and items in the random effect structure for each model.
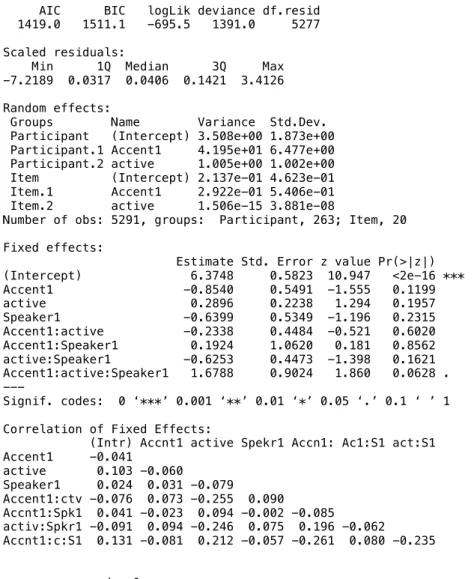
## active, with interactions with Speaker1
Generalized linear mixed model fit by maximum likelihood (Laplace Approximation) ['glmerMod']
Family: binomial ( logit )
Formula: Correct ~ Accent1 * active * Speaker1 + (1 | Participant) + (0 + Accent1 | Participant) + (0 + active | Participant) + (1 |
Item) + (0 + Accent1 | Item) + (0 + active | Item) Data: actpassdata
Control: glmerControl(optimizer = "optimx", optCtrl = list(method = "nlminb")) AIC BIC logLik deviance df.resid
1419.0 1511.1 -695.5 1391.0 5277 Scaled residuals:
Min 1Q Median 3Q Max -7.2189 0.0317 0.0406 0.1421 3.4126 Random effects:
Groups Name Variance Std.Dev. Participant (Intercept) 3.508e+00 1.873e+00 Participant.1 Accent1 4.195e+01 6.477e+00 Participant.2 active 1.005e+00 1.002e+00 Item (Intercept) 2.137e-01 4.623e-01 Item.1 Accent1 2.922e-01 5.406e-01 Item.2 active 1.506e-15 3.881e-08
Number of obs: 5291, groups: Participant, 263; Item, 20 Fixed effects:
Estimate Std. Error z value Pr(>|z|) (Intercept) 6.3748 0.5823 10.947 <2e-16 *** Accent1 -0.8540 0.5491 -1.555 0.1199 active 0.2896 0.2238 1.294 0.1957 Speaker1 -0.6399 0.5349 -1.196 0.2315 Accent1:active -0.2338 0.4484 -0.521 0.6020 Accent1:Speaker1 0.1924 1.0620 0.181 0.8562 active:Speaker1 -0.6253 0.4473 -1.398 0.1621 Accent1:active:Speaker1 1.6788 0.9024 1.860 0.0628 . --- Signif. codes: 0 ‘***’ 0.001 ‘**’ 0.01 ‘*’ 0.05 ‘.’ 0.1 ‘ ’ 1 Correlation of Fixed Effects:
(Intr) Accnt1 active Spekr1 Accn1: Ac1:S1 act:S1 Accent1 -0.041 active 0.103 -0.060 Speaker1 0.024 0.031 -0.079 Accent1:ctv -0.076 0.073 -0.255 0.090 Accnt1:Spk1 0.041 -0.023 0.094 -0.002 -0.085 activ:Spkr1 -0.091 0.094 -0.246 0.075 0.196 -0.062 Accnt1:c:S1 0.131 -0.081 0.212 -0.057 -0.261 0.080 -0.235 convergence code: 0
Parameters or bounds appear to have different scalings. This can cause poor performance in optimization.
It is important for derivative free methods like BOBYQA, UOBYQA, NEWUOA.
Table SI-4. Generalized Linear Mixed Effect Regression model for Experiment 3,
active-passive materials, with 3 factors: Accent, active, and Speaker. This model includes intercepts for both participants and items, as well as slopes for accent (+accent, no-accent) and construction (active/passive) for both participants and items in the random
> do2.fit <- glmer(Correct ~ Accent1 * do * Speaker1 + + (1| Participant) + + (0 + Accent1| Participant) + + (0 + do| Participant) + + (1| Item) + + (0 + Accent1| Item) + + (0 + do | Item) + , data=dopodata, family="binomial" + , control = glmerControl(optimizer= c("optimx", "bobyqa"), + optCtrl = list(method="nlminb"))) > summary(do2.fit)
Generalized linear mixed model fit by maximum likelihood (Laplace Approximation) ['glmerMod']
Family: binomial ( logit )
Formula: Correct ~ Accent1 * do * Speaker1 + (1 | Participant) + (0 +
Accent1 | Participant) + (0 + do | Participant) + (1 | Item) + (0 + Accent1 | Item) + (0 + do | Item)
Data: dopodata
Control: glmerControl(optimizer = c("optimx", "bobyqa"), optCtrl = list(method = "nlminb"))
AIC BIC logLik deviance df.resid 2892.8 2975.1 -1432.4 2864.8 2619 Scaled residuals:
Min 1Q Median 3Q Max -4.1650 -0.5269 0.2242 0.5242 2.8046 Random effects:
Groups Name Variance Std.Dev. Participant (Intercept) 3.02612 1.7396 Participant.1 Accent1 1.45342 1.2056 Participant.2 do 0.64083 0.8005 Item (Intercept) 0.40556 0.6368 Item.1 Accent1 0.08368 0.2893 Item.2 do 0.16340 0.4042
Number of obs: 2633, groups: Participant, 280; Item, 20 Fixed effects:
Estimate Std. Error z value Pr(>|z|) (Intercept) 0.5160 0.1889 2.732 0.00629 ** Accent1 -0.6803 0.2553 -2.665 0.00770 ** do -1.3085 0.1507 -8.683 < 2e-16 *** Speaker1 -0.3360 0.2464 -1.363 0.17275 Accent1:do 0.1989 0.2325 0.855 0.39228 Accent1:Speaker1 -0.4538 0.4933 -0.920 0.35756 do:Speaker1 -0.1369 0.2314 -0.591 0.55424 Accent1:do:Speaker1 -0.2523 0.4633 -0.545 0.58604 --- Signif. codes: 0 ‘***’ 0.001 ‘**’ 0.01 ‘*’ 0.05 ‘.’ 0.1 ‘ ’ 1 Correlation of Fixed Effects:
(Intr) Accnt1 do Spekr1 Accn1: Ac1:S1 d:Spk1 Accent1 0.021 do -0.019 0.032 Speaker1 0.023 0.002 0.011 Accent1:do 0.019 -0.020 0.022 0.007 Accnt1:Spk1 -0.001 0.036 0.007 0.036 0.005 do:Speaker1 0.005 0.007 0.068 -0.019 -0.004 0.024
Accnt1:d:S1 0.003 0.005 -0.008 0.024 0.082 -0.019 0.030
Table SI-5. Generalized Linear Mixed Effect Regression model for Experiment 4,
DO-PO materials, with 3 sum-coded factors: Accent, do (DO vs. DO-PO), and Speaker. This model includes intercepts for both participants and items, as well as slopes for accent (+accent, no-accent) and construction (DO/PO) for both participants and items in the random effect structure for each model.
> trans.fit <- glmer(Correct ~ Accent1 * trans * Speaker1 + + (1| Participant) + + (0 + Accent1| Participant) + + (0 + trans| Participant) + + (1| Item) + + (0 + Accent1 | Item)
+ + (0 + trans | Item), data=transintransdata, family="binomial" + , control = glmerControl(optimizer= c("bobyqa")))
> summary(trans.fit)
Generalized linear mixed model fit by maximum likelihood (Laplace Approximation) ['glmerMod']
Family: binomial ( logit )
Formula: Correct ~ Accent1 * trans * Speaker1 + (1 | Participant) + (0 + Accent1 | Participant) + (0 + trans | Participant) + (1 |
Item) + (0 + Accent1 | Item) + (0 + trans | Item) Data: transintransdata
Control: glmerControl(optimizer = c("bobyqa")) AIC BIC logLik deviance df.resid 2686.3 2769.4 -1329.2 2658.3 2777 Scaled residuals:
Min 1Q Median 3Q Max -4.2585 -0.3614 0.2894 0.4509 4.5046 Random effects:
Groups Name Variance Std.Dev. Participant (Intercept) 1.13220 1.0641 Participant.1 Accent1 2.36365 1.5374 Participant.2 trans 0.20616 0.4541 Item (Intercept) 0.27586 0.5252 Item.1 Accent1 0.03764 0.1940 Item.2 trans 2.27831 1.5094
Number of obs: 2791, groups: Participant, 281; Item, 20 Fixed effects:
Estimate Std. Error z value Pr(>|z|) (Intercept) 1.5096 0.1555 9.706 < 2e-16 *** Accent1 -0.6046 0.1969 -3.070 0.002142 ** trans -1.2772 0.3569 -3.579 0.000345 *** Speaker1 -0.1810 0.1915 -0.945 0.344703 Accent1:trans -0.1116 0.2194 -0.509 0.610863 Accent1:Speaker1 -0.2449 0.3831 -0.639 0.522645 trans:Speaker1 -0.4193 0.2188 -1.916 0.055343 . Accent1:trans:Speaker1 -0.7054 0.4374 -1.613 0.106765 --- Signif. codes: 0 ‘***’ 0.001 ‘**’ 0.01 ‘*’ 0.05 ‘.’ 0.1 ‘ ’ 1 Correlation of Fixed Effects:
(Intr) Accnt1 trans Spekr1 Accn1: Ac1:S1 trn:S1 Accent1 -0.024 trans -0.040 0.010 Speaker1 -0.003 0.030 0.001 Accnt1:trns 0.008 -0.096 -0.015 -0.002 Accnt1:Spk1 0.013 0.005 0.001 -0.016 -0.004 trans:Spkr1 -0.013 0.000 0.004 -0.098 0.029 0.016 Accnt1:t:S1 -0.008 -0.003 0.010 0.016 0.004 -0.099 -0.036
Table SI-6. Generalized Linear Mixed Effect Regression model for Experiment 5,
transitive-intransitive materials, with 3 factors: Accent, trans, and Speaker. No
interactions with Speaker were included in the model. This model includes intercepts for both participants and items, as well as slopes for accent (+accent, no-accent) and
construction (transitive/intransitive) for both participants and items in the random effect structure for each model.
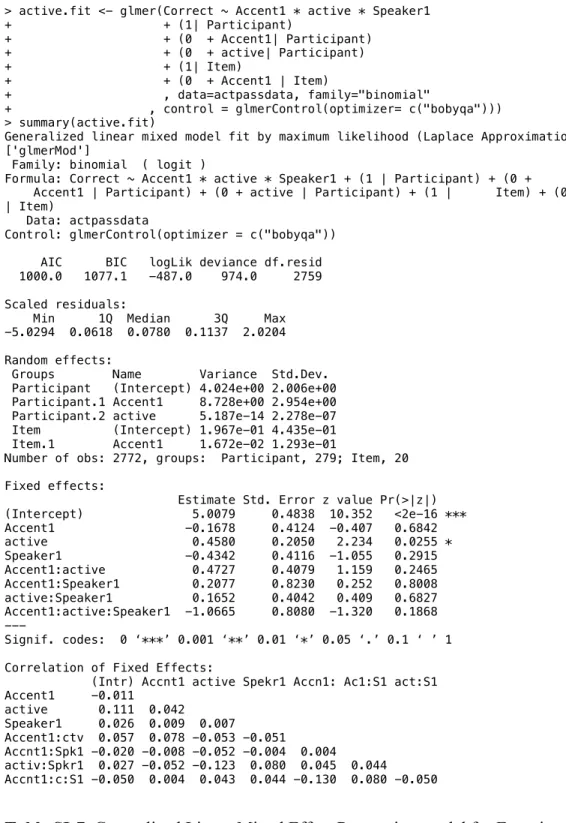
> active.fit <- glmer(Correct ~ Accent1 * active * Speaker1 + + (1| Participant) + + (0 + Accent1| Participant) + + (0 + active| Participant) + + (1| Item) + + (0 + Accent1 | Item) + , data=actpassdata, family="binomial"
+ , control = glmerControl(optimizer= c("bobyqa"))) > summary(active.fit)
Generalized linear mixed model fit by maximum likelihood (Laplace Approximation) ['glmerMod']
Family: binomial ( logit )
Formula: Correct ~ Accent1 * active * Speaker1 + (1 | Participant) + (0 +
Accent1 | Participant) + (0 + active | Participant) + (1 | Item) + (0 + Accent1 | Item)
Data: actpassdata
Control: glmerControl(optimizer = c("bobyqa")) AIC BIC logLik deviance df.resid 1000.0 1077.1 -487.0 974.0 2759 Scaled residuals:
Min 1Q Median 3Q Max -5.0294 0.0618 0.0780 0.1137 2.0204 Random effects:
Groups Name Variance Std.Dev. Participant (Intercept) 4.024e+00 2.006e+00 Participant.1 Accent1 8.728e+00 2.954e+00 Participant.2 active 5.187e-14 2.278e-07 Item (Intercept) 1.967e-01 4.435e-01 Item.1 Accent1 1.672e-02 1.293e-01
Number of obs: 2772, groups: Participant, 279; Item, 20 Fixed effects:
Estimate Std. Error z value Pr(>|z|) (Intercept) 5.0079 0.4838 10.352 <2e-16 *** Accent1 -0.1678 0.4124 -0.407 0.6842 active 0.4580 0.2050 2.234 0.0255 * Speaker1 -0.4342 0.4116 -1.055 0.2915 Accent1:active 0.4727 0.4079 1.159 0.2465 Accent1:Speaker1 0.2077 0.8230 0.252 0.8008 active:Speaker1 0.1652 0.4042 0.409 0.6827 Accent1:active:Speaker1 -1.0665 0.8080 -1.320 0.1868 --- Signif. codes: 0 ‘***’ 0.001 ‘**’ 0.01 ‘*’ 0.05 ‘.’ 0.1 ‘ ’ 1 Correlation of Fixed Effects:
(Intr) Accnt1 active Spekr1 Accn1: Ac1:S1 act:S1 Accent1 -0.011 active 0.111 0.042 Speaker1 0.026 0.009 0.007 Accent1:ctv 0.057 0.078 -0.053 -0.051 Accnt1:Spk1 -0.020 -0.008 -0.052 -0.004 0.004 activ:Spkr1 0.027 -0.052 -0.123 0.080 0.045 0.044 Accnt1:c:S1 -0.050 0.004 0.043 0.044 -0.130 0.080 -0.050
Table SI-7. Generalized Linear Mixed Effect Regression model for Experiment 6,
active-passive materials, with 3 factors: Accent, active, and Speaker. This model includes intercepts for both participants and items, as well as slopes for accent (+accent, no-accent) and construction (active/passive) for both participants and items in the random effect structure for each model.
![[PDF] Apprendre la programmation python sous QGIS | Cours informatique](data:image/gif;base64,R0lGODlhAQABAIAAAP///wAAACH5BAEAAAAALAAAAAABAAEAAAICRAEAOw==)