HAL Id: hal-02966389
https://hal.archives-ouvertes.fr/hal-02966389
Submitted on 14 Oct 2020
HAL is a multi-disciplinary open access
archive for the deposit and dissemination of
sci-entific research documents, whether they are
pub-lished or not. The documents may come from
teaching and research institutions in France or
abroad, or from public or private research centers.
L’archive ouverte pluridisciplinaire HAL, est
destinée au dépôt et à la diffusion de documents
scientifiques de niveau recherche, publiés ou non,
émanant des établissements d’enseignement et de
recherche français ou étrangers, des laboratoires
publics ou privés.
Tracing metal sources for the giant McArthur River
Zn-Pb deposit (Australia) using lead isotopes
Joséphine Gigon, Etienne Deloule, Julien Mercadier, David Huston, Antonin
Richard, Irvine Annesley, Andrew Wygralak, Roger Skirrow, Terrence
Mernagh, Kristian Masterman
To cite this version:
Joséphine Gigon, Etienne Deloule, Julien Mercadier, David Huston, Antonin Richard, et al.. Tracing
metal sources for the giant McArthur River Zn-Pb deposit (Australia) using lead isotopes. Geology,
Geological Society of America, 2020, 48 (5), pp.478-482. �10.1130/G47001.1�. �hal-02966389�
Manuscript received 13 September 2019 Revised manuscript received 16 December 2019 Manuscript accepted 20 December 2019
https://doi.org/10.1130/G47001.1
© 2020 The Authors. Gold Open Access: This paper is published under the terms of the CC-BY license.
CITATION: Gigon, J., et al., 2020, Tracing metal sources for the giant McArthur River Zn-Pb deposit (Australia) using lead isotopes: Geology, v. 48, p. 478–482, https://doi.org/10.1130/G47001.1
Published online 27 February 2020
Tracing metal sources for the giant McArthur River Zn-Pb
deposit (Australia) using lead isotopes
Joséphine Gigon
1*, Etienne Deloule
2, Julien Mercadier
1, David L. Huston
3, Antonin Richard
1, Irvine R. Annesley
1,
Andrew S. Wygralak
4, Roger G. Skirrow
3, Terrence P. Mernagh
5and Kristian Masterman
61 Université de Lorraine, CNRS, GeoRessources, Campus Aiguillettes, rue Jacques Callot BP 70239, 54506 Vandoeuvre-lès-Nancy,
France
2 Centre de Recherches Pétrographiques et Géochimiques (CRPG), UMR 7358 CNRS-UL, 15 rue Notre Dame des Pauvres,
F-54501 Vandœuvre-lès-Nancy, France
3 Geoscience Australia, GPO Box 378, Canberra, ACT 2601, Australia
4 Northern Territory Geological Survey, PO Box 2901, Darwin, NT 0801, Australia
5 Research School of Earth Sciences, Australian National University, Acton, ACT2601, Australia 6 Glencore Australia Holdings Pty Ltd, 1 Macquarie Place, Sydney, NSW2000, Australia
ABSTRACT
Giant hydrothermal ore deposits form where fluids carrying massive amounts of metals scavenged from source rocks or magmas encounter conditions favorable for their localized deposition. However, in most cases, the ultimate origin of metals remains highly disputed. Here, we show for the first time that two metal sources have provided, in comparable amounts, the 8 Mt of lead of the giant McArthur River zinc-lead deposit (McArthur Basin, Northern Territory, Australia). By using high-resolution secondary ion mass spectrometry (SIMS) analysis of lead isotopes in galena, we demonstrate that the two metal sources were repeat-edly involved in the metal deposition in the different ore lenses ca. 1640 Ma. Modeling of lead isotope fractionation between mantle and crustal reservoirs implicates felsic rocks of the crystalline basement and the derived sedimentary rocks in the basin as the main lead sources that were leached by the ore-forming fluids. This sheds light on the crucial importance of metal tracing as a prerequisite to constrain large-scale ore-forming systems, and calls for a paradigm shift in the way hydrothermal systems form giant ore deposits: leaching of metals from several sources may be key in accounting for their huge metal tonnage.
INTRODUCTION
More than a thousand giant ore deposits worldwide are recognized as containing ex-ceptional accumulations of metals in restricted volumes (i.e., they store the metals equivalent in 1011 tons of continental crust in mean crustal
or “Clarke” concentration; Laznicka, 2014). Hy-drothermal ore deposits are a specific class of metallic deposits that form by a combination of (1) metal extraction from a source rock or magma by a hydrothermal fluid, (2) metal trans-port by a hydrothermal fluid from the source to a focused discharge where metals precipitate and accumulate, and (3) metal precipitation and ac-cumulation (e.g., McCuaig and Hronsky, 2014).
Giant hydrothermal ore deposits form only when all of these processes are adequately combined in space and time (e.g., Richards, 2013) and when the volume of metalliferous fluid is suf-ficient. While the conditions for metal transport and precipitation are relatively well understood, thanks to, among others, fluid inclusion studies and metal speciation and mineral solubility ex-periments (e.g., Richard et al., 2012), the con-ditions under which metals are extracted from their source, and more specifically the nature of the metal sources, are still the most disputed aspect of many ore-deposit models (e.g., Pettke et al., 2010). Several factors may underlie this controversy: (1) metal sources may occur at great distance from the ore deposit and may be hidden (e.g., Harlaux et al., 2018); (2) metal
sources typically have large volumes but low concentrations of metal, meaning that the mass-balance studies required to demonstrate large-scale metal mobilization are highly challeng-ing (e.g., Pitcairn et al., 2006); (3) a schalleng-ingle ore deposit may form from several metal sources (e.g., Mercadier et al., 2013); and (4) fluid mix-ing may play a role in subsequent dilution of the geochemical signature of the primary metal source(s).
In order to address the number and the nature of metal source(s) involved with the formation of a true giant hydrothermal ore deposit, we have targeted the McArthur River zinc-lead deposit (Northern Territory, Australia) and carried out a detailed in situ Pb isotope study of galena. This widely used method is a powerful tool for tracing metal sources and ages based on model ages because it combines three radioactive de-cay systems (238U → 206Pb, 235U → 207Pb, and 232Th → 208Pb; e.g., Deloule et al., 1986).
GEOLOGICAL SETTING
The McArthur River Zn-Pb deposit is one of many giant hydrothermal ore deposits of the sediment-hosted massive sulfide (SHMS) category (e.g., Large et al., 1998; Leach et al., 2010). This deposit is situated in the Paleopro-terozoic to MesoproPaleopro-terozoic McArthur Basin, which unconformably overlies Paleoproterozoic crystalline basement units (Fig. 1; Fig. DR1 in the GSA Data Repository1). This is one of
the many giant ore deposits of the so-called *E-mail: [email protected]
1GSA Data Repository item 2020140, description of the parameters used for optical and scanning electron microscopy and secondary ion mass spectrometry; an
extended discussion and an explanation of the different models presented in the main text; data tables; and supplemental figures, is available online at http://www. geosociety.org/datarepository/2020/, or on request from [email protected].
“Carpentaria zinc belt” in the Northern Territory and Queensland (Large et al., 1998; McGold-rick et al., 2010) and one of the most impor-tant Zn-Pb deposits in the world (as of June 2019: 172 Mt at 9.9% Zn, 4.6% Pb, 47 g/t Ag; NTGS, 2019). The McArthur River deposit is located 2 km west of the Emu fault, a major 10-km-deep crustal structure (Rawlings et al., 2004) that potentially acted as a fluid conduit for upward migration of 150–250 °C, oxidized, metal- and sulfate-rich basinal fluids (Cooke et al., 2000) in a sinistral strike-slip regime (Mc-Goldrick et al., 2010). The eight ore lenses of the McArthur River deposit occur within the Pyritic Shale Member of the Barney Creek For-mation, dated at 1639 ± 2 Ma (Page and Sweet, 1998), which acted as a reduced geochemical trap for metal precipitation (Cooke et al., 2000). Most authors consider the formation of the McArthur River deposit as syn-sedimentary or sub-contemporaneous to the deposition of the upper Barney Creek Formation, and therefore consider 1639 ± 2 Ma as a reasonable estimate of the age of metal deposition (Huston et al., 2006; Kunzmann et al., 2019).
SAMPLING AND ANALYTICAL METHODS
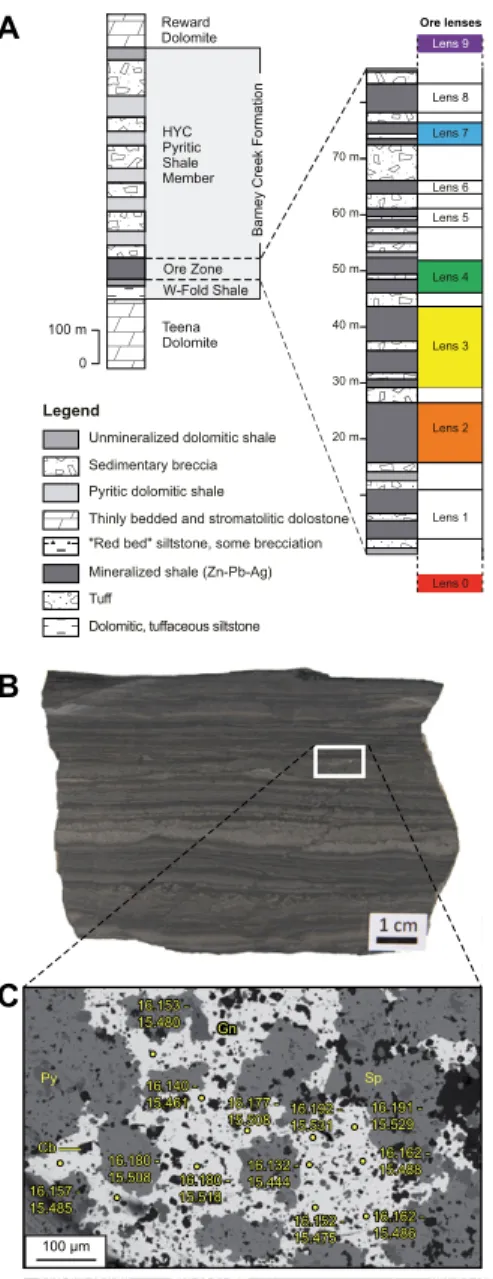
Samples span most of the ore sequence at the McArthur River mine site (16.436° S, 136.098° E, Geocentric Datum of Australia 1994) and are from four of the eight ore lenses and so-called
lens 0 and 9, two sub-economic lenses located just below and above the main ore sequence, respectively (Fig. 2). Petrographic investigation by reflected-light optical microscopy and scan-ning electron microscopy (SEM) shows that ores consist of sphalerite-galena-pyrite–rich bands interlayered with mudstones and quartz-carbonate turbidites (Fig. 2; Large et al., 1998). Galena crystals 50 µm to 1 mm in size are typi-cally poikilitic and contain numerous ∼10 µm inclusions of pyrite, sphalerite, and minor sili-cates and carbonates. No growth, recrystalli-zation, zoning, or alteration textures in galena were highlighted. Detailed mineral mapping using SEM was carried out in order to select the most favorable zones within galena grains (i.e., galena devoid of mineral inclusions) for
in situ Pb isotope analyses. The lead isotopes were measured by secondary ion mass spec-trometry (SIMS) with a radiofrequency source whose analytical capacity allows an excellent sensitivity and a high spatial resolution with a spot size of 10 µm. Analytical methods are detailed in the Data Repository.
RESULTS
The ranges of 206Pb/204Pb, 207Pb/204Pb, and 208Pb/204Pb ratios are 16.10–16.22, 15.43–15.57,
and 35.42–36.57 respectively (Fig. 3; Table DR1). In a 207Pb/204Pb versus 206Pb/204Pb
dia-gram, the data are distributed along a line whose slope is 1.42 with a mean square weighted
devi-ation (MSWD) of 4.1 (Fig. 3). Slopes are simi-lar within the analytical error for the different lenses (Fig. DR2). Lenses 0, 3, 4, and 9 show a similar distribution of 206Pb/204Pb and 207Pb/204Pb
ratios with modes around 16.2 and 15.55 re-spectively, whereas lens 2 shows modes around 16.16 and 15.49, respectively. The Pb isotope
Figure 1. Simplified geo-logical map of McArthur Basin (Northern Ter-ritory, Australia), with identification of major lithostratigraphic units: crystalline basement, McArthur Basin, and more recent sedimentary cover (Ahmad et al., 2013). Major faults and fault zones are indicated, including the Emu fault near the McAr-thur River Zn-Pb deposit. Other Zn-Pb deposits and prospects are indicated. WA—Western Australia; NT—Northern Territory; QL—Queensland; SA— S o u t h A u s t r a l i a ; NSW—New South Wales.
0 100 km Arafura Sea Gulf of Carpentaria McArthur Basin Northern Territory Queens-land Emu Fault
Batten Fault Zone
Tawallah Fault 16°S
12°S
133°E 134°E 135°E 136°E
Urapunga Inlier Scrutton Inlier
Basin (Paleoproterozoic to Mesoproterozoic) Basement (Paleoproterozoic)
Cover (Neoproterozoic to Cenozoic) Other Zn-Pb deposits/prospects
Fault zones
McArthur River Zn-Pb deposit
NT WA SA NSW QL Murphy Inlier 100 µm Gn Sp Py 16.180 16.152 16.153 -15.480 16.192 -15.531 16.177 -15.508 16.140 -15.461 16.157 -15.485 16.180 -15.508 16.180 -15.518 16.132 -15.444 16.152 - 15.475 16.191 -15.529 16.162 - 15.488 16.162 -15.486 16.153 -15.480 16.162 16.192 -15.531 16.177 -15.508 16.140 -15.461 16.157 -15.485 16.180 -15.508 16.180 - 16.132 -15.444 15.518 16.152 - 15.475 16.191 -15.529 16.162 - 15.488 16.162 -15.486 Cb Cb
A
C
B
70 m 60 m 50 m 40 m 30 m 20 m Ore lenses Lens 8 Lens 7 Lens 6 Lens 5 Lens 4 Lens 3 Lens 2 Lens 1 LegendUnmineralized dolomitic shale Sedimentary breccia Pyritic dolomitic shale
Thinly bedded and stromatolitic dolostone "Red bed" siltstone, some brecciation Mineralized shale (Zn-Pb-Ag) Tuffff
Dolomitic, tuffaceous siltstone 100 m 0 Reward Dolomite HYC Pyritic Shale Member Ore Zone W-Fold Shale Teena Dolomite
Barney Creek Formation
Lens 0 Lens 9
Figure 2. Stratigraphy of sample location in the McArthur River Zn-Pb deposit (North-ern Territory, Australia) and description of a typical sample. (A) Simplified stratigraphic succession of the McArthur River deposit with locations of different ore lenses (Large et al., 1998). Sampled ore lenses (0, 2, 3, 4, 7, and 9) are identified by different colors. (B) Hand sample from lens 2 with sulfide-rich laminae. (C) Backscattered electron scanning micros-copy image of sulfide-rich lamina showing texture of galena (Gn, white), sphalerite (Sp, light gray), pyrite (Py, dark gray), and carbon-ate (Cb, black) and size and emplacement of in situ Pb isotope analyses by secondary ion mass spectrometry (SIMS). For each SIMS spot, Pb isotopic ratios are indicated as fol-lows: 206Pb/204Pb - 207Pb/204Pb.
ratios exhibit similar variations at the grain and lens scales (e.g., 206Pb/204Pb values of 16.192
and 16.132 for analytical spots 100 µm apart in a single grain; Figs. DR3–DR8). Previous Pb isotope compositions measured on mixed sulfides by thermal ionization mass spectrom-etry (TIMS) are clustered in the lower range of the 206Pb/204Pb, 207Pb/204Pb, and 208Pb/204Pb
values obtained in this study (Fig. DR9). Al-though they are compatible within error with the present data, they represent a mixed signature of several grains. The novelty here is that the
in situ SIMS analyses have a high petrographic resolution and reveal the full range of Pb iso-tope compositions.
DISCUSSION
Repeated Mixing between Two Lead Sources
The line along which all of the lead isotope data are distributed is discordant to isochrons linking rocks and minerals with the same mod-el age (Fig. 3; Stacey and Kramers, 1975; Sun et al., 1996). The most simple explanation is that the data lie along a mixing line between two distinct Pb sources corresponding to two end members of the data distribution that we name, respectively, lead source 1 (207Pb/204Pb > 15.56
and 206Pb/204Pb > 16.21) and lead source 2
(207Pb/204Pb < 15.46 and 206Pb/204Pb < 16.14;
Fig. 3). Assuming that (1) the two lead sources have compositions similar to those of the ex-tremes of the mixing line and (2) the data are representative of the Pb isotopic composition of the ore fluid at the time of sulfide deposition, the relative contributions from the two sources can be calculated. Considering the modes of
207Pb/204Pb and 206Pb/204Pb ratios in each lens,
the relative proportion of Pb derived from each source in the different ore lenses is between 38% and 83% for lead source 1 and between 17% and 62% for lead source 2 (Fig. DR2). Thus, both Pb sources have been repeatedly involved in the formation of the different ore lenses, and their relative proportions are of the same order of magnitude.
Isotope Evolution Models for Lead Sources Models of Pb lead isotope fractionation and evolution between the mantle and crustal reser-voirs, together with existing chronostratigraphic constraints in the investigated area, are helpful in identifying the nature of lead sources 1 and 2. The usual local model for the North Austra-lian craton is based on the global “continuous growth-of-µ” model (where µ represents the
238U/204Pb ratio of a given reservoir; Cumming
and Richards, 1975), and uses Pb isotope ra-tios obtained by TIMS at the McArthur River deposit as a control point for the 1640 Ma iso-chron (Fig. DR9; Sun et al., 1996). However, because the new in situ SIMS data presented here show considerably more scattering com-pared to previously obtained bulk TIMS data, the local model should now be treated with caution. Alternative models are proposed and discussed below (see Fig. 4, and the Data Re-pository, for details).
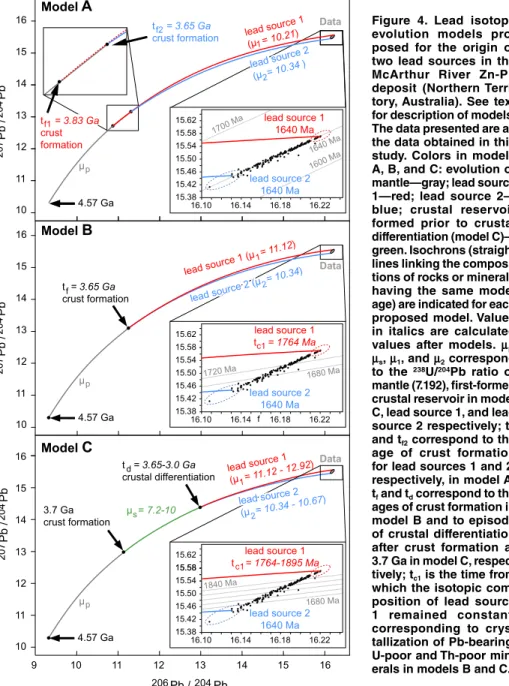
The objective of the tested models is to ac-count for distinct evolution of lead sources 1 and 2 which were both leached by the ore-forming fluids at ca. 1640 Ma, by adjusting the number and timing of crust formation and differentiation events, the age of crystallization of Pb-bearing minerals, as well as the µ values of the differ-ent Pb reservoirs. Because the composition of
lead source 2 lies close to the 1640 Ma isochron of the usual global and local models (Fig. 3; Stacey and Kramers, 1975; Sun et al., 1996), we rely on the reasonable assumption that lead source 2 corresponds to a crustal reservoir that has evolved isotopically through 238U, 235U, and 232Th decay until the time of the McArthur River
deposit formation (ca. 1640 Ma). Model A as-sumes that the model age of both lead sources is 1640 Ma. Back-calculation indicates the ex-traction of a crustal reservoir from the mantle at 3.83 Ga that evolved toward the composition of lead source 1 (µ1 = 10.21), followed at 3.65 Ga
by the extraction of another crustal reservoir from the mantle that evolved toward the com-position of lead source 2 (µ2= 10.34; Fig. 4A).
Model B assumes a single episode of extrac-tion of two crustal reservoirs from the mantle. These two reservoirs evolved toward the com-positions of lead sources 1 and 2 respectively (Fig. 4B). Back-calculation indicates that this episode would have occurred at 3.65 Ga, which, in turn, imposes µ1 = 11.12 and µ2 = 10.34, and
that Pb isotope evolution of lead source 1 would have ceased at 1764 Ma (i.e., was devoid of U and Th to avoid the production of radiogenic Pb). Model C assumes an initial extraction of a crustal reservoir from the mantle at 3.7 Ga, followed by an episode of differentiation into two crustal reservoirs that evolved toward the compositions of lead sources 1 and 2 respec-tively (Fig. 4C). Back-calculation indicates that crustal differentiation would have occurred be-tween 3.65 and 3.0 Ga, which, in turn, imposes that Pb isotope evolution of lead source 1 would have ceased between 1895 and 1764 Ma, with µ1
ranging between 11.12 and 12.92 and µ2 ranging
between 10.34 and 10.67.
Potential Candidates for Lead Sources It is noteworthy that all scenarios require elevated µ values (between 10.2 and 12.92) for the crustal reservoirs in order to account for the compositions of lead sources 1 and 2, ruling out mafic volcanics from the McArthur Basin as a plausible Pb source for the McArthur River deposit (e.g., Stacey and Kramers, 1975; Cooke et al., 1998; Hofmann, 2007). Models B and C require that lead source 1 would have stopped evolving isotopically between ca. 1895 and 1764 Ma. This would be possible if lead source 1 consisted of galena or Pb-bearing feld-spar crystallized within this age span. However, only small galena deposits of this age are known in the basin or basement in the area, and no felsic igneous rocks are recorded in the area between 1815 (oldest age in the basin) and 1730 Ma (Ah-mad et al., 2013). Therefore, according to Model C, lead source 1 should belong to or be derived from the youngest basement felsic units by ero-sion and sedimentation. Lead sources 1 and 2 could actually belong to separate units, or to the same unit if, in the latter, Pb was alternatively
Figure 3. Lead isotope composition of galena from the McArthur River Zn-Pb deposit (North-ern Territory, Australia). In situ secondary ion mass spectrometry data from different ore lenses are identified by distinct colors as in Figure 2, and plotted with 1σ error bars. Slope of line along which all analyses plot and position of ellipses corre-sponding to the probable ratios of lead sources 1 and 2 are shown ( c o n f — c o n f i d e n c e ; MSWD—mean square weighted deviation). Iso-chrons (straight lines linking compositions of rocks or minerals having same model age) from dif-ferent models (solid lines: Sun et al., 1996, dashed lines: Stacey and Kram-ers, 1975) are indicated.
lead source 2 Lens 9 Lens 7 Lens 4 Lens 3 Lens 2 Lens 0 206Pb /204Pb 15.38 16.10 16.12 16.14 16.16 16.18 16.20 16.22 1600 Ma 20 7Pb / 204 Pb 15.40 15.42 15.44 15.46 15.48 15.50 15.52 15.54 15.56 15.58 15.60 1700 Ma 1640 Ma 1700 Ma 1640 Ma 1600 Ma lead source 1 Slope = 1.42± 0.02 (95% conf) MSWD = 4.1
leached from feldspar only or from all Pb-bear-ing minerals includPb-bear-ing accessory uranium- and thorium-rich minerals. Several anorogenic fel-sic intrusive and volcanic units in the crystal-line basement are plausible candidates for lead sources 1 and 2 because they meet the age con-straints from the above models and have vertical (>1 km) and lateral extents that could poten-tially account for the Pb budget of the McArthur River deposit (Table DR3). This includes the ca. 1850 Ma Cliffdale and Scrutton volcanics located in the Murphy and Scrutton inliers re-spectively (Fig. 1). Those anorogenic felsic units were likely among the sources of felsic-derived sediments in the McArthur Basin such as the black shales of the Barney Creek Formation, clastic units within carbonate-evaporite succes-sions, or the regionally extensive and permeable conglomerates and sandstones in the basal units
of the McArthur Basin where framework altera-tion of detrital feldspar is documented (David-son, 1998; Polito et al., 2011).
CONCLUSION
Altogether, our in situ SIMS Pb isotope data and isotope modeling provide, for the first time, a strong support for the previous assumption that the Pb-rich products of anorogenic felsic magmatism contributed to the Pb sources for some giant Proterozoic Zn-Pb deposits world-wide (Sawkins, 1989). More generally, our work shows that if forming a giant hydrothermal ore deposit requires mobilizing metals from sev-eral sources, the current models for scales, ge-ometries, and dynamics of ore-forming hydro-thermal systems should be revised. In turn, this would have a major impact on the estimation of metal endowment and exploration strategies in
world-class metallogenic provinces, because the volume of metal sources and their metal concen-tration define the total amount of metals avail-able for ore deposits.
ACKNOWLEDGMENTS
The Northern Territory Geological Survey provided logistical support for sampling. Glencore Austra-lia Holdings Pty Ltd and the McArthur River mine geologists team provided authorization and guid-ance for sampling. The Ion Probe Team Nancy (France; CRPG-CNRS) provided technical sup-port during SIMS analyses. The Service Commun de Microscopie Electronique et de Microanalyses (GeoRessources laboratory, University of Lor-raine, France) provided technical support during SEM analyses. This research was funded by (1) a French Ministry of Higher Education and Research Ph.D. salary grant to Gigon; (2) a Région Lor-raine–FEDER grant to Mercadier, “Rôle des phases fluides dans la distribution spatiale des ressources métalliques dans les bassins sédimentaires paléo-proterozoiques australiens”; (3) Observatoire des Sciences de l’Univers (OSU) OTELo grants to Mer-cadier, “Conditions de transport des métaux dans un mégabassin protérozoïque”, and Richard, “Trans-ferts de fluides et métaux dans le bassin de McArthur (Australie)”; and (4) CNRS-INSU-CESSUR grants to Mercadier “Transferts des fluides et métaux dans les méga-bassins paléoprotérozoïques”, and Rich-ard, “Traçage isotopique de migrations massives de métaux le long d’une faille d’échelle crustale (Emu Fault, bassin de McArthur, Australie)”. Reviews by Robert Scott and two anonymous reviewers greatly helped in improving the manuscript.
REFERENCES CITED
Ahmad, M., Dunster, J.N., and Munson, T.J., 2013, McArthur Basin, in Ahmad, M., and Munson, T.J., compilers, Geology and Mineral Resources of the Northern Territory: Northern Territory Geologi-cal Survey Special Publication 5, p. 15-1–15-72. Cooke, D.R., Bull, S.W., Donovan, S., and Rogers,
J.R., 1998, K-metasomatism and base metal depletion in volcanic rocks from the McArthur Basin, Northern Territory—Implications for base metal mineralization: Economic Geology and the Bulletin of the Society of Economic Geologists, v. 93, p. 1237–1263, https://doi .org/10.2113/ gsecongeo.93.8.1237.
Cooke, D.R., Bull, S.W., Large, R.R., and McGold-rick, P.J., 2000, The importance of oxidized brines for the formation of Australian Proterozoic stratiform sediment-hosted Pb-Zn (sedex) depos-its: Economic Geology and the Bulletin of the Society of Economic Geologists, v. 95, p. 1–18, https://doi .org/10.2113/gsecongeo.95.1.1. Cumming, G.L., and Richards, J.R., 1975, Ore
lead isotope ratios in a continuously chang-ing earth: Earth and Planetary Science Letters, v. 28, p. 155–171, https://doi .org/10.1016/0012-821X(75)90223-X.
Davidson, G.J., 1998, Alkali alteration styles and mechanisms, and their implications for a ‘brine factory’ source of base metals in the rift-related McArthur group, Australia: Australian Journal of Earth Sciences, v. 45, p. 33–49, https://doi .org/10.1080/08120099808728365.
Deloule, E., Allegre, C.J., and Doe, B.R., 1986, Lead and sulfur isotope microstratigraphy in galena crystals from Mississippi Valley–type deposits: Economic Geology and the Bulletin of the Society of Economic Geologists, v. 81, p. 1307–1321, https://doi .org/10.2113/gsecon-geo.81.6.1307.
Figure 4. Lead isotope evolution models pro-posed for the origin of two lead sources in the McArthur River Zn-Pb deposit (Northern Terri-tory, Australia). See text for description of models. The data presented are all the data obtained in this study. Colors in models A, B, and C: evolution of mantle—gray; lead source 1—red; lead source 2— blue; crustal reservoir formed prior to crustal differentiation (model C)— green. Isochrons (straight lines linking the composi-tions of rocks or minerals having the same model age) are indicated for each proposed model. Values in italics are calculated values after models. µp, µs, µ1, and µ2 correspond to the 238U/204Pb ratio of mantle (7.192), first-formed crustal reservoir in model C, lead source 1, and lead source 2 respectively; tf1 and tf2 correspond to the age of crust formation for lead sources 1 and 2, respectively, in model A; tf and td correspond to the ages of crust formation in model B and to episode of crustal differentiation after crust formation at 3.7 Ga in model C, respec-tively; tc1 is the time from which the isotopic com-position of lead source 1 remained constant, corresponding to crys-tallization of Pb-bearing, U-poor and Th-poor min-erals in models B and C. 1700 Ma 1600 Ma 1640 Ma 1680 Ma 1720 Ma 1680 Ma 1840 Ma µ = 7.2-10s t = 3.65-3.0 Ga crustal differentiation Data 4.57 Ga 206Pb /204Pb 16 15.38 15.42 15.46 15.50 15.54 15.58 16.10 16.14 16.18 16.22 15.58 15.62 lead source 1 t = 1764-1895 Ma lead source 2 1640 Ma 15 14 13 12 11 10 10 11 12 13 14 15 16 9 µ p 2 1 lead source 1 (µ = 11.12 - 12.9 2) d f 3.7 Ga crust formation lead source 2 (µ = 10.34 - 10.67) 15.38 15.42 15.46 15.50 15.54 15.58 16.10 16.14 16.18 16.22 15.62 lead source 1 t = 1764 Ma lead source 2 1640 Ma t = 3.65 Ga crust formation Data 4.57 Ga 16 15 14 13 12 11 10 Model
B
ModelC
2 1 µ p lead source 1 (µ = 11.12) c1 c1 lead source 2 (µ = 10.34) 20 7Pb / 20 4Pb 20 7Pb / 204 Pb 20 7Pb / 204 Pb t = 3.83 Ga crust formation t = 3.65 Ga crust formation 15.38 15.42 15.46 15.50 15.54 15.58 16.10 16.14 16.18 16.22 15.62 lead source 1 1640 Ma lead source 2 1640 Ma Data 4.57 Ga 16 15 14 13 12 11 10 ModelA
1 2 µ p lead source 1 (µ = 10.21) f1 f2 f lead source 2 (µ = 10.34 )Harlaux, M., Mercadier, J., Marignac, C., Peiffert, C., Cloquet, C., and Cuney, M., 2018, Tracing metal sources in peribatholitic hydrothermal W deposits based on the chemical composition of wolframite: The example of the Variscan French Massif Cen-tral: Chemical Geology, v. 479, p. 58–85, https:// doi .org/10.1016/ j.chemgeo.2017.12.029. Hofmann, A.W., 2007, Sampling mantle
heterogene-ity through oceanic basalts: Isotopes and trace elements, in Carlson, R.W., ed., Treatise on Geochemistry, Volume 2: The Mantle and Core: Elsevier, 44 p., https://doi .org/10.1016/B0-08-043751-6/02123-X.
Huston, D.L., Stevens, B., Southgate, P.N., Muh-ling, P., and Wyborn, L., 2006, Australian Zn-Pb-Ag ore-forming systems: A review and analysis: Economic Geology and the Bulletin of the Society of Economic Geologists, v. 101, p. 1117–1157, https://doi .org/10.2113/gsecon-geo.101.6.1117.
Kunzmann, M., Schmid, S., Blaikie, T.N., and Halver-son, G.P., 2019, Facies analysis, sequence stratig-raphy, and carbon isotope chemostratigraphy of a classic Zn-Pb host succession: The Proterozoic middle McArthur Group, McArthur Basin, Aus-tralia: Ore Geology Reviews, v. 106, p. 150–175, https://doi .org/10.1016/ j.oregeorev.2019.01.011. Large, R.R., Bull, S.W., Cooke, D.R., and McGold-rick, P.J., 1998, A genetic model for the H.Y.C. Deposit, Australia: Based on regional sedimen-tology, geochemistry, and sulfide-sediment rela-tionships: Economic Geology and the Bulletin of the Society of Economic Geologists, v. 93, p. 1345–1368, https://doi .org/10.2113/gsecon-geo.93.8.1345.
Laznicka, P., 2014, Giant metallic deposits—A century of progress: Ore Geology Reviews, v. 62, p. 259–314, https://doi .org/10.1016/ j.oregeorev.2014.03.002.
Leach, D.L., Bradley, D.C., Huston, D., Pisarevsky, S.A., Taylor, R.D., and Gardoll, S.J., 2010, Sed-iment-hosted lead-zinc deposits in Earth history: Economic Geology and the Bulletin of the Soci-ety of Economic Geologists, v. 105, p. 593–625, https://doi .org/10.2113/gsecongeo.105.3.593.
McCuaig, T.C., and Hronsky, J.M.A., 2014, The mineral system concept: The key to exploration targeting, in Kelley, K.D., and Golden, H.C., eds., Building Exploration Capability for the 21st Century: Society of Economic Geologists
Special Publication 18, p. 153–175, https://doi .org/10.5382/SP.18.08.
McGoldrick, P., Winefield, P., Bull, S., Selley, D., and Scott, R., 2010, Sequences, synsedimentary struc-tures, and sub-basins: The where and when of SEDEX zinc systems in the southern McArthur Basin, Australia, in Goldfarb, R.J., et al., eds., The Challenge of Finding New Mineral Resources: Global Metallogeny, Innovative Exploration, and New Discoveries: Society of Economic Geolo-gists Special Publication 15, p. 367–390, https:// doi .org/10.5382/SP.15.2.02.
Mercadier, J., Annesley, I.R., McKechnie, C.L., Bog-dan, T.S., and Creighton, S., 2013, Magmatic and metamorphic uraninite mineralization in the western margin of the Trans-Hudson orogen (Saskatchewan, Canada): A uranium source for unconformity-related uranium deposits?: Eco-nomic Geology and the Bulletin of the Society of Economic Geologists, v. 108, p. 1037–1065, https://doi .org/10.2113/econgeo.108.5.1037. NTGS (Northern Territory Geological Survey), 2019,
Lead, zinc, silver factsheet and map: The Terri-tory’s Resources Commodities in the NT: https:// resourcingtheterritory.nt.gov.au/__data/assets/ pdf_file/0007/756556/LeadZincSilver-Factsheet. pdf (accessed January 2020).
Page, R.W., and Sweet, I.P., 1998, Geochronology of basin phases in the western Mt Isa Inlier, and correlation with the McArthur Basin: Australian Journal of Earth Sciences, v. 45, p. 219–232, https://doi .org/10.1080/08120099808728383. Pettke, T., Oberli, F., and Heinrich, C.A., 2010, The
magma and metal source of giant porphyry-type ore deposits, based on lead isotope microanalysis of individual fluid inclusions: Earth and Planetary Science Letters, v. 296, p. 267–277, https://doi .org/10.1016/ j.epsl.2010.05.007.
Pitcairn, I.K., Teagle, D.A.H., Craw, D., Olivo, G.R., Kerrich, R., and Brewer, T.S., 2006, Sources
of metals and fluids in orogenic gold deposits: Insights from the Otago and Alpine schists, New Zealand: Economic Geology and the Bulletin of the Society of Economic Geologists, v. 101, p. 1525–1546, https://doi .org/10.2113/ gsecongeo.101.8.1525.
Polito, P.A., Kyser, T.K., Alexandre, P., Hiatt, E.E., and Stanley, C.R., 2011, Advances in understand-ing the Kombolgie Subgroup and unconformity-related uranium deposits in the Alligator Rivers Uranium Field and how to explore for them using lithogeochemical principles: Australian Journal of Earth Sciences, v. 58, p. 453–474, https://doi .org/10.1080/08120099.2011.561873.
Rawlings, D.J., Korsch, R.J., Goleby, B.R., Gibson, G.M., Johnstone, D.W., and Barlow, M., 2004, The 2002 Southern McArthur Basin Seismic Reflection Survey: Geoscience Australia Record 2004/17, 87 p.
Richard, A., Rozsypal, C., Mercadier, J., Banks, D.A., Cuney, M., Boiron, M.-C., and Cathelin-eau, M., 2012, Giant uranium deposits formed from exceptionally uranium-rich acidic brines: Nature Geoscience, v. 5, p. 142–146, https://doi .org/10.1038/ngeo1338.
Richards, J.P., 2013, Giant ore deposits formed by op-timal alignments and combinations of geological processes: Nature Geoscience, v. 6, p. 911–916, https://doi .org/10.1038/ngeo1920.
Sawkins, F.J., 1989, Anorogenic felsic magmatism, rift sedimentation, and giant Proterozoic Pb-Zn deposits: Geology, v. 17, p. 657–660, https://doi .org/10.1130/0091-7613(1989)017<0657:AFM RSA>2.3.CO;2.
Stacey, J.S., and Kramers, J.D., 1975, Approxima-tion of terrestrial lead isotope evoluApproxima-tion by a two-stage model: Earth and Planetary Science Letters, v. 26, p. 207–221, https://doi .org/10.1016/0012-821X(75)90088-6.
Sun, S.s., Carr, G.R., and Page, R.W., 1996, A contin-ued effort to improve lead-isotope model ages: Australian Geological Survey Organization Re-search Newsletter, v. 24, p. 19–20.