Morphological, physiological and biochemical studies
on Pyricularia grisea isolates causing blast disease
on finger millet in Ethiopia
Getachew Gashaw1, Tesfaye Alemu1* and Kassahun Tesfaye1, 2
1Department of Microbial, Cellular and Molecular Biology, College of Natural Sciences, Addis Ababa University, P.O.Box. 1176, Addis Ababa, Ethiopia.
2Institute of Biotechnology, Addis Ababa University, P.O.Box. 1176, Addis Ababa, Ethiopia * Corresponding author email: [email protected] OR [email protected]
Original submitted in on 25th September 2013 Published online at www.m.elewa.org on 28th February 2014.
http://dx.doi.org/10.4314/jab.v74i1.2
ABSTRACT
Objective: Finger millet blast disease caused by Pyricularia grisea (Magnaporthe grisea) causes significant yield loss in Ethiopia. This study was conducted to isolate, identify and characterize the pathogen (using morphological, physiological and biochemical methods).
Methodology and results: A total of 42 P. grisea isolates from five different finger millet producing regions of Ethiopia were collected from diseased finger millet plants and wild relatives. Based on their geographical distribution, virulence and comparative growth on culture media, only six isolates were selected for further in-depth study. The morphological and physiological variability studies of the six isolates were carried out on Host Seed Extract + 2% Sucrose Agar, Oat Meal Agar, Potato Dextrose Agar and Richard’s Agar culture Media at varying temperature, pH, carbon and nitrogen sources. Each of the isolated P. grisea showed consistently better growth on Oat Meal Agar than other media. The isolates showed considerable variation in mycelial growth, pigmentation and conidia production in culture. Oat meal agar and Richard Agar media showed maximum mycelial growth with 87.3mm and 88.2mm by isolates of Pg 41 and Pg 26, respectively. Based on temperature preference and pH requirement, the isolates of P. grisea showed maximum mycelial growth of 61.4mm and 423.3mg at 30°C and pH 6.5. The isolates of P. grisea showed ability to metabolize a wide range of carbon and nitrogen sources among which dextrose and NaNO3 were the most suitable carbon and nitrogen
sources for mycelial growth of all isolates. The variations in the utilization of the various carbon and nitrogen compounds seem to reflect inherent biochemical and physiological differences among P. grisea isolates. Conclusion and applications: Basic data on finger millet blast pathogen diversity and characterization using morphological, physiological and biochemical methods has been conducted. The results of this study help to understand the physiological and biochemical requirements for the growth and development of the pathogen, which could serve as an input in disease management to minimize the effect of blast disease on finger millet and its wild relatives.
Keywords: Blast disease, Eleusine coracana, Pyricularia grisea, characterization.
INTRODUCTION
Journal of Applied Biosciences 74:6059– 6071
Millets are a group of highly variable grass species belonging to different genera that originated and were domesticated in tropical and sub-tropical parts of Africa and Asia (Hilu et al., 1979). One of the most important millets worldwide is finger millet (Eleusine coracana) which was domesticated in the eastern African sub-humid uplands (National Research Council, 1996). Finger millet is thought to have originated from Ethiopian highlands and/or neighbouring Uganda where wide diversity of the genus Eleusine exists. It is indigenous to eastern Africa, where the oldest domesticated example of this crop was found in a prehistoric site at Axum, Ethiopia, dating back some 5000 years (Hilu et al., 1979). In parts of eastern and southern Africa as well as in India, it became a staple upon which millions depend for food and rural household incomes. It is grown mainly by subsistence farmers and serves as a food security crop because of its high nutritional value and excellent storage qualities (Dida et al., 2007). Despite its importance, its productivity has been limited by blast disease caused by Pyricularia grisea in the eastern African countries. Lenne et al. (2007) and Getachew et al. (2013) have indicated that P.grisea is a worldwide disease capable of devastating finger millet resulting in significant yield reduction. The disease affects the crop at all growth stages from seedlings (causing lesions and premature drying of young leaves) to
affecting the panicle causing neck and/or finger millet blast (Getachew et al., 2013). The pathogen is highly destructive and economically important causing in excess of 50 % reduction in yield where the panicle is infected, and particularly in wet years (Dunbar, 1969). Losses of 10–90 % have been recorded in field studies in Uganda (Bisht, 1987), 64 % in Kiboko in Kenya (Pande et al., 1995), 10.1- 41.4% in Ethiopia (Getachew et al., 2013). Finger millet blast is caused by a heterothallic filamentous fungus pathogenic to almost 50 plant species in 30 genera of Poaceae including Eleusine (Rossman et al., 1990). The fungus appears to overwinter as mycelia in the infected living leaves or dead plant debris in the soil (Uddin, 2000). High temperature, high relative humidity and leaf wetness are critical environmental factors in disease development (Ruiz, 2003). In Ethiopia, no studies have been conducted to characterize this pathogen (Getachew et al., 2013). Moreover, little is known of the biology of Pyricularia species on finger millet in spite of the crop’s nutritional importance. Hence, this study was initiated to study and understand the physiological and biochemical requirements for the growth and development of the pathogen, which could serve as an input in disease management to minimize yield loss. This study was also undertaken to study the effects of growth factors on mycelial growth of P.grisea isolates.
MATERIALS AND METHODS
Description of study areas: Samples were collected from five different sampling sites in East Wollega, West Wollega, Metekel, Awi and West Gojam (Figure 1). The sampling areas lie between 9010’ and 11016’ North and between 34059’ and 37029’ East, with altitudes ranging from 1033 to 2322m above sea level (asl). The mean minimum and maximum rainfall of the study area lies
between 38.9mm and 1600mm. The mean minimum and maximum temperature of the study area also lies between 9 oC and 34.4 oC (Getachew et al., 2013). Samples were collected during the main cropping season from September-November 2011. The area is characterized by mixed crop livestock system with finger millet as major crop along with other cereals.
Figure 1: Finger millet blast disease survey sites in West and North West Ethiopia. Dots and stars indicate collection sites and major towns, respectively.
Figure 2: Photos showing diseased plant part with symptoms on different plant parts (A: Leaf; B: Neck and Finger; C: Seed).
Finger millet plant parts (leaf, neck, finger and seed) showing typical symptoms of blast were collected from different field using paper bags and envelopes. The diseased samples were kept in refrigerator at 4oC for further studies. Isolates of P.grisea were isolated from blast infected finger millet and its wild relatives (Eleusine floccifolia; Eleusine africana) and weedy plants (Setaria pumila) from farmer’s fields in different regions. Additional samples were also collected from Bako, Pawe and Adet
Agricultural Research Centers during the main cropping seasons of 2011 (October). Blast infected plants in the field were easily identified by the blackish velvety accumulation on the inflorescence and dark brown to reddish color on the leaf (Figure 2). The pathogen was isolated following standard tissue isolation procedure as oC described in Tuite (1969). Diseased plant tissues were cut from the margin of infected portion and split open longitudinally using a sterilized knife and washed in tap
A B
water for two minutes in separate plates in order to minimize surface contaminants. Subsequently, they were dipped in 70% ethanol for one minute to sterilize the surface and rinsed three times in sterile distilled water to remove the remaining contaminants (Aneja, 2005). The surface sterilized tissues were directly transferred on to potato dextrose agar (PDA) amended with 60 mg/l Neuromycine sulphate (Tredway et al., 2003) to suppress the growth of bacterial contaminants. The Petri plates were incubated in the dark at 27±1 oC for 10 to 15 days
until the emergence of mycelia and sporulation. Isolates were purified by sub-culturing on PDA and stored on PDA slants at 4oC. From the initial 42 isolates, six isolates of P.grisea were selected for detailed cultural, morphological, physiological and biochemical characterization based on their geographical location, isolate type (weather it is obtained/isolated) from leaf, neck or seed parts of finger millet and wild/weed species. The selected six isolates were designated Pg.11, Pg.20, Pg.22, Pg.26, Pg.40 and Pg.41.
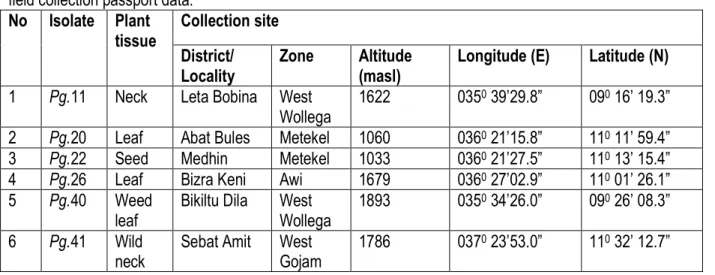
Table 1: Pyricularia grisea isolates selected for the morphological and biochemical studies in laboratory and field collection passport data.
No Isolate Plant tissue Collection site District/ Locality Zone Altitude (masl)
Longitude (E) Latitude (N)
1 Pg.11 Neck Leta Bobina West
Wollega
1622 0350 39’29.8” 090 16’ 19.3”
2 Pg.20 Leaf Abat Bules Metekel 1060 0360 21’15.8” 110 11’ 59.4”
3 Pg.22 Seed Medhin Metekel 1033 0360 21’27.5” 110 13’ 15.4”
4 Pg.26 Leaf Bizra Keni Awi 1679 0360 27’02.9” 110 01’ 26.1”
5 Pg.40 Weed
leaf
Bikiltu Dila West Wollega
1893 0350 34’26.0” 090 26’ 08.3”
6 Pg.41 Wild
neck
Sebat Amit West Gojam
1786 0370 23’53.0” 110 32’ 12.7”
Characterizations of P. grisea isolates and mycelial growth on different culture media: P.grisea isolates were characterized based on cultural, morphological (growth pattern, spore shape and septation), physiological and biochemical methods (Barnett and Hunter, 1960). The growth characters of different isolates were studied on four solid media, i.e. host seed extract agar + 2% sucrose, Oat meal agar, Potato dextrose agar and Richards’s agar (Oxoid). All the media were sterilized at 1210C for 15 minutes. The media were inoculated with 4 mm mycelial discs cut from the periphery of actively growing cultures of each P.grisea isolate and incubated at 27±1°C. Each treatment was replicated three times. Surface texture, pigmentation and mycelial growth on different growth media, temperature and pH were used as criteria for identification of the isolates. Colony diameters of each isolate on Petri plates were measured in millimeter in two directions with a ruler at two days intervals and the measurements were recorded in mm at, the 10th day of incubation. Mycelial colour, type of margin and sporulation were recorded (Barnett, and Hunter, 1960).
Microscopic characterization of conidia: Morphological characterization was done based on conidial features. Each P.grisea isolate was grown on PDA and incubated at 27±1 OC for 10 days. The morphological characters such as shape, colour and size (length and width) of the conidia were measured on 50 spores for each isolate and the number of septations per conidia was determined under microscope. Based on these features the six isolates were identified using key manual developed by Barnett and Hunter (1960). The spores were observed on slides after staining with lacto phenol cotton blue under light microscope. The sizes of conidia were measured by using ocular and stage micrometers as described by Meena (2005). The spores were measured using digital solutions for imaging and microscopy, soft image system (BX 51 System microscope Hamburg, Germany). Microphotographs were taken to show the typical spore morphology of the P.grisea isolates.
Physiological studies
Effect of temperature on mycelial growth: Mycelial disks of each isolate (4 mm in diameter), was taken from the edge of 10 days old colony grown on PDA and placed
at the center of 90 mm diameter Petri plates containing freshly prepared MEA. The plates were incubated in darkness at six different temperatures (15, 20, 25, 30, 35 and 40OC). Each treatment was replicated three times. Colony diameters of each isolate were measured as described above.
Effect of hydrogen ion concentration (pH) on mycelial growth: Inoculum (4mm diameter) taken from the margin of 10 days old culture of the isolates grown on PDA were cut and put into 250 ml flasks containing 100 ml potato dextrose broth (PDB) (200g potato, 20g dextrose per liter of sterilized water). The pH of PDB was varied in 0.5 units from 3 to 8.0 using 1N of HCl and 1N NaOH. Inoculated media were incubated at 27 ± 10C, with each treatment replicated two times. Reaction of the medium was adjusted to the desired pH by using 1N of HCl and 1N NaOH. After 14 days, the mycelial mats were separated and harvested from the filtrate using Whatman No 42 filter paper and washed three times with distilled water so as to wash out the adhering salts. Mycelial mats were oven dried at 65OC for 48 hours and the dry weight of each isolate determined on electronic balance (Wagtech Was 220/ C/2).
Biochemical studies
Carbon and Nitrogen utilization: The P.grisea isolates were tested for carbohydrate and nitrogen utilization using Richards’s basal medium [Sucrose (C12H22O11) 50.00 g, Potassium dihydrogen phosphate (KH2PO4) 5.00
g, Potassium nitrate (KNO3) 10.00 g, Magnesium sulphate (MgSO4. 7H2O) 2.50 g, Ferric chloride (FeCl3. 6H2O) 0.02g, agar 20.0g and distilled water (to make up) 1000ml] by replacing the carbon sources with D-glucose, D-fructose, maltose and sucrose and nitrogen sources with KNO3, NaNO3, arginine monohydrochloride and L-glycine by each isolate of P.grisea (Otsuka et al., 1957). The quantity of each carbon and nitrogen compound to be added was determined on the basis of their molecular weight, so as to provide equivalent amount of carbon as was of sucrose present in the basal medium and nitrogen as was of potassium nitrate present in the basal medium. Each treatment was replicated three times. All the carbon and nitrogen sources were dissolved properly and sterilized at 121oC for 15 minutes. By using a sterile cork borer, mycelial discs measuring 4 mm taken from the periphery of 10 days old pure culture on PDA were cut and used for inoculation to the Petri plates and the plates were incubated at 27 ± 10C for 10 days. Colony diameters of each P.grisea isolate on plates were measured as described above.
Data Analysis: The statistical analysis of growth characteristics of P.grisea isolates was conducted using one way ANOVA procedures of SPSS statistical analysis software (SPSS Institute Inc., Cary, NC 2006 version 15). Mean comparisons of each treatments was performed by using Duncan’s multiple range test (α= 0.05).
RESULTS AND DISCUSSION
A total of 42 (37 from finger millet, 3 from wild relatives and 2 from weed) samples from diseased leaf, neck and finger/seed, of finger millet and weedy and wild relative species were collected from East Wollega (7 samples), West Wollega (16 samples), Metekel (6 samples), Awi (6 samples) and West Gojam (7 samples). The fungal isolates were assigned Pyricularia grisea (Pg) isolates 1-42. For intensive characterization, only six isolates of P. grisea were selected based on geographical location of the origin of the isolate and growth characteristics of the test pathogen (Table 1).
Cultural characteristics of P.grisea isolates
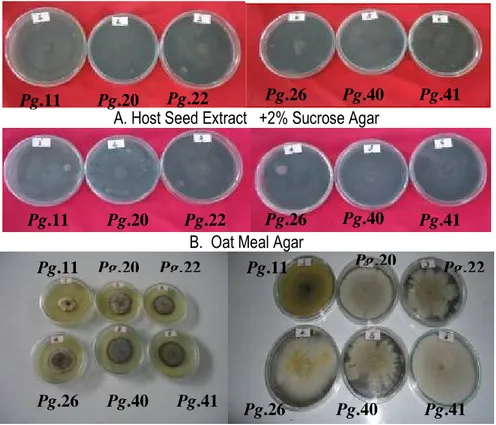
Colony characteristics on different culture media: The isolates showed significant differences (P<0.05) in their growth rate but there were only slight variations in colour between isolates on the four mycological media. On host seed extract + 2% sucrose agar all the isolates showed black to greyish black color with smooth colony margin and good growth. On oat meal agar, colony colour of all the isolates was usually gray coloured with good growth whereas, Pg.11 (neck blast) showed grayish black with
medium growth (Fig. 3, A and B). All the isolates showed raised mycelial growth with smooth colony margin. The isolates Pg.41 (neck blast) and Pg.40 (leaf blast) showed raised mycelium with concentric ring pattern (Fig. 5). In PDA colonies were black coloured in isolates Pg.22, Pg.26 and Pg.40. However, isolates Pg.20 and Pg.41 showed grayish black colour and isolate Pg.11 was gray. Except the isolate Pg.11 (neck blast), almost all the isolates showed good mycelial growth on PDA. The isolates Pg.11 and Pg.26 showed irregular colony margin whereas other isolates had smooth colony margin. Isolates Pg.11 and Pg.22 showed concentric ring pattern on PDA. Growth of the isolates on Richard’s medium showed that the colour of the colony varied. Isolates Pg.11, Pg.20, Pg.26 and Pg.41 showed smooth colony margin except the isolates Pg.22 and Pg.40 which showed irregular colony margin. The isolate Pg.11 and Pg.22 showed slight growth whereas other isolates showed good growth. According to Meena (2005), on oat meal agar, host seed extract +2% sucrose agar, PDA and Richard’s agar medium the colony colour of all the rice
blast (P.grisea) isolates was usually buff with good growth, greyish black with medium growth, the raised mycelial growth with smooth colony margin and raised mycelium with concentric ring pattern. Mijan (2000) observed that, the same kinds of P.grisea isolates attack both finger millet and rice; P.oryzae was prevalent in rice than finger millet. Similar variations on cultural
characteristics among 12 P. grisea isolates from rice were observed by Ou (1985). The present study supports that of Meena (2005) that the difference in colony colour arises from the difference in spore production of P. grisea on different media. The colour difference observed in this study between the segments might be due to the stages of the spores on the different patterns of growth.
A. Host Seed Extract +2% Sucrose Agar
B. Oat Meal Agar
C. Potato Dextrose Agar D. Richard’s Agar Medium Figure 3: Mycelial growth of P.grisea isolates on different culture media.
Figure 4: Effect of oat meal agar medium on the mycelial growth of Pg.41 isolate from neck specimen and Pg.40 from leaf specimens.
Pg.41 Pg.40 Pg.11 Pg.20 Pg.22 Pg.26 Pg.40 Pg.41 Pg.11 Pg.20 Pg.22 Pg.26 Pg.40 Pg.41 Pg.11 Pg.20 Pg.22 Pg.26 Pg.40 Pg.41 Pg.11 Pg.20 Pg.22 Pg.26 Pg.40 Pg.41
Figure 5: Concentric ring pattern of P.grisea isolates from seed and leaf specimens, respectively. Growth of P. grisea isolates on different solid culture
media : The results (Table 2) revealed a significant difference between isolates, media and their interaction. The maximum mean radial growth of 76.3 mm was attained by isolate Pg.41 from the neck specimen, closely followed by isolate Pg.20 from leaf specimen with 71.8 mm. The seed blast isolate (Pg.22) (61.3 mm) showed the least radial growth. All isolates showed consistently better growth on oat meal agar followed by Richard’s agar medium. Among the media tested, an average mean growth of oat meal agar supported maximum radial growth (79.7 mm) which was followed by Richard’s agar medium (76.6 mm) and the least was observed on potato dextrose agar (48.4 mm).The utilization of media by the isolates was varied with significant interaction. Radial growth of isolates Pg.41 (87.3mm) and Pg.20 (86.3mm) was significantly superior to that of Pg.11 (84.7mm),
Pg.22 (78.3 mm), Pg.26 (73.1mm) and Pg.40 (68.5mm) isolates on oat meal agar. The least mycelial growth on PDA was by isolates Pg.11, Pg.22 and Pg.40 with 36.4, 47.5 and 48.5mm, respectively. The results of the radial growth experiments showed that oat meal agar medium favors the growth of P. grisea much more than PDA medium. Similarly, Susan and Ambika (2011) have observed that vegetative mycelial growth was highest using V8 agar (V8A), potato dextrose agar and (PDA), oatmeal agar (OMA) on P.grisea. The higher preference for oat meal agar than PDA might be due to higher microelement contents which are essential for good growth of Pyricularia species as indicated by Meena (2005). This possibly indicates that the pathogen has preference for certain nutritional components, which could be related to specificity for host.
Table 2: Evaluation of mycelial growth of P.grisea isolates on different culture media after 10 days of incubation at 27±1 o C (mm). No. P. grisea isolates Colony diameter (mm) Media Host Seed Extract
+2% sucrose Agar
Oat meal agar PDA Richard’s Agar
Medium 1 Pg.11 80.4±1.9b 84.7±0.9b 36.4±0.8e 68.5±1.1d 2 Pg.20 73.7±1.6c 86.3±0.9a 50.5±0.9c 76.7±0.5c 3 Pg.22 60.5±2.0e 78.3±1.0c 47.5±1.1d 58.7±1.3e 4 Pg. 26 67.3±0.8d 73.3±0.8d 54.4±0.7a 88.2±0.9a 5 Pg.40 78.8±1.6b 68.5±0.9e 52.9±0.5b 84.3±0.9b 6 Pg. 41 86.0±1.4a 87.3±0.9a 48.5±0.9d 83.3±0.98b Mean 74.5±8.9a 79.7±7.3a 48.4±6.1b 76.6±10.5a
Each value is an average of three replicates ±standard deviation. Data followed by the same letter are not significantly different along the row (p<0.05), according to Duncan’s multiple range test, Alpha=0.05, CV=21.9
Conidial characteristics of P. grisea isolates : In all isolates, the shape of the conidia was typically pyriform with base rounded, apex narrowed, 2-3 septate, 2-4 celled, and middle cells were broader than others (Fig.6). Though closely resembling one another in shape, distinct differences in spore size could be seen among the isolates. Some of them were very long and narrow, while
some were fairly broad. The isolates Pg.41 and Pg.40 had the longest conidia of 26.91 – 35.43 µm (average 31.17µm) and 24.36 – 29.48 µm (average 25.72), respectively. The lowest conidial length was for isolates Pg.22 of 15.66 – 24.37 µm (average 18.32µm) and Pg.20 of 18.01 – 24.03 µm (average 20.50) (Table 3). Highest conidial width was observed for isolates Pg.40 and Pg.22
with 8.35-11.92 µm (average 10.14 µm ) and 7.70-12.90 µm (average 10.57 µm), respectively. The mycelia of the isolates, in general, were observed to be highly branched, septate, superficial and bearing conidia at the tip or side of the conidiophores (Fig.6). The aerial mycelium was white to gray as it has observed by Barnett and Hunter (1960) and (Getachew et al., 2013). Based on the morphology of the test fungus all the pathogens were identified as P. grisea isolates. The conidiophores of the isolates were found to be slender, straight, gray, grayish black or dark brown, smooth bearing clusters of conidia which are typically of pyriform or obclavate and 2-3 septate. The different size and shapes of conidia and conidial mass are indicated in Figure 6. Nishikado (1927) observed that P. grisea conidia size ranged from 14 to 40 µm long and 6 to 13 µm wide (usually 19 to 23 µm long and from 7 to 9 µm wide) with small basal appendage. Existence of variability among the isolates of P. grisea
with respect to conidial size is also well documented by Tochinai and Nakano (1940). It is probable that the different environmental conditions under which the various isolates are growing exert an important influence upon the form, size and septation of conidia of P.grisea isolates produced. The conidia were found to show variations in septation, (Fig. 5 and Table 3) ranging from one to three septations. The majority of the conidia had three septations. Although the pattern of septation of six isolates of P.grisea was similar in terms of dominance in frequency distribution of conidia with 3 septation, they were found to differ in the presence of some septation groups. Conidia with one septation were rarely observed in all isolates whereas conidia with two septations were observed in all isolates. Similar ariation in septation on Pyricularia conidia was also reported by Meena (2005) and (Getachew et al., 2013).
A B
C
Figure 6: Microphotograph showing conidial mass of P. grisea with different shapes and size [(45X (A) and 100X (B and C)].
Table 3: Conidial size and septation of P.grisea isolates after 10 days of incubation at 27±1o C P.grisea
isolates
Spore size Septation from 1-3
Length (µm) Width (µm)
Range Average Range Average 1 2 3
Pg.11 21.05-28.80 22.35 6.55-9.54 7.58 3 12 35 Pg.20 18.01-24.03 20.50 6.84-10.28 8.77 4 10 36 Pg.22 15.66-24.37 18.32 7.70-12.90 10.57 2 7 41 Pg.26 22.79-29.77 23.98 6.87-12.13 9.50 3 9 38 Pg.40 24.36-29.48 25.72 8.35-11.92 10.14 1 6 43 Pg.41 26.91-35.43 31.17 6.35-9.20 7.78 2 8 40 Physiological studies
Effect of varying temperatures on mycelial growth of P.grisea isolates: All the isolates showed different responses to the different incubation temperatures (Table 4). There was a slight increase in mycelial growth at
20-30 oC, and slight decrease at 40o C. The variation in mycelial growth among the isolates of the test pathogen at different temperatures was found to be significant at, P<0.05. The isolates Pg.20, Pg.40, Pg.41 and Pg.22 showed maximum colony diameter (68.1, 66.5, 65.2 and
65.1mm respectively) at 30°C, which was significantly superior to other treatments. The isolates Pg.20, Pg.22 and Pg.40 showed maximum growth at 25°C, which was also significantly superior over other treatments. The optimum temperature range for the maximum growth of the isolates of P. grisea was determined to be 20 to 35°C. The maximum mycelial growth (68.1mm) was obtained by isolate Pg.20, at 30 °C, but there were no mycelial growth obtained by isolates Pg.11 and Pg.41, at 40°C. The mycelial growth of isolates Pg.20, Pg.22, Pg.26 and Pg.40 were decreased at 40°C (Table 4). The isolate
Pg.40 grew to a mean diameter of 42.3mm followed by Pg.22 and Pg. 20 both grew to a diameter of 40.6 and 40.5mm, respectively (Table 4). The least growth was recorded by isolate Pg.11 (24.0mm). Similarly, Arunkumar and Singh (1995) studied the differential response of P. grisea isolates from rice, finger millet and pearl millet to temperature and reported maximum growth at 300C. Netam et al. (2013), Jamal et al. (2013) and (Getachew et al., 2013) have recorded the best mycelium growth and sporulation of P. grisea on finger millet is at 25 - 30°C and pH.
Table 4. Effect of varying temperature on the mycelial growth of P.grisea isolates, after 10 days of incubation (mm). No P. grisea isolate Temperature (°C) 15 20 25 30 35 40 1 Pg.11 12.3±1.0e 26.2±0.9c 31.9±1.0e 41.3±0.9d 32.5±0.5e NG*±0.0d 2 Pg.20 17.9±0.9bc 45.5±0.9a 54.8±1.0ab 68.1±0.9a 48.8±1.0b 8.2±0.7c 3 Pg.22 18.5±0.8b 47.3±0.8a 52.7±0.9b 65.1±1.5b 49.5±1.5b 10.5±1.5b 4 Pg.26 15.6±0.9d 37.8±0.7b 41.9±0.9d 62.4±1.0c 39.1±1.0d 13.2±0.9a 5 Pg.40 22.5±0.9a 45.4±0.9a 55.9±1.5a 66.5±1.0ab 51.6±0.9a 11.6±0.9b 6 Pg.41 16.3±1.6cd 45.5±1.9a 44.7±1.9c 65.2±1.9b 44.1±1.1c NG*±0.0d Mean ±SD 17.2±3.3c 41.3±7.7b 46.9±8.8b 61.4±9.5a 44.3±6.9b 7.3±5.6d
Data followed by the same letter are not significantly different (p<0.05) along the row, according to Duncan’s multiple range test, NG*=no growth; Alpha = 0.05, CV= 27.4
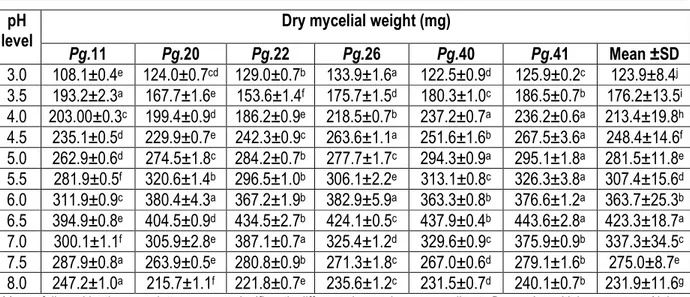
Effect of hydrogen ion concentration (pH) on the mycelial growth of P. grisea isolates: The results of the present investigation (Table 5) showed that maximum mean mycelial growth of all P.grisea isolates (423.3mg) at pH 6.5 was significantly superior to growth at other pH levels. Mycelial growth of all the isolates increased consistently from pH 3.0 to pH 6.5 and then started declining; the least growth was observed at pH 8.0 (231.9mg). Maximum dry mycelial weight at pH 6.5was recorded by isolates of Pg. 41 and Pg. 40 with 443.6 mg and 437.9 mg, respectively, whereas least growth was obtained by isolate Pg.11 from neck specimens with 394.89 mg. At all pH level, isolates Pg.41 and Pg.11
showed the maximum and minimum dry mycelial weight with 286.6 and 256.9 mg, respectively. The present finding was found to be similar to the works of Arunkumar and Singh (1995) where the highest biomass of P grisea on PDA was recorded at pH 6.5, but some isolates grows very well at acidic medium below pH 6.5 to neutral solutions of pH 7. However, Awoderu et al. (1991) found that optimum pH range for growth of P. grisea was 5.5 – 10.5, while Mijan (2000) has indicated that growth of P. grisea increased with increase in pH from 3.5 to 6.5. The variation among the findings might be due to the difference in the sensitivity of the different isolates.
pH level
Dry mycelial weight (mg)
Pg.11 Pg.20 Pg.22 Pg.26 Pg.40 Pg.41 Mean ±SD 3.0 108.1±0.4e 124.0±0.7cd 129.0±0.7b 133.9±1.6a 122.5±0.9d 125.9±0.2c 123.9±8.4j 3.5 193.2±2.3a 167.7±1.6e 153.6±1.4f 175.7±1.5d 180.3±1.0c 186.5±0.7b 176.2±13.5i 4.0 203.00±0.3c 199.4±0.9d 186.2±0.9e 218.5±0.7b 237.2±0.7a 236.2±0.6a 213.4±19.8h 4.5 235.1±0.5d 229.9±0.7e 242.3±0.9c 263.6±1.1a 251.6±1.6b 267.5±3.6a 248.4±14.6f 5.0 262.9±0.6d 274.5±1.8c 284.2±0.7b 277.7±1.7c 294.3±0.9a 295.1±1.8a 281.5±11.8e 5.5 281.9±0.5f 320.6±1.4b 296.5±1.0b 306.1±2.2e 313.1±0.8c 326.3±3.8a 307.4±15.6d 6.0 311.9±0.9c 380.4±4.3a 367.2±1.9b 382.9±5.9a 363.3±0.8b 376.6±1.2a 363.7±25.3b 6.5 394.9±0.8e 404.5±0.9d 434.5±2.7b 424.1±0.5c 437.9±0.4b 443.6±2.8a 423.3±18.7a 7.0 300.1±1.1f 305.9±2.8e 387.1±0.7a 325.4±1.2d 329.6±0.9c 375.9±0.9b 337.3±34.5c 7.5 287.9±0.8a 263.9±0.5e 280.8±0.9b 271.3±1.8c 267.0±0.6d 279.1±1.6b 275.0±8.7e 8.0 247.2±1.0a 215.7±1.1f 221.8±0.7e 235.6±1.2c 231.5±0.7d 240.1±0.7b 231.9±11.6g
Means followed by the same letters are not significantly different along column, according to Duncan’s multiple range test. Alpha =0.05, CV = 31.2
Biochemical studies
Effect of carbon sources on mycelial growth of P. grisea isolates: Significant differences in utilization of carbon sources by P.grisea isolates were observed in this study (Table 6), except growth on dextrose. Among the carbon sources, dextrose was the most preferred as evidenced by higher mean colony diameter (88.4mm). All the isolates showed similarity in their ability to utilize dextrose, maltose and D- fructose more efficiently than sucrose with mean colony diameter of (88.4, 84.8, 82.8 and 74.1mm, respectively). Sucrose supported maximum mycelial growth in isolate Pg.41 (82.8mm) and least growth was observed in isolate Pg.22 (58.9mm). Maltose supported maximum colony diameter for isolate Pg.40 (88.4mm) and least growth was observed by isolates Pg.22 (79.9) and Pg.26 (80.0mm). D-fructose supported
maximum mycelial growth in isolate Pg.40 (88.3mm) and least growth was observed in isolate Pg.11 (76.4mm). The findings are in accordance with the reports on the variation among isolates of P. grisea observed by Tochinai and Nakano (1940) and Otsuka et al. (1965). Onofeghara et al. (1973) and Hossain (2004) noted considerable variation in the ability to use various carbon sources thereby indicating biochemical differences among the P. grisea isolates. Netam et al. (2013) have indicated that among the different carbon sources, glucose (89.33mm) supported significantly higher mycelial growth, followed by sucrose (88.33mm), galactose (88.33mm). Tripathi (2006) has also reported that maltose better used as the carbon source for the mycelial growth and sporulation.
Table 6: Effect of different carbon sources on mycelial growth of P. grisea isolatesafter 10 days of incubation at 27±1 o C.
SI No. Isolate
Colony diameter (mm)
Dextrose Maltose D-fructose Sucrose
1 Pg.11 88.9±0.9a 88.1±0.9a 76.4±0.9d 68.5±0.9b 2 Pg.20 88.4±1.5a 85.0±0.9b 80.7±2.0c 70.4±0.9b 3 Pg.22 88.1±1.1a 79.9±0.8c 85.3±0.9b 58.9±1.1c 4 Pg.26 87.4±0.8a 80.0±2.1c 80.4±1.0c 81.8±0.9a 5 Pg.40 88.1±1.2a 88.4±1.0a 85.7±1.9b 82.3±2.0a 6 Pg.41 89.3±0.8a 87.7±1.5a 88.3±1.0a 82.8±1.5a
Data followed by the same letter are not significantly different along the row (p<0.05), according to Duncan’s multiple range test. Alpha =0.05, CV= 9.1
Effect of nitrogen sources on mycelial growth of P. grisea isolates : Results in Table 7 showed that, variable utilization of four different nitrogen sources KNO3, NaNO3,
L-arginine monohydrochloride, and L-glycine by each P.grisea isolate. The response by P. grisea isolates to exogenous supply of nitrogenous compounds was
variable among the isolates. NaNO3 proved to be the best source of nitrogen for all the isolates followed by L- arginine-mono-hydrochloride. L-glycine supported less mycelial growth than KNO3 with isolates (Pg.11, Pg.26, and Pg.40) and higher mycelial growth than KNO3 with isolates Pg.20, Pg.22 and Pg.41. Similarly, KNO3 supported less growth than L-arginine with isolates Pg.11, Pg.20, Pg.22, and Pg.41, and higher growth than L-arginine with isolates Pg.26 and Pg.40. L-glycine and KNO3 supported much less growth than KNO3. Generally, sodium nitrate and L-arginine represented good sources
of nitrogen (Table 7). Netam et al. (2013) have also reported that nitrogen source such as an ammonium nitrate favour the mycelial growth of P.grisea. Apparao (1956) and Otsuka et al. (1965) have also observed the utilization of nitrogenous sources by rice blast pathogen (Pyricularia oryzae). The result of this study has confirmed that variations exist in biochemical characterization among the isolates of P. grisea. These variations may to some extent be related to differences in physiological or biochemical properties among the six isolates of the pathogen.
Table 7: Effect of nitrogen sources on mycelial growth of P. grisea isolatesafter 10 days of incubation at 27±1 o C.
No. Isolate Colony diameter (mm)
L-glycine KNO3 L-arginine NaNO3
1 Pg.11 71.1±0.9c 78.2±1.5b 83.4±1.0b 88.5±1.0a 2 Pg.20 82.4±1.0b 71.1±0.6c 78.0±1.5cd 88.0±1.0a 3 Pg.22 80.8±1.0b 68.9±0.9c 81.7±1.1bc 89.1±1.3a 4 Pg.26 67.2±1.5d 81.5±1.5a 75.1±4.5d 89.2±0.9a 5 Pg.40 64.7±0.9e 82.6±2.5a 80.7±1.0bc 87.4±2.0a 6 Pg.41 84.5±1.0a 83.1±0.9a 87.9±1.5a 88.8±1.0a Mean ±SD 75.1±8.0c 77.6±5.9c 81.14±4.56b 88.5±1.2a
Data followed by the same letter are not significantly different along the row (p<0.05), according to Duncan’s multiple range test, Alpha =0.05, CV=9.2
CONCLUSIONS
The finger millet blast pathogen was studied to understand its diversity and characterization. The cultural, morphological, physiological and biochemical characteristics showed that the isolates belong to the genus Pyricularia with better growth performance on oat meal agar. The suitable temperature for the cultural growth of all isolates was 30 oC, while most grew best at the temperature range of 20- 35oC. All the isolates of P. grisea required pH 6.5 for maximum mycelial growth and showed high adaptability and growth range of pH value from 5.5 to 7. This indicated that the pathogen isolates can survive at these temperatures and may be found in
acidic soils for several years in finger millet growing regions of Ethiopia. Among the four carbon sources, dextrose was most favourable for the growth of all isolates followed by maltose. Among the four nitrogen sources, NaNO3 supported mycelial growth most followed by L-arginine. The implication of isolation of P. grisea isolates from weeds as an inoculum source helps to manage weeds because some isolates of blast pathogen from weeds also infect finger millet, hence the need for proper crop rotation and removal of alternate host species.
ACKNOWLEDGMENTS
The authors acknowledge Bioinnovate Africa-Project 01 of Addis Ababa University for funding this study. The authors are grateful to Teshome Bogale and Dagnatchew
Lule from Bako Agricultural Research Center for their help during the field surveys.
REFERENCES
Aneja, K.R. 2005. Experiments in Microbiology Plant Pathology and Biotechnology. 4th edn. New Age International Publishers, New Delhi. Pp. 607.
Apparao, A. 1956. Studies on the Blast Disease of Paddy. Ph.D. Dissertation. University of Madras, India.
Arunkumar and Singh, R.A. 1995. Differential response of Pyricularia grisea isolates from rice, finger millet and pearl millet to media, temperature, pH and light. Indian J. Mycol. and Plant pathol. 25: 238 – 242.
Awoderu, V.A., Esuruoso, A. F. and Adeosun, A.A. 1991. Growth and conidia production in rice of Pyricularia oryzae cav. In vitro. J. Basic Microbiol. 31: 163 – 168.
Barnett, H.L. and Hunter, B.B. 1960. Illustrated Genera of Imperfect Fungi. 2ndedn. Burgess publishing company, Morgantown, West Virginia. Pp. 71. Bisht, I.S. 1987. Blast tolerance and yield loss in finger millet. Indian Journal of Agricultural Sciences 57: 954-955.
Dida, M. M., Srinivasachary, Ramakrishnan, S., Bennetzen, J. L., Gale, M. D. and Devos, K. M. (2007). The genetic map of finger millet, Eleusine coracana. Theor Appl Genet. 114: 321–332.
Dunbar, A.R. 1969. The annual crops of Uganda. East African Literature Bureau, Dares Salaam, Nairobi, Kampala.
Getachew Gashaw, Tesfaye Alemu and Kassahun Tesfaye. 2013. Evaluation of disease incidence and severity and yield loss of finger millet varieties and mycelial growth inhibition of Pyricularia grisea isolates using biological antagonists and fungicides in vitro condition. Journal of Applied Biosciences 73: 5883– 5901. Hilu, K.W., de Wet, J.M.J and Harlan, J.R. 1979. Archaeobotanical studies of Eleusine coracana ssp. Coracana (finger millet). American Journal of Botany 66: 330-333.
Hossain, M.M., Srikant, K. and Hegde, Y.R., (2004). Physiological and nutritional studies on Pyricularia grisea, the causal agent of blast of rice. Karnataka J. Agricultural Sci., 17(4): 851-853.
Jamal-U-ddin Hajano, Abdul M Lodhi, Muhammad A Khanzada, Muhammad A Rajput, Ghulam S Shah, 2013. Influence of abiotic factors on the vegetative growth and sporulation of Magnaporthe oryzae couch. Pak. J. Phytopathol. 25 (01): 65-70.
Lenne JM, Takan JP, Mgonja MA., Manyasa EO, Kaloki P, Wanyera N, 2007. Finger millet blast management: A key entry point for fighting malnutrition and poverty in East Africa. Outlook on Agriculture 36: 101–108.
Meena BS, 2005. Morphological and Molecular Variability of Rice Blast Pathogen Pyricularia grisea (Cooke) Sacc. M.Sc. Thesis. Dharwad University of Agricultural Sciences, Dharwad. Mijan HMD, 2000. Studies on Blast Disease of Rice
Caused by Pyricularia grisea (Cooke) Sacc. in Upland Areas. M.Sc. Thesis. University of Agricultural Sciences, Dharwad.
National Research Council, 1996. Finger millet in lost crops of Africa: Volume I: Grains. Board on Science and Technology for International Development. National Academy of Sciences, National Academy Press, Washington D.C. Pp. 383.
Netam RS, Bahadur AN, Tiwari RKS, Tiwari U, 2013. Effect of different culture media, carbon source, nitrogen source, temperature and pH, level on the growth and sporulation of Pyricularia grisea isolate from finger millet. Research Journal of Agricultural Sciences 4(1): 83-86.
Nishikado Y, 1927. Studies on rice blast disease. Japanese Journal of Botany 3: 239 –244. Onofeghara FA, Kaporia RG, Ademokuba DO, 1973.
Studies on Pyricularia oryzae Lav. in Sierralaone morphological and physiological variability of some isolates. Annals of Botany 37: 193-202.
Otsuka H, Tamari K, Agaraswara N, 1957. Biochemical classification of Pyricularia oryzae cav. J. Agric. Chem. Soc. Japan 31: 791 – 798.
Otsuka H, Tamari K and Agasawara N, 1965. Variability of Pyricularia oryzae in culture. In the Rice Blast Disease. John Hopkins press, Baltimore. Pp 69 – 109.
Ou SH, 1985. Rice Diseases. Common Wealth Agricultural Bureaus, Wallingford, England. Pande S, Makuru SK, King SB, Karunakar RI, 1995.
Biology, and resistance to finger millet blast in Kenya and Uganda, Proceedings of the Eighth EARSAM Regional Workshop on Sorghum and Millets, WAD Medani, Sudan 30 Oct–5 Nov, 1992.
Rossman AY, Howard RJ, Valent B, 1990. Pyricularia grisea, the correct name of the rice blast disease fungus. Mycologia 82: 509–512. Ruiz CP, 2003. A new means of control for Pyricularia
oryzae, Rhizoctonia solani, and other important rice-disease pathogens in Colombia. Pflanzenschutz-Nachrichten Bayer 56: 399-416. Susan Partridge-Metz and Ambika Chandra, 2011.
and In vitro conidia production of Magnaporthe oryzae. Cell & Plant Sci. 2 (3): 9-11.
Tochinai Y and Nakano T, 1940. Studies on the nutritional physiology of Piricularia oryzae cavora. Journal of the Faculty of Agriculture, Nokkaido (Imperial) University 44: 183-229. Tredway LP, Stevenson KL, Burpee LL, 2003.
Components of resistance to Magnaporthe grisea in ‘Coyote’ and ‘Coronado’ tall fescue. Plant Dis. 87: 906-912.
Tripathi SK, 2006. Effect of media, pH, nitrogen, carbon sources and light on the growth and
sporulation of Pyricularia grisea. Annals of Plant Protection Sciences 14(1): 166-168. Tuite J, 1969. Plant Pathological Methods, Fungi and
Bacteria. Burges Publishing Company, New York. Pp. 239.
Uddin W, 2000. Gray leaf spot comes on strong. [Online] available: http://groundsmag. Com/ar/grounds_maintenance_gray_leaf_spot/ (09 Oct. 2008).

![Figure 6: Microphotograph showing conidial mass of P. grisea with different shapes and size [(45X (A) and 100X (B and C)].](https://thumb-eu.123doks.com/thumbv2/123doknet/2416755.45962/8.892.112.768.511.720/figure-microphotograph-showing-conidial-mass-grisea-different-shapes.webp)