• Aucun résultat trouvé

Material emissions testing: VOCs from wood, paint, and insulation materials

N/A
N/A
Protected

Academic year: 2021

Partager "Material emissions testing: VOCs from wood, paint, and insulation materials"

Copied!
165
0
0

Texte intégral

(1)

https://doi.org/10.4224/23002015

READ THESE TERMS AND CONDITIONS CAREFULLY BEFORE USING THIS WEBSITE.

https://nrc-publications.canada.ca/eng/copyright

Vous avez des questions? Nous pouvons vous aider. Pour communiquer directement avec un auteur, consultez la

première page de la revue dans laquelle son article a été publié afin de trouver ses coordonnées. Si vous n’arrivez

pas à les repérer, communiquez avec nous à PublicationsArchive-ArchivesPublications@nrc-cnrc.gc.ca.

Questions? Contact the NRC Publications Archive team at

PublicationsArchive-ArchivesPublications@nrc-cnrc.gc.ca. If you wish to email the authors directly, please see the

first page of the publication for their contact information.

NRC Publications Archive

Archives des publications du CNRC

For the publisher’s version, please access the DOI link below./ Pour consulter la version de l’éditeur, utilisez le lien

DOI ci-dessous.

Access and use of this website and the material on it are subject to the Terms and Conditions set forth at

Material emissions testing: VOCs from wood, paint, and insulation

materials

Won, Doyun; Nong, Gang; Yang, Wenping; Collins, Peter

https://publications-cnrc.canada.ca/fra/droits

L’accès à ce site Web et l’utilisation de son contenu sont assujettis aux conditions présentées dans le site

LISEZ CES CONDITIONS ATTENTIVEMENT AVANT D’UTILISER CE SITE WEB.

NRC Publications Record / Notice d'Archives des publications de CNRC:

https://nrc-publications.canada.ca/eng/view/object/?id=77464aff-3278-4693-9f2c-b87ba98a8f0e

https://publications-cnrc.canada.ca/fra/voir/objet/?id=77464aff-3278-4693-9f2c-b87ba98a8f0e

(2)

Material Emissions Testing:

VOCs from Wood, Paint, and Insulation Materials

Doyun Won, Gang Nong, Wenping Yang, and Pet er Collins

Prepared for: Healt h Canada

Report No.:

A1- 000342.2

Dat e I ssued: June 2014

This report may not be reproduced in whole or in part without the written consent of the

National Research Council Canada and the Client.

(3)

Material Emissions Testing:

VOCs from Wood, Paint, and Insulation Materials

Summary

A total of 30 building materials were tested for 121 volatile organic compounds (VOCs) in

small-scale (50 L) chambers in accordance with ASTM D5116-2010. The focus was on wood,

paint and insulation materials, which were identified as major sources of VOCs indoors or for

lack of information on VOC emissions in the previous study (Won et al., 2013). The emission

factors of 121 NRC target compounds are presented along with the empirical emission models

to describe the decay of emission factors. The data sets generated for these three groups of

materials in the previous study were also included in determining the mean emission factors for

each group of materials and the indoor air concentration based on a product usage scenario. In

total, the emissions data in this report represent 18 wood, 14 paint, and 17 insulation materials

tested between 2012/13 and 2013/14.

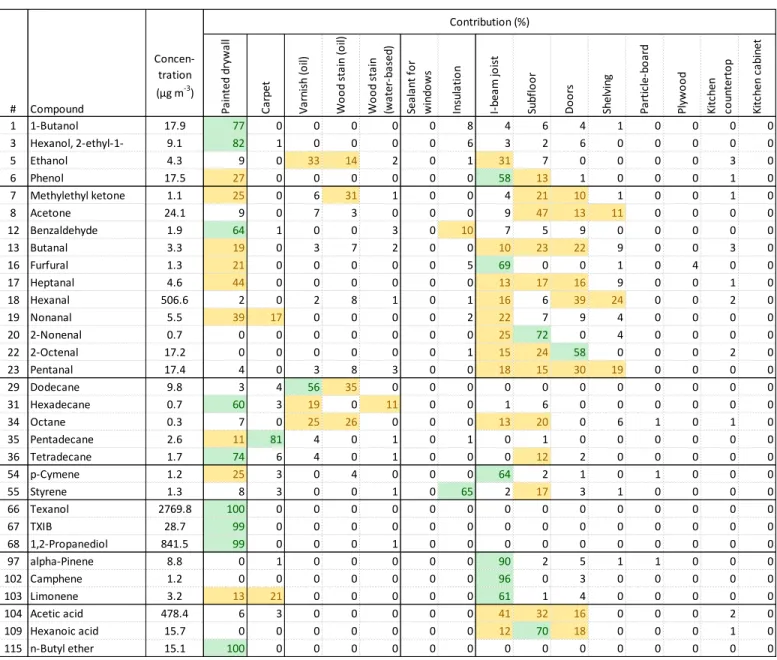
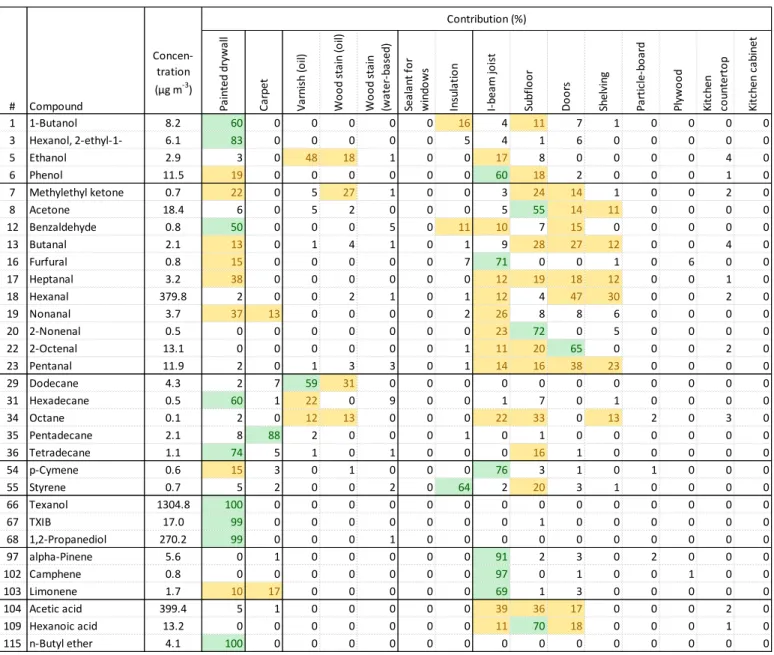
Terpenes and oxygenated compounds (e.g., alcohols, aldehydes, and acids) were detected

more frequently with high emission factors in wood products. Paint products also emitted

oxygenated compounds (1-butanol, acetone, formaldehyde, and acrolein) frequently.

However, the compounds with the highest emission factors and detection frequencies in paint

products were glycols and esters (e.g., Texanol and 1,2-propanediol), which are known to be

major ingredients of latex paints. While there were also various compounds detected in

insulation products (e.g., 1-butanol, 2-propanol, Texanol, acetaldehyde, and formaldehyde), the

emission factors of these compounds were relatively low.

Among

Health Ca ada’s priorit VOCs

1

, the following compounds were detected with a

detection frequency (DF) > 10%:

• O e al ohol: 2-propanol (DF above zero: 39%, DF above method detection limit: 33%)

• “i aro ati s: benzene (53%, 14%), xylenes (o-xylene: 45%, 6%, m&p-xylene: 71%, 14%),

ethylbenzene (71%, 12%), naphthalene (39%, 2%), toluene (76%, 24%)

• one chlorinated compound: chloroform (10%, 6%)

• Four aldehydes: acetaldehyde (88%, 86%), formaldehyde (96%, 94%), propanal (76%, 61%),

and acrolein (55%, 45%)

Two chlorinated compounds were detected in one or two materials included:

• T o hlori ated o pou ds: 1,2-dichloroethane (4%, 4%) and 1,4-dichlorobenzene (8%,

2%)

The compounds that were never detected or excluded were:

1

Priorit VOCs ere identified Health Ca ada’s I door Air Co ta i a t Assess e t Progra as

(4)

 Chlorinated compounds: carbon tetrachloride, dichloromethane, tetrachloroethylene and

1,1,2,2-tetrachloroethane

 1,3-Butadiene, propylene oxide and ethylene oxide (not analyzed due to analytical issues

and lack of detection in the previous study)

Due to the high background levels and reduced collection efficiencies of the sampling method,

the presence of acrolein needs to be interpreted with caution.

On average, a dark-colored paint product had ~60% higher emission factors than those of a

white paint product. No significant difference was found between a light-colored and a white

paint product. The application mode significantly affected the emissions of two abundant VOCs

in specimens made of a two-component spray foam sealant. The emission factor of triethyl

phosphate increased by a factor of 2 - 7 when the foam sealant was applied with an off-ratio of

component A and B (0.25:1 from 1:1) or low temperatures (16 and 5 C). This demonstrates

that the VOC emissions can be high when the spray foam sealant or insulation is not applied

properly.

The material usage scenario analysis coupled with the power-law decay models for

emission factor led to estimations of indoor air concentrations. The 1-year average indoor

concentrations were in good agreement with IAQ levels measured in Canadian homes for

acetaldehyde, formaldehyde, acrolein, and naphthalene. Wood products (I-beam joist,

subfloor, and interior door) were identified as the major sources of these aldehydes. Paint was

also the main contributor for acrolein and formaldehyde. Carpet and oil-based varnish were

identified as a main source for naphthalene.

Contrary to aldehydes, the 1-year means of other aromatic compounds (benzene, toluene,

ethylbenzene, and xylenes) were lower than the measured concentrations in the literature by

one order of magnitude. Considering the low detection frequency of aromatic compounds in

the current emissions tests, this may imply that building materials included in this study are not

the dominant sources of aromatic compounds indoors.

As pointed out in the previous report, the lack of information on the product usage

patterns in Canadian homes, offices and schools was identified as a major source of

uncertainties associated with predicting indoor air concentrations modeling from measured

emission factors. The wide ranges of measured emission factors within the product classes

emphasize the need for the variability of emissions to be taken into account in material

selections and IAQ modeling.

(5)

Material Emissions Data:

VOCs from Wood, Paint, and Insulation Materials

1

INTRODUCTION ... 1

2

METHODS... 2

2.1

T

EST PROCEDURES

... 2

2.1.1

List of test specimens ... 2

2.1.2

50-L chamber tests ... 3

2.1.3

Preparation of wood materials ... 3

2.1.4

Preparation of paint specimens ... 4

2.1.5

Preparation of insulation materials ... 4

2.2

C

HEMICAL ANALYSIS

... 6

2.2.1

Two-layer sorbent tube sampling and analysis ... 13

2.2.2

PFPH tube sampling and analysis... 14

2.2.3

DNPH cartridge sampling and analysis ... 15

2.2.4

Quality assurance and control analysis (QA/QC) ... 15

2.3

E

STIMATION OF INDOOR AIR CONCENTRATIONS

... 21

2.3.1

Emission factors ... 21

2.3.2

Indoor air concentrations ... 22

3

RESULTS AND DISCUSSION ... 24

3.1

E

MISSION FACTORS FOR DIFFERENT CLASSES OF COMPOUNDS

... 24

3.2

D

ETECTION FREQUENCY AND EMISSION FACTOR FOR DIFFERENT MATERIAL CATEGORIES

... 27

3.2.1

Wood ... 27

3.2.2

Insulation ... 32

3.2.3

Paint ... 38

3.3

P

RIORITY CHEMICALS

... 45

3.3.1

2-Propanol ... 46

3.3.2

Benzene ... 46

3.3.3

1,2-Dimethyl benzene and 1,3(4)-dimethyl benzene ... 46

3.3.4

Ethylbenzene ... 46

3.3.5

Naphthalene ... 46

3.3.6

Toluene ... 54

3.3.7

Chloroform ... 54

3.3.8

Acetaldehyde ... 54

3.3.9

Formaldehyde ... 54

3.3.10

Propanal ... 54

3.3.11

Acrolein ... 54

3.4

I

NDOOR AIR CONCENTRATIONS

... 59

3.4.1

Major sources ... 59

(6)

5

REFERENCES ... 74

APPENDIX ... 76

A.1

T

EST MATERIALS AND PRODUCTS

... 76

A.2

C

HAMBER CONCENTRATIONS

&

EMISSION FACTORS FOR

30

MATERIALS TESTED IN SMALL

-

SCALE

(50

L)

CHAMBERS

... 80

(7)

List of Tables

Table 1: Summary of test materials ... 2

Table 2: Sampling media and chemical analysis methods ... 6

Table 3: Properties and method detection limits of 121 NRC ME target compounds ... 7

Table 4: Ranges and correlation coefficients (R

2

) of calibration curves ... 14

Table 5: House volume and materials used in a single family resident for a scenario analysis

... 23

Table 6: Detection frequency and emission factor at 24 h for wood materials ... 28

Table 7: Emission factors (µg m

2

h

-1

) at 24 h for major VOCs emitted from wood materials

... 31

Table 8: Detection frequency and emission factor at 24 h for insulation ... 33

Table 9: Emission factors (µg m

2

h

-1

) at 24 h for major VOCs from insulation ... 36

Table 10: Detection frequency and emission factor at 24 h for paint ... 39

Table 11: Emission factors (µg m

2

h

-1

) at 24 h for major VOCs emitted from paint ... 42

Table 12: Ratio of emission factor at 24 h for colored vs. base paint and specimen

variability ... 44

Ta le : List of priorit o pou ds Health Ca ada ... 45

Table 14: Contribution (%) of differe

t aterials to air o e tratio s of priorit

he i als at d, da s, o th a d ear ... 66

Table 15: Contribution (%) of different material groups to air concentrations of selected

VOCs

1

at 1 day ... 67

Table 16: Contribution (%) of different material groups to air concentrations of selected

VOCs

1

at 10 days ... 68

Table 17: Contribution (%) of different material groups to air concentrations of selected

VOCs

1

at 1 month ... 69

Table 18: Contribution (%) of different material groups to air concentrations of selected

VOCs

1

at 1 year... 70

Table 19: Comparison of predicted IAQ concentrations with literature data ... 71

Table A. 1: Detailed information of test materials and products (2013/14) ... 76

Table A. 2: Test conditions for materials tested in 2013/14 ... 77

Table A. 3: Detailed information of test materials and products (wood, insulation, and

paint) tested in 2012/13 ... 78

Table A. 4: Test conditions for materials tested in 2012/13 ... 79

Table A. 5: Small-scale chamber concentration & emission factor for DI1 (interior door) ... 80

Table A. 6: Small-scale chamber concentration & emission factor for KC1 (kitchen cabinet)

... 82

Table A. 7: Small-scale chamber concentration & emission factor for CT3 (kitchen

countertop) ... 84

Table A. 8: Small-scale chamber concentration & emission factor for OSB10 (subfloor

underlay board) ... 86

(8)

Table A. 11: Small-scale chamber concentration & emission factor for IB5 (I-beam joist) .. 92

Table A. 12: Small-scale chamber concentration & emission factor for IB6 (I-beam joist) .. 94

Table A. 13: Small-scale chamber concentration & emission factor for INS3 (insulation,

recycled denim)... 96

Table A. 14: Small-scale chamber concentration & emission factor for INS4 (cellulose

insulation) ... 98

Table A. 15: Small-scale chamber concentration & emission factor for INS5 (stone wool

insulation) ... 100

Table A. 16: Small-scale chamber concentration & emission factor for INS6 (reflective

insulation) ... 102

Table A. 17: Small-scale chamber concentration & emission factor for INS7 (insulation, XPS)

... 104

Table A. 18: Small-scale chamber concentration & emission factor for INS8 (insulation, EPS)

... 106

Table A. 19: Small-scale chamber concentration & emission factor for INS9 (fiberglass

insulation) ... 108

Table A. 20: Small-scale chamber concentration & emission factor for INS10 (insulation,

polyisocyanurate foam board) ... 110

Table A. 21: Small-scale chamber concentration & emission factor for SPF1c (spray foam

sealant, low pressure, 2 passes) ... 112

Table A. 22: Small-scale chamber concentration & emission factor for SPF1d (spray foam

sealant, low pressure, 2 passes, off-ratio) ... 114

Table A. 23: Small-scale chamber concentration & emission factor for SPF1e (spray foam

sealant, low pressure, applied at 16

o

C) ... 116

Table A. 24: Small-scale chamber concentration & emission factor for SPF1f (spray foam

sealant, low pressure, applied at 5

o

C) ... 118

Table A. 25: Small-scale chamber concentration & emission factor for SPF2 (spray foam

insulation, 2-component, closed cell) ... 120

Table A. 26: Small-scale chamber concentration & emission factor for SPF3 (spray foam

insulation, 2-component, open cell) ... 122

Table A. 27: Small-scale chamber concentration & emission factor for SPF4 (spray foam

sealant, 1-component) ... 124

Table A. 28: Small-scale chamber concentration & emission factor for PT13 (Interior, acrylic

latex, VOC < 150 g/L) ... 126

Table A. 29: Small-scale chamber concentration & emission factor for PT13c1 (interior,

acrylic latex, dark color, VOC < 150 g/L) ... 128

Table A. 30: Small-scale chamber concentration & emission factor for PT13c2 (interior,

acrylic latex, light color, VOC < 150 g/L) ... 130

Table A. 31: Small-scale chamber concentration & emission factor for PT13p (acrylic latex

paint + primer) ... 132

(9)

Table A. 33: Small-scale chamber concentration & emission factor for PT15 (interior, primer

combined, latex, VOC ~ 0 g/L) ... 136

Table A. 34: Small-scale chamber concentration & emission factor for PT16 (interior, latex,

base for dark color, VOC < 5 g/L) ... 138

Table A. 35: Small-scale chamber concentration & emission factor for PT16c1 (interior,

latex, base for dark color + dark colorant, VOC < 5 g/L) ... 140

Table A. 36: Small-scale chamber concentration & emission factor for PT17 (interior, latex,

VOC < 150 g/L) ... 142

Table A. 37: Small-scale chamber concentration & emission factor for PT18 (recycled latex,

VOC < 50 g/L) ... 144

Table A. 38: Emission factors (µg m

2

h

-1

) at 24 h for VOCs emitted from wood materials . 146

Table A. 39: Emission factors (µg m

2

h

-1

) at 24 h for VOCs emitted from insulation materials

... 149

(10)

List of Figures

Figure 1: Wood material specimen in a specimen holder (door, kitchen cabinet, & subfloor)

... 3

Figure 2: I-beam joist specimen without a holder ... 3

Figure 3: Kitchen countertop without a holder ... 4

Figure 4: Paint specimen applied on a gypsum board ... 4

Figure 5: Insulation covered the entire bottom of the chamber ... 5

Figure 6: Insulation board inside a specimen holder ... 5

Figure 7: Two-component DIY spray foam insulation ... 5

Figure 8: One-component DIY spray foam sealant ... 5

Figure 9: Acrolein concentrations at different sampling rates (sampling volume of 3 L) .... 17

Figure 10: Collection efficiency of a single tube at different sampling rates ... 18

Figure 11: Collection efficiency of double tubes at different sampling rates ... 18

Figure 12: Amount of PFPH coating for different coating flow rates ... 18

Figure 13: Amount of PFPH coating for different coating temperatures ... 18

Figure 14: Amount of PFPH coating for different coating times ... 19

Figure 15: Amount of PFPH coating on brand-new and used Tenax TA tubes ... 20

Figure 16: Collection efficiency of acrolein for different amounts of PFPH coating ... 20

Figure 17: Stability of the PFPH coating ... 20

Figure 18: Range of emission factors @ 24h for wood, insulation, and paint ... 25

Figure 19: Range of emission factors @ 96h for wood, insulation, and paint ... 26

Figure 20: Emission factors of triethyl phosphate from SPF1c

– SPF1f ... 37

Figure 21: Emission factors of trans-1,2-dichloroethene from SPF1c

– SPF1f ... 37

Figure 22: Mean emission factors at 24 h of Texanol and TXIB for different VOC contents 43

Figure 23: Mean emission factors at 24 h of acetaldehyde and formaldehyde for different

VOC contents ... 43

Figure 24: Emission factors for paint and I-beam joist (2-propanol) ... 47

Figure 25: Emission factors for wood and insulation (2-propanol) ... 47

Figure 26: Emission factors for paint and I-beam joist (benzene) ... 48

Figure 27: Emission factors for wood and insulation (benzene) ... 48

Figure 28: Emission factors for paint and I-beam joist (xylenes) ... 49

Figure 29: Emission factors for wood and insulation (xylenes) ... 49

Figure 30: Emission factors for paint and I-beam joist (ethylbenzene) ... 50

Figure 31: Emission factors for wood and insulation (ethylbenzene) ... 50

Figure 32: Emission factors for paint and I-beam joist (naphthalene) ... 51

Figure 33: Emission factors for wood and insulation (naphthalene) ... 51

Figure 34: Emission factors for paint and I-beam joist (toluene) ... 52

Figure 35: Emission factors for wood and insulation (toluene) ... 52

Figure 36: Emission factors for paint and I-beam joist (chloroform) ... 53

Figure 37: Emission factors for wood and insulation (chloroform) ... 53

(11)

Figure 41: Emission factors for wood and insulation (formaldehyde) ... 56

Figure 42: Emission factors for paint and I-beam joist (propanal) ... 57

Figure 43: Emission factors for wood and insulation (propanal) ... 57

Figure 44: Emission factors for paint and I-beam joist (acrolein) ... 58

Figure 45: Emission factors for wood and insulation (acrolein) ... 58

Figure 46: Predicted concentration of benzene ... 60

Figure 47: Predicted concentration of 1,2-dimethylbenzene ... 60

Figure 48: Predicted concentration of 1,3(4)-dimethylbenzene ... 61

Figure 49: Predicted concentration of ethylbenzene ... 61

Figure 50: Predicted concentration of naphthalene ... 62

Figure 51: Predicted concentration of toluene ... 62

Figure 52: Predicted concentration of acetaldehyde ... 63

Figure 53: Predicted concentration of formaldehyde ... 63

Figure 54: Predicted concentration of propanal ... 64

Figure 55: Predicted concentration of acrolein ... 64

(12)

1 Introduction

Data from emissions testing conducted by NRC in 2012/2013 of 52 building materials was

used to model resulting indoor concentrations in a typical Canadian house (Won et al., 2013).

These results helped to provide updated identification of major indoor VOC sources, and led to

the selection of paints and wood-based products as priority materials for further evaluation.

The significant usage of insulation materials in residential construction, coupled with a lack of

emissions data for this product group, led to the selection of insulation as a 3

rd

class of

materials to be studied in greater detail.

A total of 30 additional materials were therefore tested for VOC emissions in 2013/14 (10

paints, 8 wood-based materials and 12 insulation products). In accordance with ASTM

D5116-2010, the test method employed small-scale chambers operated for 4

– 8 days under standard

conditions (23 C, 50% RH and 1 air change per hour). As with the previous report (Won et al.,

2013), the target compounds included 121 VOCs with the emphasis on formaldehyde,

acetaldehyde, benzene, and acrolein, concentrations of which in Canadian homes were

measured to be higher than indoor air reference levels (IARL) by Health Canada.

2

Additionally, different factors that could potentially impact VOC emissions were tested for

paint and spray polyurethane foam (SPF). The impact of tinting on emissions from paint was

examined to test the hypothesis that dark colored paints tend to have higher emissions than

light colored ones. SPF insulation has been reported to emit odorous compounds if it is not

applied correctly (Holiday, 2011). The impacts of the SPF application methodology on VOC

emissions were tested with a

do-it- ourself two-component spray foam insulation product.

Test specimens were applied either with strict adherence to

a ufa turer’s i stru tio s or with

modifications to application temperature and ratio of two components.

This report summarizes the test results with test conditions and material information. To

compare emission strength of different materials and compounds, the emission factors

measured at 24 hour were used since data sets at later hours (e.g., 96 hour) tend to be subject

to bigger analytical uncertainties due to their low concentrations. Indoor air concentrations in

Canadian homes were estimated using empirical emission models based on all emission factors

(13)

2 Methods

2.1

Test procedures

2.1.1

List of test specimens

The test materials were purchased at several retail outlets in Ottawa between October and

December 2013 and tested between October 2013 and February 2014. Two exceptions were

two spray foam insulation specimens donated by a manufacturer. The specimens (SPF2 and 3)

were applied at the manufacturer

’s lo atio and sent to the NRC lab within 1 day after

application. Table 1 summarizes 30 test specimens grouped into three categories, including

wood, insulation and paint. More detailed information on each specimen can be found in Table

A. 1.

Table 1: Summary of test materials

Category

Subcategory

Detailed subcategory

Test ID

Wood (8)

Kitchen

furniture &

Door (3)

Interior door (1)

DI1 (hollow core, primed, high-density fiberboard, HDF)

Kitchen cabinet door (1)

KC1 (primed, HDF)

Kitchen countertop (1)

CT3 (laminate, plastic coated-paper on particle board)

Structural (5)

I-beam joist (4)

IB3

pi e lo k, O“B e , 9. H, light-colored resin)

IB4

pi e lo k, O“B e , 9. H, open joist, light-c resin)

IB5

pi e lo k, O“B e , 9. H, dark-colored resin)

IB6

pi e lo k, O“B e , 9. H, dark-colored resin)

Subfloor (1)

OSB10 (OSB with foam

– extruded polystyrene)

Insulation

(12)

Loose (4)

Organic (2)

INS3 (recycled denim)

INS4 (cellulose)

Inorganic (2)

INS5 (stone wool)

INS9 (fiberglass)

Foam board

(3)

Polystyrene board (2)

INS7 (extruded polystyrene, XPS)

INS8 (expanded polystyrene, EPS)

Polyisocyanurate (1)

INS10 (polyisocyanurate)

Other (1)

INS6 (high performance, reflective)

Spray foam

(4)

One-component (1)

SPF4 (fills larger gaps, triple expanding foam)

Two-component (4)

SPF1 (low pressure, do-it-yourself product, 4 variations)

SPF2 (closed cell, rigid, soya)

SPF3 (open cell, semi-rigid, low pressure)

Paint (10)

Latex (white)

1

(10)

VOC content ~0 g/L

2

PT15 (paint & primer in one)

VOC content < 5 g/L

PT16 (base for dark color)

PT16c1 (PT16 + dark colorant)

VOC content < 50 g/L

PT18 (recycled)

VOC content < 150 g/L

PT13 (base for light color)

PT13c1 (=PT13 + dark colorant)

3

PT13c2 (=PT13 + light colorant)

3

PT13p (=PT13 on primed substrate)

PT 7 lo VOC , eggshell, same as PT12 tested previously)

(14)

2.1.2

50-L chamber tests

The material emissions test with 50-L chambers was conducted in accordance with ASTM D

5116-10, which is the standard guide for small-scale environmental chamber determinations of

organic emissions from indoor materials/products (ASTM, 2010). Four electro-polished

stainless steel 50 L chambers were operated simultaneously. The test conditions were set at 50%

RH, 23

o

C and 1 air change per hour. Three chambers were enclosed in an environmental

chamber and the fourth chamber was placed in a room, both of which were maintained at a

constant temperature of 23 ± 0.5

o

C.

Clean air for the chambers was supplied using an Aadco Model 737 Pure Air Generator.

The humidity of the supply air was maintained at a constant level of 50 ± 0.25% RH through the

use of mass flow controllers to blend separate streams of Aadco air (one dry and one saturated

by bubbling air through HPLC-grade water).

A test lasted for 4 days with air sampling at 0 h, 3 h, 6 h, 1 day, 2 days, 3 days and 4 days for

wood and insulation materials. For paint, the test duration was 7 or 8 days with an additional

7-day or 8-day sample to cover the longer decay period of paint samples. One background air

sample collected for each test was to verify chamber cleanliness. Detailed information on test

parameters is summarized in Table A. 2 in the appendix.

2.1.3

Preparation of wood materials

For three of the wood materials (DI1, KC1, and OSB10), the test specimen was enclosed in

an electro-polished stainless steel sample holder (~0.2 m x 0.1 m). The specimen edges were

sealed with the specimen holder to ensure a tight fit such that only the upper surface was

exposed to the chamber air (Figure 1). The upper surface area was considered as the area for

emissions. Due to their irregular shape, the I-beam joist materials were tested without a

specimen holder (Figure 2). The kitchen countertop specimen was also tested without a

specimen holder since one edge and the bottom of the countertop (both uncoated) are

typically exposed to air (Figure 3). In both cases without a specimen holder, all the surface

areas exposed to air were measured.

(15)

Figure 3: Kitchen countertop without a holder

Figure 4: Paint specimen applied on a gypsum board

2.1.4

Preparation of paint specimens

Paints were

applied o a / thi k standard gypsum board (~0.2 m x 0.1 m; Figure 4) for

which background emissions had been determined to be negligible compared to strong

emissions from liquid-based materials such as paint. Since the edges of the gypsum board

substrate can act as a sink of emitted compounds, sealing of substrate edges was required. The

regular specimen holder used for dry materials could not be used since it was designed to be in

contact with the wet surface, which could lead to contamination and replacement of seals for

every test. Therefore, a metal holder that can fit the substrate tightly without any contact with

the wet surface was used. However, it should be noted that the edge sealing with the new

metal holder was likely to be less tight than the regular specimen holder.

2.1.5

Preparation of insulation materials

For loose fit insulations such as recycled denim, cellulose and stone wool, the specimen

covered the entire bottom surface of the chamber (Figure 5). For insulation boards and cured

spray foam insulation specimens prepared professionally, the specimens were cut to fit the

electro-polished stainless steel sample holder with edges sealed (~0.2 m x 0.1 m) (Figure 6).

Two

do-it- ourself DIY spray foam insulation and sealant products (SPF1 and SPF4) were

applied in galvanized steel specimen holders and tested within 1 hour with the intention of

capturing early emissions of blowing agents and amine catalysts. The two-component DIY

spray foam insulation (SPF1) was applied in a galvanized metal specimen holder (~0.2 m width x

0.254 m length x 0.05 m height) covered with aluminum foil (Figure 7). The one-component DIY

spray foam intended for large gaps around doors and windows (SPF4) was applied in multiple

smaller galvanized holders (0.0254 m width x 0.254 m length x 0.0254 m height) to simulate

large holes (Figure 8). While effort was made to measure the area of the irregular surfaces, the

(16)

Figure 5: Insulation covered the entire bottom of the

chamber

Figure 6: Insulation board inside a specimen holder

(17)

2.2

Chemical analysis

The target VOC list is similar to that in the previous study (Won et al., 2013) with three

exclusions; very volatile organic compounds such as 1,3-butadiene, ethylene oxide and

propylene oxide were excluded since VVOCs require a low cryo-focusing temperature (-120 C),

leading to instability and difficulty in the chemical analysis. Also, no or very low detection

frequency of the three compounds in the previous study played a role in exclusion.

Consequently, a total of 121 VOCs were analyzed using three different sampling media,

including two-layer sorbent tube (Tenax TA and Carbograph 5D) for VOCs, Tenax TA tube

coated with pentafluorophenylhydrazine (PFPH) for acrolein and a cartridge coated with

2,4-dintrophenylhydrazine (DNPH) for formaldehyde, acetaldehyde and propanal (Table 2).

PFPH coating was achieved by passing a nitrogen stream (40 mL min

-1

) through a bubbler

containing PFPH maintained at 50 C for 20 min. Since acrolein was seen to break-through the

PFPH-coated sampling tubes at a volume greater than 0.5 L, two tubes were connected if the

sampling volume was greater than 0.5 L.

The sampled tubes (Tenax/Carbograph and Tenax coated with PFPH) were thermally

desorbed and analyzed with gas chromatography-mass spectrometry (TD/GC/MS). DNPH

cartridges were extracted with acetonitrile and analyzed with high performance liquid

chromatography with a UV detector (HPLC/UV).

The chemical properties, structures and CAS reference numbers for the 121 compounds

are listed in Table 3.

Table 2: Sampling media and chemical analysis methods

Group 1

Group 2

Group 3

Target

compounds

• VOCs: compounds

between hexane and

hexadecane

• Acrolein

Low molecular aldehydes

• For aldeh de

• Acetaldehyde

• Propa al

Sampling media 2-Layer sorbent tube

(Tenax TA & Carbograph

5TD)

Tenax TA tube coated with

PFPH (40 mL min

-1

for 20 min

at 50

C)

Commercial cartridge

coated with DNPH

Sampling

volume

 2 to 6 L

(20 to 25 min at 80 to

250 mL min

-1

for dry

materials)

 1.5 to 6 L

(10 to 25 min at 150 to

250 mL min

-1

for liquid

products)

 0.5 L (single tube) at 20 mL

min

-1

 2 L (two tubes in series) at

20 mL min

-1

18 to 36 L

(60 to 120 min at 300 mL

min

-1

)

Extraction

Thermal

Thermal

Liquid

(18)

Table 3: Properties and method detection limits of 121 NRC ME target compounds

#

CAS #

a

Compound

MW

b

BP

c

Qion

d

MDL (ng)

e

Mixture

j

Structure

1

Al

co

h

o

ls

f

71-36-3

1-Butanol

74

114

56

1.5

JMix

2

71-23-8

1-Propanol

60

90

59

2.5

JMix

3

104-76-7

Hexanol, 2-ethyl-1-

130

189

57

3.1

B

4

67-63-0

i

2-Propanol

60

67

45

1.4

JMix

5

64-17-5

Ethanol

46

65

45

2.4

JMix

6

108-95-2

Phenol

94

170

94

1.7

B

7

Al

d

ehydes

&

ket

o

n

es

f

78-93-3

Methylethyl ketone 72

70

43

1.7

JMix

8

67-64-1

Acetone

58

45

43

1.5

JMix

9

98-86-2

Acetophenone

120

190

105

10.4

A

10

108-94-1

Cyclohexanone

98

155

55

11.3

A

11

108-10-1

Methylisobutyl

ketone

100

105

43

2.0

JMix

12

100-52-7

Benzaldehyde

106

181

106

12.6

A

13

123-72-8

Butanal

72

85

44

13.3

A

14

112-31-2

Decanal

156

216

82

1.4

JMix

15

3913-81-3

2-Decenal

154

222

55

14.1

A

16

98-01-1

Furfural

96

144

96

10.1

A

17

111-71-7

Heptanal

114

155

70

3.4

A

18

66-25-1

Hexanal

100

132

56

14.6

A

19

124-19-6

Nonanal

142

196

57

1.7

JMix

20

18829-56-6

2-Nonenal

140

203

55

6.6

A

21

124-13-0

Octanal

128

176

84

7.8

A

(19)

Table 3 (continued)

#

CAS #

a

Compound

MW

b

BP

c

Qion

d

MDL (ng)

e

Mixture

j

Structure

24

Al

ip

h

ati

c Hydro

carb

o

n

s

f

107-83-5

Pentane, 2-methyl-

86

56

71

0.7

B

25

96-14-0

Pentane, 3-methyl-

86

56

57

0.5

B

26

540-84-1

2,2,4-Trimethylpentane

114

81

57

0.9

JMix

27

108-08-7

2,4-Dimethylpentane

100

66

57

0.4

JMix

28

124-18-5

Decane

142

165

57

1.7

JMix

29

112-40-3

Dodecane

170

206

57

1.4

JMix

30

142-82-5

Heptane

100

96

71

0.8

JMix

31

544-76-3

Hexadecane

226

277

57

0.5

JMix

32

110-54-3

Hexane

86

72

57

1.3

JMix

33

111-84-2

Nonane

128

143

57

1.8

JMix

34

111-65-9

Octane

114

120

43

1.7

JMix

35

629-62-9

Pentadecane

212

261

57

0.8

JMix

36

629-59-4

Tetradecane

198

243

57

0.9

JMix

37

629-50-5

Tridecane

184

225

57

1.1

JMix

38

1120-21-4 Undecane

156

186

57

1.9

JMix

39

Ar

o

m

ati

c h

y

d

ro

ca

rb

o

n

s

f

95-93-2

Benzene,

1,2,4,5-tetramethyl-

134

191

119

1.2

JMix

40

611-14-3

Toluene, 2-ethyl-

120

170

105

1.4

JMix

41

620-14-4

Toluene, 3-ethyl-

120

170

105

1.4

JMix

42

622-96-8

Toluene, 4-ethyl-

120

170

105

2.3

JMix

43

4994-16-5 Cyclohexene, 4-phenyl

158

240

104

2.2

B

44

71-43-2

e

Benzene

78

102

78

1.6

JMix

45

526-73-8

Benzene,

1,2,3-trimethyl-

120

170

105

1.3

JMix

46

95-63-6

Benzene,

1,2,4-trimethyl-

120

170

120

1.6

JMix

47

95-47-6

e

Benzene,

1,2-dimethyl-

106

148

91

1.5

JMix

(20)

Table 3 (continued)

#

CAS #

a

Compound

MW

b

BP

c

Qion

d

MDL (ng)

e

Mixture

j

Structure

48

Ar

o

m

ati

c H

y

d

ro

carb

o

n

s

(co

n

ti

n

u

ed)

f

108-67-8

Benzene,

1,3,5-trimethyl-

120

170

105

2.0

JMix

49

108-38-3

e

Benzene,

1,3&(4)-dimethyl-

106

148

91

4.5

JMix

50

98-82-8

Benzene, isopropyl

120

157

105

3.1

B

51

103-65-1

Benzene, propyl-

120

170

91

2.5

B

52

100-41-4

e

Ethylbenzene

106

148

91

1.8

JMix

53

91-20-3

Naphthalene

128

232

128

3.8

B

54

99-87-6

p-Cymene

134

178

119

3.5

B

55

100-42-5

Styrene

104

147

104

2.2

JMix

56

108-88-3

Toluene

92

126

91

1.4

JMix

57

98-83-9

2-Phenylpropene

118

163

118

3.9

B

58

95-13-6

Indene

116

182

115

3.3

B

59

Est

ers

f

108-21-4

Acetic acid,

1-methylethyl ester

102

88

43

1.7

B

60

111-15-9

Acetic acid,

2-ethoxyethyl ester

132

149

59

2.6

B

61

123-86-4

Acetic acid, butyl

ester

116

126

43

2.4

JMix

62

141-78-6

Acetic acid, ethyl

ester

88

78

43

1.6

JMix

63

80-62-6

Methyl methacrylate

100

94

69

2.1

B

64

103-09-3

2-Ethylhexyl acetate

172

199

70

3.3

B

65

96-48-0

Butyrolactone

86

177

42

2.5

B

66

25265-77-4

Texanol

216

258

71

3.6

B

67

6846-50-0

TXIB *

286

272

71

2.2

B

(21)

Table 3 (continued)

#

CAS #

a

Compound

MW

b

BP

c

Qion

d

MDL

(ng)

e

Mixture

j

Structure

68

Gl

yc

o

ls, Gl

y

co

Et

h

ers

f

57-55-6

1,2-Propanediol

76

155

45

6.2

A

69

110-49-6

2-Methoxyethylacetate

118

127

43

10.7

A

70

111-90-0

Diethylene glycol

monoethyl ether

134

202

45

3.0

A

71

107-98-2

Propanol, 1-methoxy-2-

90

117

45

6.0

A

72

111-76-2

Ethanol, 2-butoxy-

118

181

87

4.9

A

73

112-34-5

Ethanol, 2-butoxyethoxy-

162

240

45

4.0

A

74

110-80-5

Ethanol, 2-ethoxy-

90

138

59

8.7

A

75

109-86-4

Ethanol, 2-methoxy-

76

115

45

6.0

A

76

75-65-0

Propanol, 2-methyl-2-

74

70

59

11.0

A

77

5131-66-8

Propylene glycol

monobutyl ether

132

183

57

7.9

A

78

H

al

o

Carb

o

n

s

f

71-55-6

1,1,1-Trichloroethane

133

66

97

0.4

JMix

79

95-50-1

1,2-Dichlorobenzene

147

182

146

3.7

B

80

107-06-2

i

1,2-Dichloroethane

99

105

62

1.0

JMix

81

78-87-5

1,2-Dichloropropane

113

101

63

1.4

JMix

82

106-46-7

i

1,4-Dichlorobenzene

147

175

146

1.6

JMix

83

75-27-4

Bromodichloromethane

164

118

83

2.5

JMix

84

56-23-5

i

Carbon tetrachloride

154

80

117

0.9

JMix

85

67-66-3

i

Chloroform

119

91

83

0.7

JMix

86

124-48-1

Dibromochloromethane

208

143

129

3.1

JMix

87

75-09-2

i

Dichloromethane

85

80

84

1.0

JMix

88

127-18-4

i

Tetrachloroethylene

166

114

166

1.0

JMix

89

79-01-6

Trichloroethylene

131

85

130

1.0

JMix

(22)

1,1,2,2-Table 3 (continued)

#

CAS #

a

Compound

MW

b

BP

c

Qion

d

MDL (ng)

e

Mixture

j

Structure

91

Cy

cl

o

Al

kan

es

f

108-87-2

Methylcyclohexane

98

107

83

2.7

B

92

110-82-7

Cyclohexane

84

90

84

1.2

B

93

1678-93-9

Cyclohexane, butyl-

140

174

83

2.5

B

94

1678-91-7

Cyclohexane, ethyl-

112

130

83

2.4

B

95

1678-92-8

Cyclohexane, propyl-

126

153

83

1.8

B

96

493-02-7 (trans)

91-17-8 (cis)

Decahydronaphthalene

138

180

138

3.3

B

97

Te

rp

enes

f

80-56-8

alpha-Pinene

136

157

93

1.6

JMix

98

99-86-5

alpha-Terpinene

136

169

121

5.6

B

99

127-91-3

beta-Pinene

136

151

93

1.3

JMix

100

99-85-4

gamma-Terpinene

136

169

93

2.8

B

101

13466-78-9

3-Carene

136

157

93

2.5

B

102

79-92-5

Camphene

136

151

93

1.6

B

103

5989-27-5

Limonene

136

168

68

1.9

JMix

(23)

Table 3 (continued)

#

CAS #

a

Compound

MW

b

BP

c

Qion

d

MDL (ng)

e

Mixture

j

Structure

104

Aci

d

s

f

64-19-7

Acetic acid

60

122

60

11.1

A

105

79-31-2

Isobutyric acid

88

154

73

4.2

A

106

107-92-6

Butyric acid

88

167

60

5.1

A

107

111-14-8

Heptanoic acid

130

227

60

7.1

A

108

149-57-5

2-Ethylhexanoic

acid

144

234

88

6.4

A

109

142-62-1

Hexanoic acid

116

208

60

3.7

A

110

109-52-4

Pentanoic acid

102

188

60

6.8

A

111

Ot

h

er

f

3777-69-3 Furan, 2-pentyl

138

176

81

7.0

B

112

872-50-4

2-Pyrrolidinone,

1-methyl-

99

202

99

1.0

B

113

123-91-1

1,4-Dioxane

88

103

88

1.9

B

114

78-40-0

Triethyl phosphate

182

233

99

3.0

B

115

142-96-1

n-Butyl ether

86

56

57

2.0

B

116

96-29-7

2-Butanone oxime

87

157

42

12.7

A

117

121-44-8

Triethylamine

101

95

86

7.6

A

118

D

N

P

H

g

75-07-0

i

Acetaldehyde

44

34

6.6

TO11

119

50-00-0

Formaldehyde

30

10

10.0

TO11

120

123-38-6

i

Propanal

58

60

13.3

TO11

121

PFPH

h

107-02-8

i

Acrolein

56

58

0.9

Acr

a

CAS #: Chemical Abstracts Service number,

b

MW: molecular weight,

c

BP: boiling point from EPI Suite

(US EPA, 2011);

d

Qion: quantifying ions used for quantification;

e

MDL: method detection limit;

f

Tenax/Carbograph 5TD sampling;

g

DNPH sampling;

h

PFPH sampling;

i

Health Canada targets;

j

Five

separate calibration mixtures were used: custom-made mixture A (A), custom-made mixture B (B),

commercial Japanese indoor air standards mixture (JMix), TO-11 aldehyde/ketone-DNPH mixture

(TO11), and PFPH-acrolein mixture (Acr)

(24)

2.2.1

Two-layer sorbent tube sampling and analysis

Two-layer sorbent tubes (178 x 6 x 4 mm) packed with Carbograph 5TD (180 mg) and Tenax

TA (106 mg) were purchased from CAMSCO.

Sampling was conducted using a mass flow

controlled pump at 100 to 150 mL m

-1

for 10 to 25 min, leading to a sampling volume of 1.5 to 2

L when the concentrations were expected to be relatively high. The sampling volume was

increased to ~6 L at 250 mL min

-1

for samples with relatively low concentrations

(

Table 2

).

Air samples collected on sorbent tubes were thermally desor

bed and analyzed with a

GC/MS system, including a Gerstel thermal desorption unit (TDS) connected with an

autosampler (TDS-A), an Agilent 6890 Gas Chromatograph equipped with a DB-624 capillary

column (30 m × 0.25 mm I.D. × 1.4 µm thickness), and a 5973N Mass Selective Detector. The

desorbed analytes were injected using a Gerstel programmable temperature vaporizer called a

Cooled Injection System (CIS), which concentrated the sample prior to injection onto the

Agilent 6890 column. The Gerstel system was operated in the TDS splitless /CIS split mode (split

ratio of 20:1) and the MS was operated in the full scan mode (m/z 35 to 300).

Temperature profiles for the thermal desorption and GC/MS analyses are as follows:

• Thermal desorption conditions: initial temperature of 30 °C to a final temperature of 300

°C with a rate of 60 °C min

-1

with a holding time of 5 min at the end.

• CI“ o ditio s: i itial te perature of -90 °C to a final temperature of 300 °C with a rate of

12°C s

-1

with a holding time of 3 min at the end.

• GC o ditions: an initial temperature of -10 °C holding 4 min, then increasing to a

temperature of 230

o

C with a rate of 6°C min

-1

, then increasing at 15°C min

-1

to a final

temperature of 250

o

C and holding for 2 min.

Calibration of 121 compounds was performed using three sets of liquid mixtures. For the

calibration of regular VOCs, a commercial calibration mixture (Japanese Indoor Air Standards

mixture;

μg L

-1

each in methanol: water = 19: 1) and two custom-made standard mixtures

(A and B, 5

μg L

-1

for each chemical in methanol) were purchased from Supelco (Table 3).

Each of these standard mixtures was diluted to accommodate the GC/MS analysis conditions

and target analytes in samples.

The calibration liquid mixture was injected onto the glass frit of the two-layer sorbent tube

while air was drawn into the tube at 50 - 100 mL min

-1

for 2 minute. A 5-point calibration was

achieved by introducing five different volumes of calibration mixture onto the tubes, resulting

in five concentration levels (Table 4). Linear calibration curves were obtained with an R

2

value

between 0.90 and 0.99, with lower R

2

values for acids, esters and glycol ethers.

Compounds were identified by comparing their mass spectrum with the NIST Mass Spectral

Library (NIST98, version 1.7a) and retention time with those from the standard mixtures. They

were identified by target ions and quantified by peak areas from the quantification ion. The

quantifying ions are summarized in Table 3.

(25)

Table 4: Ranges and correlation coefficients (R

2

) of calibration curves

Type of mixture

Custom Mix A

Liquid Mixture

1

Custom Mix B

Liquid Mixture

1

Japanese IAQ Mix

Liquid Mixture

1

Range & R

2

value

25-250 ng

(R

2

: 0.90

– 0.99)

10-100 ng

(R

2

: 0.93

– 0.99)

5-50 ng

(R

2

: 0.93 -0.99)

1

See Table 3 for the list of different calibration mixtures

2.2.2

PFPH tube sampling and analysis

A Gerstel Tenax TA tube (178 x 6 x 4 mm) was coated with 1.4

μ ol of PFPH usi g a i

-house coating system (Won and Yang, 2012).

The sampling volume was either 0.5 L (single

tube) or 2 L (two tubes in series) at 20 mL min

-1

. The reduced sampling volume and rate were

to prevent break-through as discussed in Section 2.2.4.3.

After sampling, all samples were stored at room temperature at least for three days to

ensure complete reaction of collected compounds and PFPH before being analyzed. Samples

collected on PFPH-coated tubes were thermally desorbed and analyzed using a TD-GC/MS

system: Gerstel thermal desorption unit (TDS-3) connected with an autosampler (TDS-A), an

Agilent 6890 Gas Chromatograph equipped with a DB-5MS capillary column (30 m × 0.25 mm

I.D. × 0.25 µm thickness), and a 5973N Mass Selective Detector. The Gerstel system was

operated in the TDS splitless /CIS split mode (split ratio of 20:1) and MS was operated in

Selected Ion Mode by monitoring three ions for acrolein-PFPH derivative derivatives (155, 182

and 236).

Temperature profiles for the thermal desorption and GC-MS analyses are as follows:

• Ther al desorptio o ditio : a i itial te perature of °C to a fi al te perature

°C with a rate of 60°C min

-1

with a holding time of 5 min at the end.

• CI“ o ditio : a i itial te perature of -50 °C to a final temperature of 300 °C with a rate

of 12°C s

-1

with a holding time of 15 min at the end.

• GC o ditio : a i itial te perature of °C holdi g i to a te perature

°C ith

a rate of 7 °C min

-1

, then to a final temperature of 300

o

C with a rate of 8°C min

-1

. The holding

time at the final temperature was 5 min.

Calibration for acrolein was performed by analyzing Tenax tubes spiked with

acrolein-PFPH derivative prepared in hexane. The liquid calibration standard was prepared by mixing

acrolein (96.4% purity, provided by Supelco Inc.) with PFPH, of which the amount was at least

10 times more than the mole of acrolein in hexane. Calibration samples were prepared by

injecting 1, 2.5, 5, 7.5 and 10 L of the prepared liquid calibration solution onto Tenax tubes,

resulting in five concentration levels from 5 ng to 50 ng of acrolein-PFPH derivative per sample.

The calibration curves were then established by plotting the peak area of the quantification ion

(26)

calibration curves ranged from 0.95 to 0.99. Acrolein-PFPH peak in the test samples was

identified by comparing its mass spectrum with the target ions, and quantified by the

quantification ion.

2.2.3

DNPH cartridge sampling and analysis

Waters Sep-Pak XPoSure Aldehyde samplers, which contained acidified DNPH-coated silica,

were used for sampling of low molecular carbonyl compounds. Sampling was conducted at 300

mL min

-1

for 60 to 120 min to give sampling volumes of 18 to 36 L.

Analysis of carbonyl compounds was performed in accordance with ASTM D5197 and EPA

TO-11. Exposed cartridges were washed with acetonitrile, and the eluate then analyzed by

reverse phase HPLC with UV detection at 360 nm (Varian Model 9012 Solvent Delivery System/

9050 Variable Wavelength UV-VIS Detector / Prostar 410 Autosampler; two Supelcosil LC-18

columns (25 cm x 4.6 mm, 5 m) in series at 30

o

C). A gradient of acetonitrile in water from

60% to 100% was used for separation of the carbonyl compounds. System calibration was

performed using a six-point calibration from a commercial DNPH derivative mixture

(TO-11/IP-6A Aldehyde/Ketone reference standard from Supelco, Inc). Linear calibration curves were

produced with R

2

between 0.9997 and 0.9999.

2.2.4

Quality assurance and control analysis (QA/QC)

2.2.4.1 Method detection limit

The method detection limit (MDL) was determined in accordance with the Code of Federal

Regulations established by US EPA (40CFR136 Appendix B) (US EPA, 1986). The MDL was

determined by analyzing seven replicates of a calibration tube spiked with the lowest level of

the calibration range. The MDL was calculated by multiplying the standard deviation of the

se e easure e ts ith “tude t’s t value of 3.14. The resulting method detection limits are

summarized in Table 3.

2.2.4.2 Background and blank samples

The quality control procedure involved the analysis of blank and background samples.

Blank samples were analyzed for each run of GC/MS and HPLC/UV. Special care was given to

PFPH tubes made in-house as they were reported to have high blank levels partly due to the

impurities in coating materials and contamination during the coating process (Won et al., 2013).

After a batch of tubes were coated with PFPH, a tube was set aside as a blank tube and later

analyzed with sampled tubes to check the cleanliness of PFPH tubes.

The acrolein level in blank PFPH tubes ranged between 0.1 and 0.9 ng with an average of

0.6 ng. It is not clear why the blank level was reduced by a factor of ten, compared to the

acrolein blank level of 7.1 ng in the previous report (Won et al., 2013). Possible reasons include

(27)

compensated with the calibration since the acrolein calibration was done by injecting the

acrolein-PFPH derivative formed in liquid onto a Tenax tube without PFPH coating. The

reduced sensitivity appears to be in line with the observation that acrolein was detected less

frequently and in relatively low levels in actual chamber tests compared to those in the

previous tests (Won et al., 2013) for similar specimens (e.g., I-beam joists). On the other hand,

this does not explain the observation that chamber background levels remained consistent over

two years (i.e., averaging 1.2 g m

-3

in 2013/14 and 1.1 g m

-3

in 2012/13).

The DNPH cartridges showed the blank level of 20 ng for formaldehyde, 41 ng for

acetaldehyde and 6 ng for propanal on average. In general, the DNPH blank levels were higher

than MDL. To be consistent with the previous study, the blank correction was done for DNPH

and PFPH samples. Tenax-Carbograph tubes did not show high levels of blank values above

MDL except for benzene. The benzene blank level was 1.8 ng, which was slightly higher than

MDL of 1.6 ng. Therefore, the blank correction was made for benzene only.

Background samples were collected in empty chambers prior to each test at the highest

sampling volume employed for three sampling methods. In general, the background levels

were higher than MDL for all three sampling methods. Background levels were subtracted from

the chamber concentrations when the emission factor was estimated as shown in Section 2.3.1.

2.2.4.3 QA/QC for acrolein

In contrast to published results that the PFPH coating method is an accurate method for

acrolein sampling with high sensitivity and high collection efficiency (Ho and Yu, 2004, Li et al.,

2009, Pang et al., 2011), the collection efficiency was found to be much lower. In comparison

to reported collection efficiencies of 99% at 54 mL min

-1

(Ho and Yu, 2004) and 97% at 80 mL

min

-1

(Li et al., 2009), a much reduced collection efficiency was observed in this study when

single tubes were used to collect sample volumes greater than 0.5 L.

The low collection efficiency was observed when air sampling with PFPH-coated Tenax TA

tubes was performed at different sampling rates in a chamber, where the gas containing

acrolein and acetone (1 ppm each) was mixed with air with a resulting concentration of 56 µg

m

-3

. The measured acrolein concentration was observed to decrease with increasing sampling

rate between 2 and 100 mL min

-1

for a sampling volume of 3 L (Figure 9). This indicates that the

adsorption of acrolein vapor by PFPH on the Tenax TA is kinetically limited and breakthrough of

(28)

Figure 9: Acrolein concentrations at different sampling rates (sampling volume of 3 L)

Additional tests were conducted to determine the sampling rate and volume with minimal

breakthrough. Air samples were taken with PFPH-coated Tenax TA tubes from a Tedlar bag,

where 10 µL of acrolein solution (50 ng µL

-1

) and 10 µL of water were injected and vaporized

into 25 L of nitrogen. Three tubes in series were used for sampling for the combination of four

flow rates (5 to 100 or 10 to 150 mL min

-1

) and three sampling volumes (0.5, 1, and 2 L). The

collection efficiency was calculated for a single tube and double tubes using Eq. (1) and Eq. (2),

respectively.

1

2

/

1

%

100

A

A

CE

(1)

1

3

/

1

2

%

100

A

A

A

CE

(2)

where CE is the collection efficiency (%), A

1

, A

2

, and A

3

are the acrolein amount (ng) in the front,

middle, and back tube, respectively.

The collection efficiency for a single tube is presented in Figure 10. There was no

breakthrough of acrolein between 5 to 150 mL min

-1

for a sampling volume of 0.5 L. The

break-through increased with increasing sampling volume. That is, the collection efficiency was ~80%

and ~60% with a sampling volume of 1 and 2 L, respectively. Therefore, a sampling volume of

0.5 L was chosen for acrolein sampling with a single PFPH-coated tube.

When the acrolein concentration is low, it may be necessary to increase the sampling

volume above 0.5 L to collect enough mass above the method detection limit. In this case, two

tubes in series need to be used. Figure 11 shows the collection efficiency for double tubes (two

tubes in series) at different sampling rates and volumes. For sampling volumes of 0.5 L and 1 L,

there was no break-through for double tubes at a sampling rate between 2 and 150 mL min

-1

.

For a sampling volume of 2 L, break-through was observed for a sampling rate of 50

– 150 mL

(29)

Figure 10: Collection efficiency of a single tube at

different sampling rates

Figure 11: Collection efficiency of double tubes at

different sampling rates

The collection efficiency is likely to suffer if there is not enough PFPH coating on a Tenax TA

tube. The amount of PFPH coating was determined using the same analytical method as that

for the PFPH-acrolein derivative. Typically, there was a 10-min delay in the mass spectrometry

operation to protect the detector from a large peak of PFPH. For the PFPH analysis, the solvent

delay was removed. The PFPH calibration was performed by spiking Tenax TA tubes with 1 to

10 µL of PFPH solution (50 µg µL

-1

in methanol).

The effects of three coating parameters, including coating flow rate, temperature, and

time, on the PFPH coating were examined. The amount of PFPH coating was observed to be

proportional to the coating flow rate (Figure 12), temperature (Figure 13), and coating time

(Figure 13). Based on the results, the coating parameters were selected to be 50 C, 40 mL min

-1

and 20 min, which led to the PFPH coating > 1,400 nmol. This is bigger than the literature

values, i.e., 1,000 nmol of PFPH obtained with vapor coating at 20 mL min

-1

and 20 min (Pang et

Figure

Figure 3:  Kitchen countertop without a holder  Figure 4:  Paint specimen applied on a gypsum board
Table 3:  Properties and method detection limits of 121 NRC ME target compounds
Figure 10:  Collection efficiency of a single tube at  different sampling rates
Figure 15:  Amount of PFPH coating on brand-new and used Tenax TA tubes
+7

Références

Documents relatifs

The Canadian Primary Care Sentinel Surveillance Network, a Pan-Canadian project led by the CFPC that conducts standardized surveillance on selected chronic

~ 78 Singles: Überraschende neue Studien zeigen, dass Allein- lebende sich zufrieden über Autonomie, Freundeskreis und Gesundheit auBern.. 82 Forschung: Der Psychologe Hans-Werner

When using the commutations Com true or Com false we always reach the same minimal biword, but the commutation sequence is not unique. With an arbitrary commutation “Com” neither

L’archive ouverte pluridisciplinaire HAL, est destinée au dépôt et à la diffusion de documents scientifiques de niveau recherche, publiés ou non, émanant des

Even with works that I create on my own, I feel like there has been some element of collaboration because I’ve talked to people about the work, asked for advice, etc.. To me, that

For 7 months old coconut water, PCA performed on NIR spectral data distinguished two phases during Stage II (Fig 3b) suggesting that NIRS monitoring was more sensitive

Increasing the sorption surface (i.e., increasing the cell volume) leads to increase equilibrium time between material (PU foam) and air (up to six times longer than for the 60

The French Agency for Environmental and Occupational Health Safety (Afsset) conducted tests in order to characterize VOCs emissions from 32 consumer products: air fresheners,