Blind Benchmark Predictions of the NACOK Air Ingress Tests
Using the CFD Code FLUENT
by
Marie-Anne V. Brudieu
Diplome d'Ingenieur
Ecole Polytechnique, France 2005
Submitted to the Department of Nuclear Engineering
In partial fulfillment of the requirements for the degrees of
Master of Science in Nuclear Engineering
at the
MASSACHUSETTS INSTITUTE OF TECHNOLOGY
February, 2007
Copyright C 2007 Massachusetts Institute of Technology. All Rights Reserved.
A uthor...
..
...
.
Department of Nuclear Engineering
January 15, 2007
Certified
by... ...
...
Professor of the Practice of Nuclear Engineering Andrew C. Kadak
.Thesis Supervisor
Certified by ... . . . .m ... .... . ...
Certified by ...
Assistant Professor Jacopo Buongiorno
Thesis Reader
Accepted by
...
...
...
...
...
WAsso~ate Professor Jeffrey A. Coderre
Chairman, Department Committee on Graduate Students
MASSACHUSETTS INS rWE'
OFTECHNOLOGYOCT
12 2007
LIBRARIES
Blind Benchmark Predictions of the NACOK Air Ingress
Tests Using the CFD Code FLUENT
by
Marie-Anne V. Brudieu
Submitted to the Department of Nuclear Science and Engineering on January 15, 2006, in partial fulfillment of the
requirements for the degree of
Master of Science in Nuclear Science and Engineering
Abstract
The JAERI and NACOK experiments examine the combined effects of natural con-vection during an air ingress event: diffusion, onset of natural circulation, graphite oxidation and multicomponent chemical reactions. MIT has been benchmarking JAERI tests using the FLUENT code for approximately three years [1]. This work demonstrated that the three fundamental physical phenomena of diffusion, natural circulation and then chemical reactions can be effectively modeled using computa-tional fluid dynamics.
The latest series of tests conducted at the NACOK facility were two graphite corrosion experiments: The first test consisted of an open chimney configuration heated to 650C with a pebble bed zones of graphite pebbles and graphite reflectors. The second test is a similar test with a cold leg adjacent to the hot channel with an open return duct below the hot channel. Natural circulation, diffusion and graphite corrosion were studied for both tests. Using and adapting previous computational methods, the FLUENT code is used to blind benchmark these experiments. The objective is to assess the adequacy of the modeling method used in this blind bench-marking analysis by comparing these blind test predictions to the actual data and then modify the model to improve predictive capability. Ultimately, the objective is to develop a benchmarked analysis capability that can be used for real reactors calculations, and to improve the understanding of the physical phenomena taking place during an air ingress event.
This thesis presents the modeling process of these experiments, the blind model results and the comparison of the blind computed data with experimental data. Sen-sitivity studies provide a good understanding of the different phenomena occurring during an air ingress event. The blind benchmarking demonstrates the ability of FLUENT to model satisfactorily in full scale the NACOK air ingress experiment. The blind models are then improved to successfully model air ingress events. An important finding of this work is that there is great variability in graphite corrosion data and that good qualification of specific graphite used is vital to predicting the effects of an air ingress event.
Acknowledgments
I would like to express my deep gratitude to Prof. Andrew Kadak for all his help and support during these 18 months. His kindness and positive views were a real motivation.
Financial support for this thesis was provided by Westinghouse Nuclear. They also showed great interest in the thesis which was a an amazing reward and motivation for further work.
I would like to acknowledge the great help of Rachel Morton and Wenfeng Liu who supported me with patience through FLUENT technical difficulties. I am grateful to Prof Buongiorno for reading this thesis through all the typos and mistakes and I am fondly acknowledging Nicephore and all my friends who offered a compassionate ear to my complaints.
I would like to express all my love to my family back in France, who never doubted of my success. I am deeply thankful for Eric and the Walkers who became my family on this side of the pond and offered me love and support.
Contents
1 Introduction
1.1 Context . . . .. . . . 1.2 The Pebble Bed Modular Reactor (PBMR) [5] . . . 1.3 The air ingress accident ...
1.3.1 Description of the phenomena ... 1.3.2 Past experiments and Benchmarks ...
The NACOK experiments (Naturzug im Core mit Korros:
2.1 NACOK . . . .
2.2 The new air ingress experiments ...
2.2.1 Description of the Open Chimney Test (March 2004) 2.2.2 Description of the Return-Duct Test (July 2004) . . . 2.3 Materials and graphite ...
2.3.1 The reflector graphite: ASR-1RS . ... 2.3.2 The matrix pebble graphite: A3-3 . ...
2.4 Visualisation of the NACOK experiment . ... . .
ion)
3 Modeling NACOK with FLUENT
3.1 Validation of a Computational Fluid Dynamics Code [10], [11] . ...
3.2 Procedure followed for the blind benchmarking of the NACOK exper-im ents . . . . 2 . . . . 18 . . . . 21 . . . . 21 . . . . 26 .... 28 . . . . 28 ... . 29 ... . 29
33
33
353.3 Detailed description of the general FLUENT model used in NACOK
computations, [12], [26] ... 37
4 Chemistry models in the event of an air ingress accident 47 4.1 Chemistry in an air ingress event . ... . 47
4.1.1 Reactions . . . .. .. . . . .. .. . .. . .. . . 47
4.1.2 Mechanisms and Regimes of graphite corrosion ... . 49
4.2 Modeling chemistry in FLUENT ... 51
4.2.1 Species transport ... 51
4.2.2 Chemistry model [12] ... 52
4.3 Graphite corrosion reaction rates . ... . 53
4.4 Reaction rates input in FLUENT ... 56
4.4.1 Correlations chosen for the NACOK graphite oxidation modeling 56 4.4.2 Carbon monoxide oxidation reaction rate . ... 58
4.4.3 Boudouard reaction rate ... .. 59
4.4.4 Stoichiometry variation of the graphite oxidation reaction with tem perature . .. ... ... 59
4.4.5 Importance of the burn-off on graphite oxidation rate ... 61
5 Sensitivity studies 62 5.1 Pressure loss in the pebble beds ... 62
5.2 Modeling the reflector as a porous media . ... 67
5.3 Modeling diffusion mass transfer ... .. 70
5.4 Modeling steady state flow for the return duct chimney ... 74
5.5 Chemistry Sensitivity studies ... ... 76
6 Results of the Benchmarking of the Open Chimney Test, March 2004 84 6.1 The Blind Benchmark Model ... 85
Description ...
First estimate of graphite loss . . . Results . . . . Further analysis of the experimental models and runs . . . ....
Temperature of 900C . . . .. Modified chemistry model ...
7 Results of the Benchmarking of the Return Chimney
2004
Test, July
103
7.1 Stage one of Blind Benchmarking : the diffusion process and onset ofnatural convection ...
7.1.1 The transient diffusion model . . . . 7.1.2 R esults . . . . 7.2 Stage two of Blind Benchmarking: Steady state calculation of the hot
channel final state ...
7.2.1 The steady state model ...
7.2.2 R esults . . . . 7.3 The modified model ...
8 Conclusions and Future Work
8.0.1 Future work ...
9 Summary of the main variables in FLUENT models
Nomenclature Table
Appendices
.105 .106. 107
. 109 .109 .110 . 113 117 .119 120 121 127 6.1.1 6.1.2 6.1.36.1.4
6.2 Other 6.2.1 6.2.2 resultsList of Figures
1-1 PBMR power conversion cycle ...
4
1-2 PBMR plant diagram ...
5
1-3 Fuel pebbles ...
...
6
1-4 Natural circulation process after a break in a coaxial pipe
.
.
8
1-5 Air ingress accident stages in a pebble bed reactor
...
9
1-6 Interaction between air ingress event parameters ...
10
1-7
The JAERI experimental configuration ...
12
1-8 The JAERI mesh, 490 hexahedral cells and 1850 mixed cells
13
1-9 Mole Fraction of N2 Benchmarking of the Isothermal JAERI
Experim ent ...
14
1-10 Comparison of mole fraction change of nitrogen between the
gas sampling positions H-1 and C-1 in the thermal experiment 15
1-11 Example of good agreement between simulation and
experi-ment on JAERI multi-component experiexperi-ment at H3 measure
point. At time 100 min, one can observe the onset of natural
convection ...
. 16
2-1 Overall set up of the NACOK experimental facility ...
19
2-2 Photo of the set up of the NACOK experimental facility[13]
20
2-3 Open chimney experiment drawing [13] ...
23
2-4 Lower channel experimental setting for open chimneyexper-im ents[13] ...
24
2-5 Mesh of the lower channel, when reflectors are modeled in
detail . . . 25
2-6 Plans and picture of arrangement for the 96 channels
reflec-tors and lower reflector. Top left: top view of the lower
reflectors. Top right and bottom left: top view of the fine
reflectors. Bottom right: picture of the fine reflectors. . . . . 26 2-7 Global experimental setting for return duct experiments . . . 27
2-8 Initial temperature distribution in the return duct experiment 28
2-9 Lower channel set up ...
30
2-10 Reflectors. On the left, before the experiment, on the right,
after the experiment [131 ...
31
2-11 Entry chamber, with four graphite columns. On the left,
before the experiment, on the right, after the experiment [13] 31
2-12 60 mm diameter pebbles. The cables are linked to
temper-ature and species measurement devices located in the lower
chimney and pebble bed ...
32
3-1 Zones name in the FLUENT model ...
38
4-1 Corrosion Regimes ...
50
4-2 Comparison of the graphite oxidation and Boudouard
reac-tion rates (Rc,))
...
54
4-3 Various correlations of stoichiometry coefficient ratio
evolu-tion with respect to the temperature ...
60
5-1 5 m high pebble bed pressure drop (Pa) vs. air flow
veloc-ity (m/s) as input in FLUENT, Kuhlmann correlation and
power law equation ...
64
5-2 Comparison between Ex (Experiments) and Co
(Computa-tions) for the natural convection NACOK test: superficial
5-3 Comparison between Ex (Experiments) and Co
(Computa-tions) for the natural convection NACOK test: physical
ve-locity option ...
66
5-4 Detailed 96 channels reflector as modeled for the sensitivity
studies . . . 69
5-5 Comparison of the pressure loss at different flow velocities
for a detailed reflector model and simplified porous media
model ...
.
...
69
5-6 Comparison between theoretical curves as calculated by PBMR
[33] and FLUENT kinetic model of the diffusion in a vertical
tu b e . . . .
.
. . . 72
5-7 Model configuration for diffusion sensitivity analysis ...
73
5-8 Evolution of the mass fraction of helium in an open
hori-zontal tube (in the center of the square) in a volume filled
with nitrogen. Red (dark) corresponds to a mass fraction of
helium
=
1 and blue (light) to a mass fraction of helium
=
0
73
5-9 Temperature distribution in Kelvins in the hot and cold leg . 74
5-10 Mass flow rate with respect to time steps. A steady state is
reached for a mass flow rate of 4.3g.s- ... 75
5-11 Chemistry sensitivity studies model ...
76
5-12 Evolution of the species molar fraction with respect to time
78
6-1 Mesh of the lower part of the experiment ...
86
6-2 Estimate of the maximum graphite loss in 8 hours ...
88
6-3 Flow Temperature distribution in the open chimney test . . . 89
6-4 Computed molar fractions in the open chimney test.
Exper-imental data not available ...
90
6-5 Mass fractions of
CO
2on the left,
CO
in the middle and
02
on the right ...
91
7-1 Geometry and mesh and of the main channel, return ducts
and surroundings ...
106
7-2 Diffusion process in the return duct experiment at 80 seconds
and 163 min. The scale represents the nitrogen mass fraction. 107
7-3 Diffusion process in the return duct experiment at 4.4 hours
and onset of natural convection. The scale represents the
nitrogen mass fraction. ...
108
7-4 Temperature Experimental conditions of the external walls
of the main channel ...
111
7-5 Experimental Gas Temperature at different height levels.
hXXX corresponds to the height in mm and the names refer
to the instruments in the return duct experiment. ...
112
7-6 Comparison of computed and experimental temperatures for
the blind FLUENT return duct experiment at 8 hours . . .. 114List of Tables
1.1 PBMR design parameters ...
4
2.1 ASR-1RS properties [9] ...
. 29
3.1 M ixture properties [12] ...
43
4.1 Chemical reactions taking place during an air ingress event
.
48
5.1 Stoichiometry sensitivity study ...
79
5.2 Corrosion reaction rates sensitivity study for same flow rates
and initial temperatures of 923 K ...
80
5.3 Boudouard reaction sensitivity analysis ...
81
5.4 Stoichiometry sensitivity study with UDF ...
82
6.1 Open chimney computation and experiment key results . . . 88
6.2 Graphite corrosion location for the blind model ...
96
6.3 Comparison of computed and experimental temperatures for
the adapted and blind FLUENT open chimney model .... 99
6.4 Graphite corrosion location for the blind and adapted model 100
7.1 Comparison of computed and experimental temperatures for
the blind FLUENT return duct experiment ...
113
7.2 Comparison of computed and experimental temperatures for
7.3 Graphite corrosion location for the adapted model of the return duct experiment ... 116 9.1 Modifiable variables in FLUENT models . ... . 120
xiii'.
Chapter 1
Introduction
1.1
Context
The United States of America and more generally the world, is experiencing times of great change in the energy market, consumption and production. The Generation IV initiative [7] was launched to answer the challenges raised by this new growing demand for clean energy. There are different designs of Generation IV reactors un-dergoing current research and development. One of these reactors, the Very High Temperature Reactor, utilizes graphite for moderation and helium for coolant. Its core can be either prismatic or a pebble bed. The electricity production of this reactor comes from more efficient Brayton cycles, with coolant outlet temperatures ranging from 850C to 950C. The high temperatures produced by these types of re-actors provide the possibility to use them for many other applications, including Hydrogen production.
This thesis focuses on the safety of Pebble Bed reactors during an hypothetical air ingress accident. The Pebble Bed Modular Reactor, (PBMR) is being developed in the Republic of South Africa by PBMR, Pty Limited. Another version of a pebble bed reactor is also being developed in China. The first PBMR is scheduled to be operated by 2012 by ESKOM, the South African government owned electrical util-ity. Westinghouse is currently working to provide design expertise for the ESKOM utility's Pebble-Bed Modular Reactor and prepare for future licensing in the United
States. The safety of High Temperature Gas-Cooled Reactors, is recognized as a sig-nificant; attribute of this type of reactor. Indeed, one of the most interesting features of these reactors lies in the fact that they do not need complex emergency cooling systems. In all accident situations, the heat can be removed by natural circulation without active core cooling systems. An other significant advantage is that this type of reactor is inherently safe, and as a result, it can not melt down.
An important accident scenario that some raise as a concern about graphite moder-ated reactors, is the issue of the potential for graphite corrosion and the possibility of a fire caused by air ingress events. In this type of accident, a break in the pri-mary circuit, for instance a coaxial pipe between the reactor vessel and the power conversion system, allows the ingress of surrounding air in the reactor core. The air reacts with the graphite of the reflector as well as the graphite of the fuel pebbles in a complex set of exothermic and endothermic reactions. The species produced during these reactions are mainly CO (carbon monoxide) and C02 (carbon diox-ide). Therefore, the key issue in this accident scenario is to be able to predict what damage will be done to the graphite, the overall reactor structure and the fuel. It is also essential to know temperatures reached and estimate the amount of CO pro-duced as well as the amount of oxygen available in the reactor to determine whether burning occurs. Once theses parameters are known and understood, an estimate can be made on the risk of graphite burning and damage to the core.
Various experimental and computational studies of the overall problem were
per-formed over many years. [11, [2], [31,
[4].
These studies attempted to take into
ac-count the key parameters of the accident and several complex effects: fluid dynamics, species diffusion, onset of natural circulation, temperature distribution, heteroge-neous and homogeheteroge-neous chemical reactions depending on temperature and species distributions, heat transfer and removal, chemical species and mass transport. The work presented in this thesis is part of the general effort to improve understanding and modeling of air ingress events. More particularly, the main goal of this thesis is to benchmark a computational fluid dynamics code, FLUENT, to air ingress exper-iments run at the NACOK facility located at the Jiilich Center in Germany. The benchmarking is blind, meaning that the physical FLUENT models were developed
without access to the experimental results data. This benchmarking of the code con-firms that the methods used in FLUENT can be used to understand and study the events of air ingress in the reactor. The secondary goal for this thesis is to develop a better understanding of the phenomena taking place during the air ingress accident
and the interactions between various parameters. It is hoped that this improved understanding will be used to identify key factors affecting the progression of the event and to take appropriate mitigating measures.
This introductory chapter presents the PBMR design, the air ingress accident and a summary of past analysis performed on the issue at MIT .
1.2
The Pebble Bed Modular Reactor (PBMR) [5]
Design Description
The PBMR reactor is designed to produce 165 MWe using 400 MWth, which makes it a small reactor, adaptable to many different types of markets due to its modularity and high temperature. The PBMR is a direct Brayton gas cycle plant schematically shown on Figure 1-1:
1. Helium gas is passed into the reactor and flow through the pebble bed where heat is produced. The gas is heated up to 900C at a pressure of 69 bar. 2. The gas flows through the turbine which drives a generator
3. Helium goes then through a recuperator where it is reheated.
4. The gas then goes through stages of recuperator, inter cooling, recooling and compression before re-entering the core at 540C.
PBMR HELIUM FLOW PATH S:;HEMATIC eBRAYTON C•4YCLE
HELIUM INVENTORY REACTOR UNIT POWER CONVERSION UNIT CONTROL SYSTEM
Figure 1-1: PBMR power conversion cycle
Table 1.1 summarizes the main design parameters and Figure 1-2 presents the overall layout of the key power conversion elements of the plant:
Table 1.1: PBMR design parameters
450 000 spheres
Pressure vessel: 6.2 m diameter and 27 m high
Outer reflector: 1 m thick graphite blocks
Inlet core coolant: 540C, Outlet core coolant: 900C
Inlet turbine coolant: 900C, Outlet turbine coolant: 500C
Core pressure: 9 Mpa
Turbine outlet pressure: 2.6Mpa
Thermal efficiency: 40
Ilr,'u(
REACTOR RECUPERATOR COPRESSOR TURBINE GENERATOR GEARBOX CC
S
a IVIIMI 4 I P4lI"•fl .r SHUT-OFF DISC INTER-COOLEROIL LUBE SYSTEM
Figure 1-2: PBMR plant diagram
Fuel
The PBMR does not have a pressure tight containment to prevent leakage of the radioactive materials from the primary pressure boundary. This function is provided by the silicon carbide coated fuel micro sphere contained in the pebbles, designed to contain fission products during accidents and transients. Approximately 11 000 coated fuel particles are contained in a single graphite pebble which also has an outer graphite shell as shown on Figure 1-3. The reactor is loaded with 440 000 spheres, a fourth of them being simple graphite unfueled moderator spheres. The PBMR operates with an online refueling system, pebbles being added to the core from the top and removed at the bottom. Depending on the amount of uranium left in the sphere, it is either sent to storage or reloaded in the core. The storage of the pebbles is easier than standard fuel, since the used pebbles can be stored in casks in air cooled rooms in the basement of the reactor building due to the overall lower decay heat produced by each pebble.
S- rnm Graphrte layer .Coatd pardtices mbedded
tin Grapmle fMarol Dia 6trvn
;Fuelt-phere
PYr le rDganSibun Carbfe Ban1r CWing
inner Py"Vc Cart Paosn Crb SujlAr DVQ 0 92mn•
Coated Particle
Cr1 5rn-m Uranwm DioxideFuel
Figure 1-3: Fuel pebbles
Safety Features
The micro sphere fuel particles can be degraded at temperatures higher than 1800C. The inherent safety design of the reactor keeps the temperature below 1600C under most severe conditions. The core is designed such that it has a high surface area to volume ratio. In addition, the core configuration relies on conduction to transfer heat out of the core to the vessel. The heat can be effectively removed through the reactor vessel surface by conduction and convection to the reactor cavity. As a result, meltdown can not occur in the event of a loss of coolant accident. [5]
The coolant, helium, is an inert gas, both chemically and radiologically if impurities are minimized. It does not react with oxides and will not cause corrosion of parts of the core. Moreover, this allows the use of a direct cycle, since even in the case of leakage of helium, little or no radioactivity will escape.
1.3
The air ingress accident
1.3.1
Description of the phenomena
Massive air ingress accidents have a very low occurrence probability but can have severe consequences. Therefore, it is an issue that will be carefully reviewed during the licensing process of the PBMR in the Republic of South Africa and in the USA.
An important aspect of the design bases of the plant is to establish credible ac-cident scenarios that must be addressed by the designer. The establishment of these design bases accidents will be based on regulatory decisions informed by probabilistic risk analysis on the likelihood of failures causing air ingress. For light water reactors, double ended guillotine breaks is a standard design bases accidents. For the pur-pose of describing a worst case (but not credible) loss of coolant accident (LOCA) scenario, a double ended guillotine break is analyzed for pebble bed reactors as well. In the event of a double end pipe break or other type of LOCA, the first stage of the accident is a loss of helium with depressurization. This occurs until atmospheric conditions are reached. In the mean time, there is a rise in the core temperature. This rise is slow due to the fact that graphite has a high heat capacity, that is, a high capability to store and transfer heat. There is no air ingress in the core as long as the helium pressure in the reactor vessel remains higher than the outside atmospheric pressure. Once the outside and inside pressures are at equilibrium, air being heavier than helium, it enters the core very slowly by molecular and thermal diffusion. actor vessel remains higher than the outside atmospheric pressure. Once the outside and inside pressures are at equilibrium, air being heavier than helium, it enters the core very slowly by molecular and thermal diffusion.
This process can take a long time, depending on the location of the break and overall reactor condition [8]. As air enters in contact with hot graphite, chemical exothermic and endothermic oxidation reactions occur. Multidimensional localized natural convection will enhance species transport. Due to the reactions, the
temper-ature of the incoming gas rises and its density therefore decreases. Buoyancy forces increase with the temperature gradient. This leads, at some point, to the onset of
natural circulation (Figure 1-4). In the case of a coaxial pipe break, this physical mechanism leads to air entering the reactor core, rising up to the top and going out through the breach of the outer tube of the coaxial pipe.
i
~1
~Mi.Ipe
Figure 1-4: Natural circulation process after a break in a coaxial pipe
The circulation of air also provides a cooling function for the core. (passive cool-ing system). However, it also brcool-ings a supply of fresh air with oxygen, allowcool-ing more oxidation of the graphite to occur, which raises the temperature due to the dominance of exothermic oxidation reactions. A major issue is then to determine the temperature increase of the core as a combination of the heat stored in graphite, the energy deposited or removed by the endothermic and exothermic chemical reactions and the heat removed by convection. Knowing the temperatures in the core will help determine air ingress velocities, the concentrations of CO and CO2 and ultimately whether the graphite might burn.
The other important feature is the corrosion of the structural graphite. It is vi-tally important to be able to predict the location and mass loss along with the total corrosion. The integrity of the structure as well as the evolution of its mechanical and thermal properties will strongly depend on how the structural graphite is chem-ically reacted and structurally affected.
The stages of an air ingress accident are shown on Figure 1-5. The first figure on the left shows the depressurization stage in which helium exits the core until atmospheric pressure is reached. The middle figure shows the slow diffusion stage, when air enter by diffusion the core. The third figure shows the natural convection stage, when air circulates through the core.
Depressurization stage
(Diffusion)
Diffusion stage Natural convection stage
Figure 1-5: Air ingress accident stages in a pebble bed reactor
To understand the air ingress phenomena, it is necessary to be able to predict the following parameters:
* The speed at which air diffuses in the helium cooled core. * The time of onset of natural convection.
* The oxidation rate of the graphite of the reflector and pebbles.
* The temperature distribution in the reactor core. The balance between the cooling due to air ingress and the temperature rise due to decay heat and graphite corrosion.
* The amount of graphite corroded and its location (preservation of the integrity of the reactor).
* The velocity of air in different locations of the core and the air mass flow rate. Several parameters and features interact with each other in a complex manner to determine air ingress accident progression. Figure 1-6 presents a diagram showing the interactions between several parameters. For instance, one can see that the tem-perature distribution will affect the corrosion reactions, the Boudouard endothermic reaction (reaction of C02 with graphite) and the mass flow rate. The temperature is going to be affected by the geometrical layout of the core and piping as well as the type of graphite. Figure 1-6 shows therefore the complexity of correlations between several structural and physical characteristics of the core during an air ingress event.
I
ltemperatureL-Distribution
LTime dependence
I
Figure 1-6: Interaction between air ingress event parameters
1.3.2
Past experiments and Benchmarks
The Japan Atomic Research Energy Institute has hosted a series of experiments designed to study the parameters and phenomena taking place during air ingress [4]. Three basic experiments were performed by JAERI, included separate study of diffusion, onset of natural convection and a complete multicomponent air ingress simulation with graphite and air. MIT has benchmarked FLUENT using these three
Graphite *Grain size *Type (Reactivity) *Thermal properties *Mechanical properties
.0-JAERI air ingress experiments [1], [6]. The experimental apparatus consisted of a reverse U-shaped tube and a gas tank as shown on Figure 1-7. A temperature gra-dient could be applied to the tube creating a hot and cold leg. A graphite tube could be inserted in the heated pipe section to simulate a reflector flow channel. The experiments simulated were each focused on a different phenomenon. The first experiment, called isothermal experiment, was designed to study the diffusion of nitrogen in helium in an isothermal environment.The second experiment studied the onset of natural circulation. The reverse U tube was heated on one side and a natural convection flow took place from the hot leg to the cold leg. Finally, a multi-component experiment with a graphite tube inserted simulating an air ingress event was studied. Molecular diffusion, natural convections and corrosion were studied in this experiment. The modeling approach presented in this thesis follows the same approach used by the scientists at JAERI namely different phenomena were studied separately (diffusion, flow, chemistry). Once well understood, they were combined. Indeed, a very good insight on the phenomena and their sensitivity to different
pa-rameters can be gained from this method.
A complete model was developed with FLUENT to model the JAERI experi-ments in 2003 [1]. Results and comparison with experimental data were very sat-isfying for diffusion, thermal and multi-component simulations. This work showed that the FLUENT model and methodology is able to predict each separate physical phenomena occurring during air ingress accidents in a simple geometry. Not only were the chemical reactions well modeled as a function of time but also the onset of natural circulation was well predicted. FLUENT ability to simulate air ingress acci-dents was also investigated by Lim and No [21, 131. They successfully benchmarked the CFD code on small scale experiments with simple geometries and protocols (two bulbs diffusion experiment, annular flow tube Takahashi experiment, Circular flow tube Ogawa experiment and the JAERI experiments). This proves the ability of FLUENT to model separate effects of air ingress events in small configurations.
2~fC S. 500 ---Grs •'nk Well Terrnperj,e Measutinn; P: n-r 2- Cooler
---·-
~---
1000
--Figure 1-7: The JAERI experimental configuration
The MIT benchmarking of the JAERI diffusion experiment [1]
The boundary condition in this experiment is that all the wall temperatures are equal to the environment temperature, 18 C. Before opening of the isolation valves, there is 100% He in the pipe region and 100% N2 in the gas tank region. No distur-bance is involved in this pure diffusion process. Figure 1-8 shows the geometry and mesh developed by Zhai. The properties of He and N2, such as the specific heat, conductance, density and viscosity, were all from the ideal gas database of FLUENT.
-i,
r
P
Figure 1-8: The JAERI mesh, 490 hexahedral cells and 1850 mixed cells
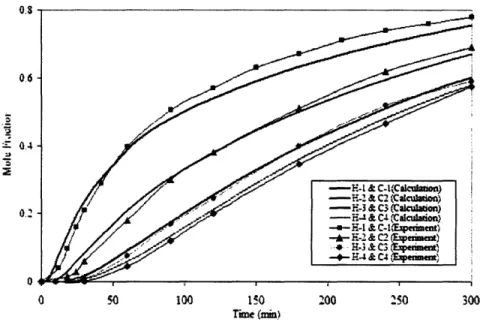
Figure 1-9 shows the experimental and calculated mole fraction changes of N2 at various gas sampling positions for the isothermal experiment. H1, H2, H3, H4 refer to 4 points monitored in the hot leg, and C1, C2, C3, C4 refer to 4 points monitored in the cold leg. The calculation is in good agreement with the experiment in which diffusion is the only phenomenon occurring. This benchmarking showed that the modeling procedure applied in FLUENT can be used to model the diffusion stage of air ingress.
06 0 4 0.2 0 0 50 100 150 200 250 300 rime (min)
Figure 1-9: Mole Fraction of N2 Benchmarking of the Isothermal JAERI
Experiment
The MIT benchmarking of the JAERI thermal experiment
[1]
The purpose of this experiment is to provide a temperature gradient between the hot and cold legs to assess the onset of natural circulation. Thus, in this experiment, diffusion of nitrogen in helium is enhanced by the temperature difference and the density difference in the hot and cold legs which ultimately produces natural circu-lation. For the thermal experiment, the same facility as in the diffusion experiment is used, but the hot leg is heated 256C and the cold leg is maintained at 20C.
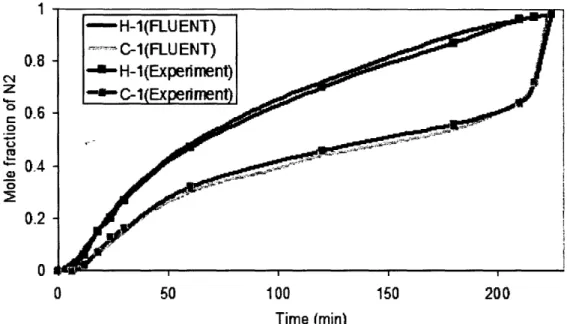
The mole fraction change of N2 and the initiation time of the natural circulation of pure nitrogen is shown on Figure 1-10. As can be seen, the agreement of the FLUENT calculation with the experiment is very good, demonstrating the ability to model the second phase of the air ingress phenomenon using the CFD tool.
0.8 4-o 0.6
0-0.2
0
0
50
100
150
200
Time (min)
Figure 1-10: Comparison of mole fraction change of nitrogen between the
gas sampling positions H-1 and C-1 in the thermal experimentThe MIT benchmarking of the JAERI multi component experiment [1]
The multi-component experiment was set up to investigate the integrated phenom-ena of molecular diffusion and natural convection with graphite oxidation in a multi-component gas system. The objectives of the multi-multi-component experiment is to in-vestigate the basic features of the flow behavior of the multi-component gas mixture,
consisting of He, N2, 02, CO, CO2, etc. This experiment tests all major
phenom-ena in an air ingress event for prismatic reactors. 100% Helium is injected into the tube and air is injected into the gas tank. The high-temperature side pipe and the connecting pipe are heated from about 400C to 800C. The initial conditions for the multi-component experiment are as follows: the total pressure in the system is set equal to the atmospheric pressure, no gas flow exists before the opening of both valves. A time equals zero, both valves are open simultaneously and air is allowed to diffuse into the test chamber. An integrated transient multi-component chemical model was used to simulate diffusion, natural circulation as well as chemical reac-tions.
The results show quite good agreement with experimental data at the measured points for 02, CO and C02 mole fractions as can be seen on Figure 1-11. Using the model developed for this experiment, the FLUENT code also shows excellent agreement on the onset of natural circulation. Natural circulation occurs in the multi-component experiment when the buoyancy produced by density difference be-tween the hot and cold leg is high enough to overcome the friction in the flow path. Almost all the oxygen was consumed during the diffusion stage, but in natural cir-culation stage, most of the oxygen escaped from the graphite section of the test assembly. Moreover, the dominant reaction production is C02, not CO due to the rapid CO oxidation rate and high oxygen concentration, while most of the immedi-ate product at the graphite surface is CO. This benchmarking performed by Zhai demonstrated that their modeling of air ingress process was valid.
0,20
-0.16 0 0M 0.08
- 0.04-0.00 4 -- 02(Experiment) - 02(Calculation) .- CO(Experiment) - CO(Ca Iculation) -- C 02(Expe riment - C02(Calculation A 0 50 100 150Time(min)
Figure 1-11: Example of good agreement between simulation and
experi-ment on JAERI multi-component experiexperi-ment at H3 measure point. At
time 100 min, one can observe the onset of natural convection
One should bear in mind that the JAERI experiments were done to investigate an air ingress accident in a prismatic reactor. Therefore, further work was needed on pebble bed reactor. To do so, the Jiilich Forschungzentrum in Jiilich, Germany, built the NACOK facility. NACOK stands, for Natural Convection and Corrosion
-·· · · · · ·- · · ·- ··-- -·- -·· - · ··- ·· ·· · · ; - · -·-·- - · · ·:
in the Core. These experiments feature a full scale complex investigation of an air ingress accident in a pebble bed reactor. They are presented in detail in the following chapter.
Chapter 2
The NACOK experiments (Naturzug
im Core mit Korrosion)
2.1
NACOK
The NACOK experimental facility was built more than 13 years ago at the Jiilich Research Center in Germany to study the effects of airflow driven by natural con-vection in the event of the complete rupture of the coaxial hot gas duct. The main goals of the facility are to determine:
* The natural convection air mass flow and its dependence on temperatures and geometrical parameters.
* The time of onset of natural convection, that is the time between the break of
the coaxial duct and the start of major air inflow. * The locally dependent corrosion of graphite. * The formation of gases and aerosols (dust).
* The temperature distribution and heat generated by exothermic reactions. The other goal of the experimental set up is also to collect sufficient data to allow the benchmarking of several codes, such as TINTE, THERMIX-DIREKT and in our case, FLUENT.
experimental channel
300mm x 300mmsphere packing
dsphere= 60mm----flow direction
heater
steel framework----.return
z retumtube
coaxial duct
I
..
. .
NACOK
Figure 2-1: Overall set up of the NACOK experimental facility
The main features are: * A chimney of 7.3 m high. * A return duct
* Different sections in the main channel : bottom reflector, sphere packing and top reflector.
* Measurement devices for temperature, pressure and species composition. * External variable heaters and temperature controls set up for different sections
of the experimental channel and return duct.
19 W mm6- 0 I i , ,, -;I !I
...
...
S.. ... ...-~";"'I}
rComputer and measurements station
Figure 2-2: Photo of the set up of the NACOK experimental facility[13]
Several series of experiments have been run at this facility in the past. The first tests to be thoroughly documented were performed in 1999 and reported by Kuhlmann [8]. The first series of tests were to study natural circulation in a hot and cold leg (return duct set-up). The second test was an open chimney corrosion test simulating the lower reflector and graphite pebbles. These early experiments were not designed to supply exact data relevant to multicomponent experiments. As a result of these tests, additional questions were raised: determination of reaction rates or species transfer mechanisms, temperature attained in the corrosion zone, location of the corrosion, variation of the mass flow depending on the gas atmosphere, influence of various parameters on corrosion and mass flow and in leakage to the experimental apparatus. For all these reasons, these early tests were not able to provide reliable quantitative data in order to assess the impact of chemical reactions
on graphite mass loss and temperature distribution. The qualitative results are however of high interest for a blind benchmarking analysis. They allow us to check whether the qualitative and quantitative computational results make sense.
Available public information on past experiments provide the following data: * The temperature can go up to 1500C in the HTR and up to 1200C in the
NACOK. [8]
* The mass flow rates in the NACOK are in the gram range (between lg.s- 1 and 15g.s- 1)
* The time of onset of natural convection is in the hour range. For a specific setup, it was of about 8 hours.
This information allows the reader to have a better feeling of the size and functioning of the NACOK experiment. Such informations were also valuable for a qualitative evaluation of the first blind computational results.
2.2
The new air ingress experiments
The most recent series of tests were performed in March 2004 and July 2004 for PBMR. After making modifications to the NACOK facility addressing the concern of earlier tests and to allow for the collection of reliable data upon which to benchmark codes for future analysis. The first test was the open chimney corrosion test and the second, a return duct corrosion test. These tests are not completely documented at
this time, and it is the purpose of this section, to give an outline of their experimental configuration and procedures.
2.2.1
Description of the Open Chimney Test (March 2004)
Configuration
The NACOK facility was configured to allow the hot leg to vent to the atmosphere as shown on Figure 2-3. The hot leg was heated to a uniform temperature of 650C. The test fluid is nitrogen. This temperature is maintained by wired heaters around
the chimney during the experiment. The heated internal walls are then maintained at this minimum temperature during the entire air ingress experiment. The interior of the lower part of the chimney consists almost entirely of graphite. The lowest part of the channel is the reflector. It is composed of two sets of ASR-1RS graphite blocks with vertical cylindrical holes of 40 mm and then 16 mm diameter. The properties of this graphite are very similar to the IG-110 used in Japan. Above the reflectors, there are two different beds of pebbles (60mm and 30 mm diameter) made of A3-3 matrix graphite of 350 mm and 600 mm heights respectively. The porosity of the pebble beds is 0.395. The porosity is the ratio of pores volumes over total volume:
VolumePores
Porosity = Voume = 0.395 (2.1)
TotalVolume
The lower bed is made of the bigger pebbles. Above the pebble beds lies a long empty zone until the top of the chimney, at a height of 8316mm. A flow measurement device at the entrance of the channel induces a pressure drop that would not exist in natural conditions. The experimental set up is shown on Figure 2-3, 2-4, 2-5 and 2-6.
Experimental procedure
Nitrogen at 650C is initially blown into the experimental apparatus for a sufficiently long time to ensure that all components are at thermal equilibrium equal to 650C. Once this equilibrium is established, the pressure is equalized with atmospheric pressure. At the time t = Os, the entrance duct is opened and air from the building
is allowed to enter. Outside temperature and humidity as well as the inlet flow are recorded. These parameters were stable over the duration of the experiment (Relative humidity of 29% and temperature of 22C). Temperature sensors and gas composition analysis devices are placed in the experimental channel at different radius values for data recording. Data also recorded at various heights temperature values and species fractions. This data was not made available to this study prior to the analysis.
F
Eli
Figure 2-3: Open chimney experiment drawing [13]
i____i·_)__l
Figure 2-4: Lower channel experimental setting for open chimney
Figure 2-5: Mesh of the lower channel, when reflectors are modeled in detail
000Q 00 i-- 0Q-· 000~· s-~-0-000o
~
-0 SO G5~%0o
0 01 G-fo 0 -"1a:~o oeg - 0 0 --0- --0-A 0 -0oo0 ' 0O0 0OO -o~ `0 0 0, -0 ' 0 0 -.-,: IF~I~Lt 2ZI lb -5 Y424
Figure 2-6: Plans and picture of arrangement for the 96 channels reflectors
and lower reflector. Top left: top view of the lower reflectors. Top right and bottom left: top view of the fine reflectors. Bottom right: picture of the fine reflectors.
2.2.2
Description of the Return-Duct Test (July 2004)
Configuration
The overall experimental setting is very similar to the previous one. However, in these experiments, the top of the chimney is closed and the return duct of 125 mm diameter is set up as shown on the Figure 2-7. The inlet and outlet ducts drawn are
not properly shown since in the NACOK facility they are in the same plane. The
height of the large pebbles bed is reduced to 280 mm from 350 mm which reduces the
pressure loss. The configuration of inlet and outlet ducts is of particular importance
since it, affects the diffusion and flow processes before the onset of natural convection.
Experimental procedureThe channel is heated using 850C nitrogen under light pressure to a temperature of 850C. It is then filled with helium and electrically heated to maintain an 850C initial condition. The pressure is equalized before the inlet duct and outlet duct are
-LW'~ -·-~·--·~~·-~·~~·~~·~·~~·-~ I t ','. ~li~ ~F~ I ..
r - 16
opened silmutaneously to start the experiment. The top of the cold leg is maintained at a temperature between 175C and 200C. We assume in our analysis 180C as in shown in Figure 2-8. The lower part of the return duct does not have any specific temperature externally maintained. Figure 2-8 shows the temperature distribution as modeled in FLUENT.
I
Figure 2-7: Global experimental setting for return duct experiments
~-L l,,'."t.z;r=;'~u~l*'l"l ~ri I--··~:~P·EI ·-
~i~·~·~~*~~·-·.;~--...
...
I...
- ..
--9 ý 7 ý
F--=]
Figure 2-8: Initial temperature distribution in the return duct experiment
2.3 Materials and graphite
No precise information was provided on the type of materials used in the 2004 experimental runs. It is therefore assumed that they were similar to those described
by Kuhlmann in the 2001 experiments report [8].
2.3.1
The reflector graphite: ASR-1RS
The reflector graphite is assumed to be ASR-1RS which was used in previous NA-COK experiments. The material properties are shown on Table 2-1. The graphite in
the reflector must be able to survive high mechanical stresses, display a good degree of purity and a low anisotropy. This graphite is produced by mixing and pressing together a filler (pitch coke, grainsize < 120plm) and a binder (hard coal). The final grains have a diameter of less than 1mm. Therefore, the graphite has a high density and little ash and volatile components. The graphite is heat treated at high temperatures, above 2800C.
Table 2.1: ASR-1RS properties [91
Density 1780kg.m- 3
Heat conductivity 125W.m-'.K- 1 at 40C Specific Heat Capacity 710J.Kg-'K- 1
Ash content 390 ppm
2.3.2
The matrix pebble graphite: A3-3
Graphite varieties that are used as matrix materials for the pebbles must meet the requirements for mechanical strength, temperature, stability and good heat con-ductivity. The maximum temperature for thermal treatment is restricted to about 1950C. This is due to possible microsphere fuel degradation at these temperatures. It is of less importance in the process of modeling the NACOK experiment to have
information on this graphite since only a small amount of oxygen is expected to reach the pebble zone. Knowledge of pebble graphite corrosion could be important however in actual air ingress events in reactors since it must be shown that fuel degra-dation would be limited. Therefore, no reaction would occur on graphite except for the Boudouard reaction that will be negligeable at the NACOK temperatures.
2.4
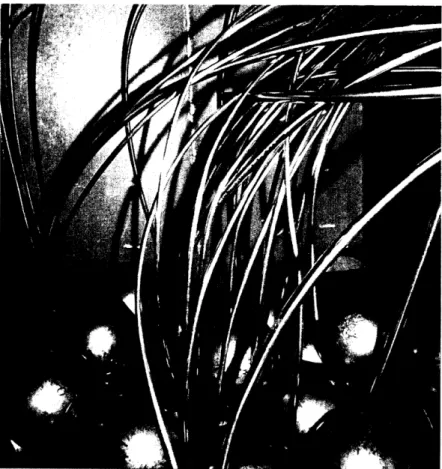
Visualisation of the NACOK experiment
In order to clarify the actual configuration of the experiment, pictures taken at the Jiilich research center by NACOK scientists are presented in Figure 2-9, 2-10 and 2-11 and 2-12.
Figure 2-10: Reflectors. On the left, before the experiment, on the right, after the experiment [13]
Figure 2-11: Entry chamber, with four graphite columns. On the left, before the experiment, on the right, after the experiment [13]
"
I
Figure 2-12: 60 mm diameter pebbles. The cables are linked to tempera-ture and species measurement devices located in the lower chimney and pebble bed
Chapter 3
Modeling NACOK with FLUENT
3.1
Validation of a Computational Fluid Dynamics
Code [10], [111
In order to understand some of the procedures in this thesis, the processes, requisites and methods used in CFD modeling, this section presents a tutorial on Computa-tional Fluid Dynamics modeling. ComputaComputa-tional Fluid Dynamics (CFD) is a very powerful tool used for the analysis of fluid flows with varying complexity. The reli-ability on the CFD results tool depends on the number of phenomena modeled, the complexity of the physical processes modeled, the numerical sub-models used, the user expertise. CFD softwares provide approximate solutions of the equations that govern fluid flow, which are, in the NACOK experiment case:
* The mass conservation equation * The momentum conservation equation
* The energy conservation equation * The species conservation equations
In addition to these equations, the user needs to provide boundary conditions for a specific application. The solver is then launched with a numerical method whose accuracy will depend on the grid precision, the discretization method, the algorithm used to solve equations. Some of these inputs are provided by the user, in which
case results depend on the user's judgment. Other inputs, such as the discretization method, are part of the characteristics of the method used.
The blind benchmarking of the NACOK experiments is being done in this spirit. Benchmarking is one way of validating a code by comparing the CFD computed results to reliable experimental data that usually consists of simplified test cases. Typically, a few simple experiments are run in order to prove that the physical phe-nomena (flow, buoyancy, chemical reaction, etc.) can be represented by the code. Then, sensitivity studies can be done numerically to study the impact of several pa-rameters in simple cases. This step is important to provide insights on the range of uncertainty of inputs and their impact on the output. Once the physical phenomena are well understood, the model needs to be benchmarked on more complex geometry and cases. Due to the difficulties of performing experiments on large scale that as-sess such complex phenomena such as those that occur in an air ingress event, only a few experimental tests were run. Therefore, it was decided to proceed to a blind
benchmarking approach to test the modeling method for general application. This
means that no experimental data was received before the creation and execution of the FLUENT NACOK model.
A short overview of the issues that need to be tackled with during code valida-tion is presented. [11]
The problem definition
Some parameters must be defined in order to set up the problem. The user must choose, among others, a compressible vs incompressible flow, steady vs transient flow, laminar vs turbulent flow, isothermal vs isothermal, buoyant vs non-buoyant, reacting vs non reacting, two dimensional vs three dimensional flow and the extent of the computational model. Boundary conditions and initial conditions must be given and their choice explained in order to justify the simulation of a well-posed realistic model.
The numerical methods
Different methods that can be found in commercial softwares are the finite volume method or the finite element method. Numerical discretization, used to translate the mathematical equations into a computer code, induces approximations and thus, errors. A very frequent error which occurs is numerical diffusion, leading to an over prediction of mixing. In order to avoid this, high order schemes must be selected. Unfortunately, these usually lead to divergence.
Solution control and convergence are a major part of the convergence procedure of a model. Once algebraic equations have been defined based on the grid and nu-merical scheme, they must be solved with iterative algorithms. Therefore, the user has to provide the code/software with convergence criteria or decide when to stop the iterative process. In conclusion to this short overview of CFD modeling, one
ought to remember, as it was said by Versteeg and Malalesekera in 1995
111]:
"In solving fluid flow problems, we need to be aware that the under-lying physics is complex and the results generated by a CFD code are atbest as good as the physics embedded in it and at worst as good as its operator"
3.2
Procedure followed for the blind benchmarking
of the NACOK experiments
The blind benchmarking of the NACOK experiments followed the outlines presented above, with adjustments to the specifics of this case. The open chimney case was developed first and next modified for the return chimney experiment. The steps in
the blind benchmarking of the NACOK experiments are as follows:
1. Identifying the physical and chemical phenomena taking place in an air ingress event. This includes among other things, the natural circulation, the chemical reactions, species transport, heat exchanges.
plans, procedures and facility descriptions were received. Details were then investigated further by ways of communication with the Jiilich center in Ger-many. A good understanding and knowledge of the experimental configuration and test procedures was eventually reached.
3. Verification of FLUENT capabilities to model the physical phenomena oc-curring in an air ingress event. This was done with the help of FLUENT's documentation and service center, as well as small computations modeling various processes in simple geometries.
4. Development of a geometry and grid corresponding to the actual experimental setting. Simplification of this geometry and mesh in order to diminish the computational time. Rough sensitivity study was conducted to assess the impact of the grid precision.
5. Development of several FLUENT models for complete and simplified geome-tries, focusing on separate effects. Benchmarking of these models was achieved based on previous experiments when possible (natural circulation and pressure loss in pebble beds).
6. Adaptations of these models to shorten computational time (simpler geome-tries and pressure loss adapted to the FLUENT model, etc...).
7. Creation of a complete model, executed steady state and transient analysis for the open chimney. Comparison of the results with data provided by the JULICH center and PBMR Inc.
8. Sensitivity studies runs on simple geometries to modify the complete model based on comparisons made with the experimental data.
9. Creation of a better FLUENT model benchmarking the NACOK experiments, a detailed explanation of these models and suggestions to modify the method-ology to PBMR modeling.
3.3
Detailed description of the general FLUENT
model used in NACOK computations, [121, [26]
In the development of the model, geometry and mesh choices were made to limit the computational time. The detailed model files are presented in Appendices. However, it is believed that the explanation of certain parameter choices deserves explanation.Preprocessing
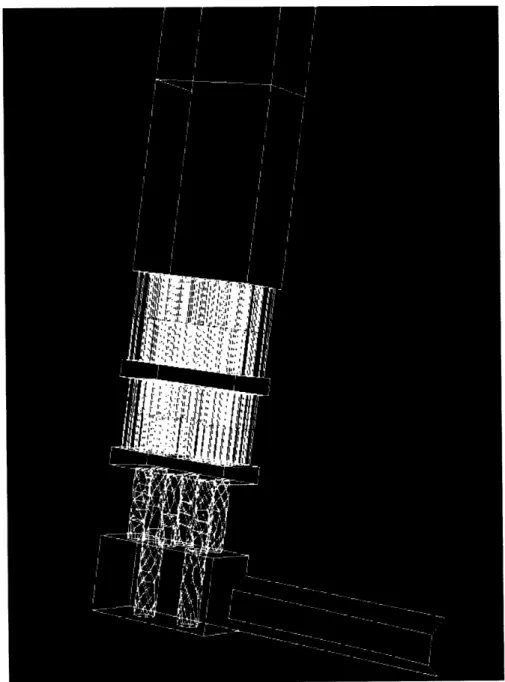
The preprocessing, that is, creation of the geometry and grid that need to be input in FLUENT, was conducted with GAMBIT 2.2.30. The geometry was created based on information received by the Jiilich center. The xOz symmetry plane was chosen as to divide by two the size of the model. There are a total of 10 fluid zones and 1 solid zone: inlet, low entry (columns area), lowref (first reflector), interef (space between reflector 1 and 2), ref2 (second reflector), interef2, ref3, pebl (60 mm diameter pebble bed), intpeb (space between the pebble beds), peb2, chimney, return and solid. The zones location are shown on Figure 3-1.
Inlet tube: length, bending and area variations are not well known. For the
open chimney experiment, the full length of the inlet tube(>3m) was not modeled due to lack of adequate knowledge of the real configuration. The model would gain in precision if this was modeled. The inlet is therefore modeled as a tube of 125 mm diameter and of 500 mm length. This length is adequate to model the flow path in the inlet tube and the diffusion phenomenon. The inlet boundary condition is a pressure inlet condition. A porous-jump zone is modeled after the inlet to account for the flow meter device as well as the pressure loss induced by the tubing. The inlet was meshed with Hex/Wedge elements, Cooper type with a spacing of 20mm between each element with a total of 600 elements in the volume.
For the return duct experiment however, the diffusion and therefore the length of tubing determines the onset of natural convection. The inlet channel was modeled as a rectangular inlet of side 110 mm, which conserves the flow area. Then, the tube length was fully modeled based on best interpretation of different plans provided for the configuration.
Entry zone: The entry zone contains 2 (taking in account the symmetry, 4
otherwise) graphite columns. Both the entry space where air is flowing and the columns (solid) are meshed with Tet/Hybrid elements Tgrid type. A size function was used in order to provide a coarser mesh in the bottom entry section and a finer mesh close to the top reflector flow zone.
Top chimney region Empty zone 2nd and 3rd reflector/ 96 channels First reflector
I
Entry
zone
Higher pebble bed
Lower pebble bed
4F l w m eter I Flow meter Pressure inlet
Inlet tube
Figure 3-1: Zones name in the FLUENT model
First reflector: Modeled as channels with graphite walls. For meshing, the channel zone was unified with the empty flow space above. This zone was meshed in a similar way as the entry.
Second and Third Reflectors: Several models were created, with detailed geometry and with the reflector of 96 channels modeled as a porous media. In this latter case, the porous media is a rectangular, meshed with Hex/Wedge elements

![Figure 1-7: The JAERI experimental configuration The MIT benchmarking of the JAERI diffusion experiment [1]](https://thumb-eu.123doks.com/thumbv2/123doknet/14169488.474381/25.918.201.759.170.753/figure-jaeri-experimental-configuration-benchmarking-jaeri-diffusion-experiment.webp)
![Figure 2-2: Photo of the set up of the NACOK experimental facility[13]](https://thumb-eu.123doks.com/thumbv2/123doknet/14169488.474381/33.918.273.695.147.653/figure-photo-set-nacok-experimental-facility.webp)
![Figure 2-4: Lower channel experimental setting for open chimney experi- experi-mentsl13]](https://thumb-eu.123doks.com/thumbv2/123doknet/14169488.474381/37.918.189.763.154.872/figure-lower-channel-experimental-setting-chimney-experi-experi.webp)

![Figure 2-11: Entry chamber, with four graphite columns. On the left, before the experiment, on the right, after the experiment [13]](https://thumb-eu.123doks.com/thumbv2/123doknet/14169488.474381/44.918.187.780.650.1017/figure-entry-chamber-graphite-columns-experiment-right-experiment.webp)