Publisher’s version / Version de l'éditeur:
Vous avez des questions? Nous pouvons vous aider. Pour communiquer directement avec un auteur, consultez la première page de la revue dans laquelle son article a été publié afin de trouver ses coordonnées. Si vous n’arrivez pas à les repérer, communiquez avec nous à [email protected].
Questions? Contact the NRC Publications Archive team at
[email protected]. If you wish to email the authors directly, please see the first page of the publication for their contact information.
https://publications-cnrc.canada.ca/fra/droits
L’accès à ce site Web et l’utilisation de son contenu sont assujettis aux conditions présentées dans le site LISEZ CES CONDITIONS ATTENTIVEMENT AVANT D’UTILISER CE SITE WEB.
Technical Report (National Research Council of Canada. Canadian Hydraulics
Centre); no. CHC-TR-078, 2011-03-01
READ THESE TERMS AND CONDITIONS CAREFULLY BEFORE USING THIS WEBSITE. https://nrc-publications.canada.ca/eng/copyright
NRC Publications Archive Record / Notice des Archives des publications du CNRC :
https://nrc-publications.canada.ca/eng/view/object/?id=5eb5e7c7-e008-4713-8818-007f433ec5e5 https://publications-cnrc.canada.ca/fra/voir/objet/?id=5eb5e7c7-e008-4713-8818-007f433ec5e5 For the publisher’s version, please access the DOI link below./ Pour consulter la version de l’éditeur, utilisez le lien DOI ci-dessous.
https://doi.org/10.4224/17712914
Access and use of this website and the material on it are subject to the Terms and Conditions set forth at
Rate effect on ice impact forces
RATE EFFECT ON ICE IMPACT FORCES
R. Frederking
TECHNICAL REPORT
CHC-TR-078
RATE EFFECT ON ICE IMPACT FORCES
Robert Frederking
Canadian Hydraulics Centre
National Research Council of Canada
Ottawa, ON K1A 0R6
Canada
Report prepared for
Marine Transportation and Safety Program
of the
Program of Energy Research and Development
Technical Report
CHC-TR-078
ABSTRACT
The CCGS Terry Fox field trials produced impacts with growlers, bergy bits and a small iceberg over a range of velocities. Ice mass ranged from 30 t to 22,000 t and velocity from 0.1 m/s to 6.6 m/s. Results have been analysed looking at the effect of speed and ice mass on the measured impact force. There was considerable scatter in the results until the rate of the rise time of the measured impact force was taken into consideration. A trend of increasing impact force with loading rate was observed. To further examine this aspect of rate effect on impact forces, medium scale field indentation tests were also studied, since they were done to simulate full scale impact loading. The tests were done at a number of locations in the Arctic on iceberg ice and multi-year ice, and also showed a rate effect. For the CCGS Terry Fox the maximum force related to the loading rate with the following expression
where F is force in MN and is loading rate in MN/s. The expression is supported by data up to a maximum force of 6 MN. Higher forces at comparable loading rates were achieved in the field indentation tests due to higher loading system capacity and better ice-indentor contact.
TABLE OF CONTENTS
Abstract ... i
1. INTRODUCTION ... 1
2. IMPACT DATA SOURCES ... 1
2.1 CCGS Terry Fox field trials ... 1
2.2 Medium scale ice indentation tests ... 4
3. RESULTS OF IMPACTS ... 8 3.1 CCGS Terry Fox ... 8 3.2 Pond Inlet ... 13 3.3 Byam Martin ... 15 3.4 1989 Ice Island ... 18 3.5 1990 Ice Island ... 20 4. SUMMARY ... 23 5. ACKNOWLEDGEMENTS ... 25 6. REFERENCES ... 25
LIST OF FIGURES
Figure 1 Instrument locations on the CCGS Terry Fox ... 2Figure 2 Strain gauged sub-panel arrays for measurements ... 2
Figure 3 Image of Berg B14 just after impact ... 4
Figure 4 Four actuators with spherical indentor ... 5
Figure 5 Ice Island 1989, spherical indentor and one actuator set-up ... 6
Figure 6 Section of ice face for test 6 ... 6
Figure 7 Ice Island 1989, flat rigid indentor ... 7
Figure 8 Ice island 1990, 1.5 m by 1.22 m flat flexible indentor with three actuators ... 7
Figure 9 Ice island 1990, 1 m by 0.7 m flat flexible indentor with one actuator, 400 mm/s ... 8
Figure 10 Impact force measured on the CCGS Terry Fox as a function of speed and ice mass ... 9
Figure 11 Probability of maximum force strain from the gauged panel (from Ritch et al, 2008) ... 9
Figure 12 Average Pressure at time of maximum force as a function of area ...10
Figure 13 Six largest impacts on B14 (2,200 t) ...11
Figure 14 Six largest impacts on B17 (8,500 t) ...11
Figure 15 Relation between maximum impact force and loading rate, CCGS Terry Fox ...12
Figure 16 Relation between maximum impact force and impact duration, CCGS Terry Fox ...13
Figure 17 Pond Inlet test results for 3 m2 indentor, total force and penetration ...14
Figure 18 Pond Inlet test results for 1 m2 indentor ...14
Figure 19 Maximum force as a function of loading rate, Pond Inlet Tests ...15
Figure 20 Maximum force as a function of time to maximum force, Pond Inlet Tests ...15
Figure 21 Force time curve for 10 mm/s constant velocity at the Byam Martin site ...16
Figure 22 Force time curve for 100 mm/s constant velocity and 100 mm/s cosine speed varying tests at the Byam Martin site ...16
Figure 23 Maximum force as a function of loading rate, Byam Martin ...17
Figure 24 Maximum force as a function of time to maximum force, Byam Martin ...17
Figure 25 1989 Ice Island test 5 at a rate of ~100 mm/s with a apherical indentor ...18
Figure 26 1989 Ice Island test 6 at a rate of ~19 mm/s with a flat indentor ...18
Figure 27 Maximum force as a function of loading rate, Ice Island 1989 tests...19
Figure 28 Maximum force as a function of time to Maximum force, Ice Island 1989 tests ...19
Figure 29 1990 Ice Island tests with large rigid indentor at 100 mm/s ...20
Figure 31 1990 Ice Island test SFF3 at 100 mm/s ...21
Figure 32 Maximum force as a function of loading rate, Ice Island 1990 tests...22
Figure 33 Maximum force as a function of time to maximum force, Ice Island 1990 tests ...23
Figure 34 Maximum force as a function of the loading rate for CCGS Terry Fox impacts and medium-scale field indentation tests ...24
Figure 35 Maximum force as a function of the loading rate for CCGS Terry Fox Impacts ...24
LIST OF TABLES
Table 1 Mass of impacted bergy bits ... 3Table 2 Summary table of 12 largest impact events ...12
Table 3 Maximum force and time to maximum force to for Pond Inlet tests ...13
Table 4 Force and time to maximum force for Byam Martin tests ...17
Table 5 Summary of maximum force, time and rate results of 1989 Ice Island tests...19
RATE EFFECT ON ICE IMPACT FORCES
1. INTRODUCTION
Previous work on analysis of the CCGS Terry Fox data has focused on the local pressure-area relation and the process average pressure area relation for impacts. In this report, maximum impact forces are investigated to determine the effects of ice feature mass, ship speed and the time interval to reach the maximum force. In addition to the 2001 CCGS Terry Fox field trials data, results of various field programs to measure ice forces under relatively controlled conditions in the field have been studied recently (Frederking 2010, 2011).
Indentation tests have been performed in the field and are another means for examining rate effects. They have been carried out with the purpose of simulating ship impacts on ice features or ice impacts on fixed structures. Medium scale field indentation tests are an intermediate step to an improved understanding of ice-structure interactions. Four sets of medium scale ice indentation tests will be examined. This report will compare rate effects on ice impact forces in the CCGS
Terry Fox field trials and medium-scale field indentation tests.
2. IMPACT DATA SOURCES
Data from two main sources will be studied, the 2001 CCGS Terry Fox field trials and medium scale ice indentation tests in the Arctic.
2.1
CCGS Terry Fox field trials
A field test program was carried out with the CCGS Terry Fox off the north east coast of Newfoundland in the latter part of June 2001. The aim of the tests was to impact bergy bits of various sizes at a range of ship speeds, and measure the ice impact forces on the bow (Gagnon et al, 2008). The port side of the bow area was instrumented in two areas to measure local ice pressures. The bergy bits ranged in mass from 30 t to 22,000 t, and ship speed range was from 0.2 m/s to 6.5 m/s. The length of the CCGS Terry Fox is 82 m and the vessel displaces 6700 t. The location of the instrumented areas is shown schematically in Figure 1. One of the areas is a specially designed panel developed by NRC-IOT, and the other strain gauged to measure loads on the hull. This report focuses on the results from the strain gauged area. A GPS provided data on the ship speed.
Figure 1 Instrument locations on the CCGS Terry Fox
Strain gauges were installed on frames to measure the load on each of the 34 sub-panels shown in Figure 2. By summing and proportioning the loads on the sub-panels, total load on six frames could be determined. Frame loads could also be summed to get the total load on the instrumented area. The instrumented area was about 3 m high and 3 m across, with a total measurement area of 6 m2.
AFT FORWARD
Figure 2 Strain gauged sub-panel arrays for measurements
S train G a u g e P a ne l IM D P a ne l F o w a rd O v er the S ide V ide o C a m e ra A ft O v er the S ide V ide o C a m e ra 132 135 138 FRM FRM FRM 2 34 33 32 31 30 29 28 27 26 25 24 23 22 21 20 19 18 17 16 15 14 13 12 11 10 9 8 7 6 5 4 3 1 STR 6.5 STR 7.0 STR 8.5 STR 8.0 STR 7.5
A total of 18 bergy bits were impacted during the test program. The sizes are given in Table 1. Note that there are two estimates of bergy bit mass, in one case from above water visual observations and measurements and below water sonar and measurements by C-CORE (Ralph et al, 2008). If such data were not available, the mass was estimated from visual observations. The tests were conducted at the end of June, when the ice surface temperatures were about 0oC. By a depth of 40 cm into the bergy bits, the temperature was about –15oC, which appeared to be constant through to the core of the bergy bit (Ralph et al, 2008).
Table 1 Mass of impacted bergy bits
Berg Number Mass from C-CORE measurements (t) Estimated mass (t) B01 600 B02 50 B03 40 B04 110 B05 22,000 B06 170 B07 20 B08 70 B09 240 B10 1300 B11 900 B12 650 B13 1200 B14 1900 2200 B15 30 B16 2800 B17 8500 B18 600
Bergy bit B14 is shown in Figure 3. It is clear that the shape of the berg is very irregular and that the force, and the rate at which the force increased would depend very much upon the local shape in the region of contact. No information is available on the local shape of any of the bergs for any of the impacts, so it is reasonable to expect the shape and the impact force will be random to some extent.
Figure 3 Image of Berg B14 just after impact
2.2 Medium scale ice indentation tests
Indentation tests have been performed in the field on iceberg ice and multi-year ice. They are a good basis for examining rate effects and simulate impact of ships with ice. The geometry of the ice and the indentor are known, as well as test conditions such as indentation speed and ice temperature. Four sets of medium scale ice indentation tests will be examined; Pond Inlet 1984, Byam Martin Channel 1985, Ice Island 1989 and Ice Island 1990.
Pond Inlet: In May, 1984 a series of 20 field tests were carried out in tunnels excavated in an iceberg in Pond Inlet (Masterson et al, 1992). Spherically shaped indentors with areas up to 3 m2 acted on a flat ice face (see Figure 4). The four hydraulic actuators had a total capacity of 19 MN. As the indentor penetrated into a flat ice face, the area of contact between the indentor and the ice face progressively increased. Indentor movement was measured with respect to the tunnel floor. Indentor movement, and thus penetration was servo-controlled so that the indentor speed followed a cosine function, starting at a speed of 100 mm/s and coming to a stop after about 3.5 s. In addition to tests with the 3 m2 indentor, tests were also done with a 1 m2 indentor, and smaller indentors. The 3 m2 spherical indentor had a radius of 2300 mm and the 1 m2 spherical indentor a radius of curvature of 1280 mm. These radii gave the target contact areas at an indentation 10% of the radius of curvature. This amount of indentation was achieved in about 3 s for the 3 m2 indentor and 2 s for the 1 m2 indentor.
Figure 4 Four actuators with spherical indentor
Byam Martin Channel: In early May, 1985 the same apparatus used at Pond Inlet was used for tests in multi-year ice in Byam Martin Channel (Masterson et al, 1999). In this case tests were done in 3-m-deep by 3-m-wide trenches cut into a thick multi-year floe. The multi-year ice was between 6 and 7 m thick. Three actuators with a capacity of 13.5 MN were used. As at Pond Inlet, a spherical indentor was used, resulting in a progressive increase in area with increasing penetration of the indentor into a flat ice face. Indentor movement and thus penetration into the ice face was servo-controlled. The focus of this test program was investigating the influence of indentation rate, which ranged from 100 mm/s to as low as 0.1 mm/s.
Ice Island 1989: In April, 1989 the same test apparatus used at Pond Inlet and Byam Martin, but with just one 4.5 MN capacity actuator, was used for tests in 10-m thick multi-year ice attached to Hobson’s Choice Ice Island (Frederking et al, 1990a, 1990b). A 3 m deep by 3 m wide trench was excavated in the floe. Five tests were conducted with the 1280 mm radius spherical indentor over a range of rates. The set-up of one actuator and a 1 m2 spherical indentor is shown in Figure 5.
Figure 5 Ice Island 1989, spherical indentor and one actuator set-up
As a variation to the tests with spherical indentors, five more tests were conducted with flat indentors acting on a shaped ice face on the vertical wall of the trench. An example of the shape for test 6 is shown in section in Figure 6. The ice face can be described as a shallow truncated wedge. The side slopes are 1 on 3 and a flat surface 120 mm wide was initially contacted by the indentor. Contact area increased linearly with indentor movement into the ice. The truncated wedges were about 1.5 m high.
Figure 6 Section of ice face for test 6
Two of the tests on the truncated wedges of ice were with a 1-m diameter flat flexible indentor with a plate and frame structure similar to that of a ship. Three of the tests were with the flat rigid indentor shown in Figure 7.
Figure 7 Ice Island 1989, flat rigid indentor
Ice Island 1990: In may, 1990 there was another test program at the Ice Island (Masterson et al, 1993) in the same multi-year ice, but in a new 3 m deep by 3 m wide trench. A range of tests with a number of different indentors and prepared ice faces were run. Most of the tests were carried out with the triple actuator set-up shown in Figure 8 at the rate of 100 mm/s.
Three tests were done with a single actuator but at rates up to 400 mm/s. A flat indentor 700 mm wide by 1000 mm high was used with the single actuator, see Figure 9.
Figure 9 Ice island 1990, 1 m by 0.7 m flat flexible indentor with one actuator, 400 mm/s
3. RESULTS OF IMPACTS
Results from the CCGS Terry Fox trial and the field indentation tests will be reviewed and compared.
3.1
CCGS Terry Fox
The CCGS Terry Fox carried out 178 impact runs over the period June 18 - 23 in 2001, 101 of which resulted in measurable impact forces on the strain gauged area. A plot of the maximum impact force as a function of ship velocity, categorized by ice mass is presented in Figure 10. Ship speed in this plot is determined from a GPS on the ship. It is difficult to detect any clear velocity dependence of the impact forces. If the results for the 2200 t bergy bit identified as B14 are looked at separately, a weak trend of increasing impact force with velocity might be construed. There is one outlier of B14, which is the highest measured impact force of 5.1 MN. The impacts on B17 (red triangles) do not show any discernable velocity dependence, although the velocity range in this case is smaller. As a whole, impacts on the larger 8500 t B17 berg resulted in significantly higher forces. Most of the sizable impact forces were from hits on B14 and B17.
Figure 10 Impact force measured on the CCGS Terry Fox as a function of speed and ice mass
A probability exceedance plot from Ritch et al (2008) (see Figure 11) demonstrates more clearly that larger impact forces result from impacts on the larger berg (B17). There were about 80 impacts on B14, 44 of which resulted in a measureable force on the strain-gauged area. It is also likely that, given the large number of impacts, the mass of B14 likely was reduced over the two days on which it was impacted, perhaps by as much as 10%.
Figure 11 Probability of maximum force strain from the gauged panel (from Ritch et al, 2008)
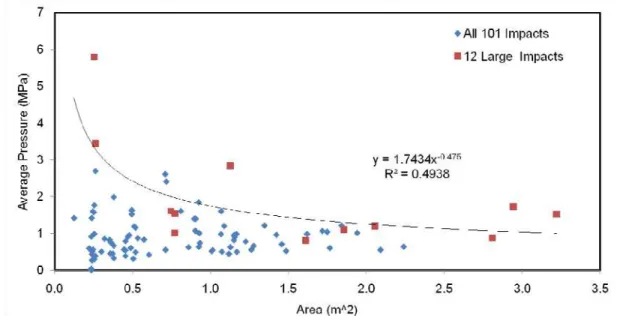
Information is available on the maximum force and the nominal contact area. Nominal contact area was determined from the contiguous sub-panels (Figure 2) which responded to the maximum force. From force and area, the average ice pressure on the contact area at the time of maximum force has been obtained and plotted against area in Figure 12. The results from the 12 largest impact forces have been separated in this plot (red squares). These 12 largest impacts follow a general global pressure area relation of decreasing average pressure with increasing area, as seen in other instances. Note that the pressure area relation in Figure 12 differs from local pressure-area distributions and process pressure-pressure-area relations (Frederking and Johnston, 2005).
Figure 12 Average Pressure at time of maximum force as a function of area
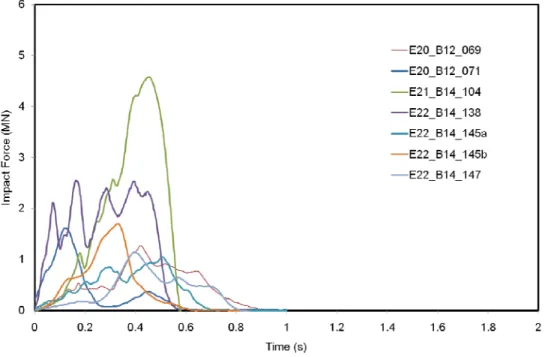
As discussed earlier, the rate at which the impact force increases will be examined. Figure 13 presents force time series plots of the six largest impacts on B12 and B14, which were at the smaller end of the bergy bit mass range. In all cases the recorded impact lasted less than 1 s, and usually it was about 0.5 s. In the case of impact E_22_B14_145 there were two impacts about a second apart, which is why they are labelled 145a and 145b.
Figure 13 Six largest impacts on B14 (2,200 t)
The impacts on B17, which had a mass of 8,500 t, were generally larger, as would be expected. Their duration was about 0.6 s, with the exception of two impacts which were almost 2 s long.
Figure 14 Six largest impacts on B17 (8,500 t)
The time series records of Figure 13 and Figure 14 were examined to determine the time when impact loading started, maximum force and time when it was reached, and time impact load ended. From these times and the maximum force, loading rate, unloading rate and duration of
impact were determined. The results are summarized in Table 2 and plotted in Figure 15. It can be seen that there is a trend of increasing maximum force with increasing loading rate. As observed in Figure 10, speed is not a good indicator of maximum force. The results in Figure 15 are for basically the same ice, but the edge shape of the ice pieces controls the rate, and thus the maximum force. Similar trends have been noted for uniaxial compressive strength of ice (Sinha, 1981).
Table 2 Summary table of 12 largest impact events
Impact Force Load rate Unload rate duration Velocity
Event (MN) (MN/s) (MN/s) (s) (m/s) E20_B12_069 1.27 3.2 3.3 0.78 5.8 E20_B12_071a 0.82 11.1 7.3 0.19 5 E20_B12_071b 1.61 12.0 12.0 0.27 5 E21_B14_104 4.64 12.6 36.8 0.49 3.2 E22_B14_138 2.33 8.2 8.5 0.56 6.2 E22_B14_145a 0.94 1.9 5.5 0.67 6 E22_B14_145b 1.70 5.5 14.0 0.43 6 E22_B14_147 1.12 5.8 2.8 0.59 6 E23_B17_154 0.80 3.7 2.7 0.51 2.7 E23_B17_156 1.03 1.1 1.5 1.63 3.5 E23_B17_158a 2.59 11.9 16.4 0.38 3.2 E23_B17_158b 0.54 0.6 1.5 1.26 3.2 E23_B17_162 5.01 13.4 24.3 0.58 4.1 E23_B17_164a 3.05 11.3 14.4 0.48 3.1 E23_B17_164b 1.76 7.2 10.7 0.41 3.1 E23_B17_166 1.80 3.7 3.8 0.96 3.2
The total load duration, from application of load on the measurement area to end of unloading, is plotted versus maximum force in Figure 16. The upper envelope of maximum force versus load duration shows a trend of increasing maximum force with decreasing loading time, generally similar to that observed by Sinha (1981).
Figure 16 Relation between maximum impact force and impact duration, CCGS Terry Fox
3.2
Pond Inlet
For the 1984 field tests at Pond Inlet, results from the 4 tests with a 3 m2 spherical indentor and a 1 m2 spherical indentor have been analysed for rate effects. Force-time records for the 3 m2 indentors are plotted in Figure 17. Four separate tests are represented in this figure, and while there are differences in detail, they are quite similar. The approximate speed during various times during the test is shown on the plot. This speed time profile was selected to represent impact of an iceberg on a structure, or ship with a bergy bit. It is interesting to note that the maximum forces are substantially greater than those determined on the CCGS Terry Fox. The maximum force measured in the 2.5 to 3 s time interval, and the time to reach that force, are compiled in Table 3. Figure 18 presents the results with the 1 m2 spherical indentor. A similar cosine velocity profile is followed, starting at 100 mm/s and coming to a stop in about 2 s. There is greater variability in the 1 m2 indentor results. In this case the maximum forces are more in the range of those measured on the CCGS Terry Fox. The maximum force and time to maximum force for the 1 m2 indentor tests are also compiled in Table 3.
Table 3 Maximum force and time to maximum force to for Pond Inlet tests
3 m2 tests Force (MN) Time (s) 1 m2 tests Force (MN) Time (s)
Test 1-5 10.4 2.97 tu1tw4 4.8 0.70
Test 3-2 9.5 2.75 tu2tw5 5.6 1.73
Test 4-2 8.6 2.40 tu2tw6 5.4 1.28
Figure 17 Pond Inlet test results for 3 m2 indentor, total force and penetration
Figure 18 Pond Inlet test results for 1 m2 indentor
The compiled results in Table 3 have been plotted in Figure 19. It is apparent that the nature of the Pond Inlet test results is quite different from the CCGS Terry Fox results. In the case of the Pond Inlet tests it appears that the results of the two different sized indentors all fall along a common force time curve, and the maximum force is a function of where the test ended along this curve. This behaviour is similar to what Sinha (1981) termed premature failure. For the Pond Inlet
tests the ice surface was always the same, flat, and two different radius indentors were used, so the indentor shape had an influence on the results.
Figure 19 Maximum force as a function of loading rate, Pond Inlet Tests
Figure 20 Maximum force as a function of time to maximum force, Pond Inlet Tests
3.3
Byam Martin
Over 20 tests in Byam Martin Channel were done with the 1 m2 spherical indentor, and at rates which resulted in either ductile or brittle failure of the ice. Indentation rates varied from 0.1 mm/s up to 100 mm/s. The focus here is on tests with brittle failure. There were 6 tests at rates of
constant 10 mm/s, constant 100 mm/s and initially 100 mm/s decreasing to 0 in 2 s and following a cosine function. The results for the two 10 mm/s constant rate tests are plotted in Figure 21.
Figure 21 Force time curve for 10 mm/s constant velocity at the Byam Martin site The force-time curves for the constant rate of 100 mm/s and the 100 mm/s decrease following a cosine function speed are plotted in Figure 22. There is general similarity between the two tests, except that the cosine varying tests last a bit longer. Maximum force and time to maximum force for the six tests have been extracted and summarized in Table 4.
Figure 22 Force time curve for 100 mm/s constant velocity and 100 mm/s cosine speed varying tests at the Byam Martin site
Table 4 Force and time to maximum force for Byam Martin tests
cos 100 mm/s 100 mm/s 10 mm/s
Force (MN) 7.65 6.30 9.20 6.95 5.64 6.40
Time to max. force (s) 1.55 1.65 1.02 0.98 12.55 13.00
The data from Table 4 are plotted in Figure 22. The Byam Martin tests were done at different rates so we don’t see the same time dependent failure characteristic for these tests. In these tests the ice face was always the same, flat, and the indentor was the same as well. The only variable was the velocity.
Figure 23 Maximum force as a function of loading rate, Byam Martin
3.4
1989 Ice Island
A large variety of tests were done at the Ice Island in 1989; 1 m2 spherical indentor, flat flexible indentor and flat rigid indentor, with test rates from 2.5 to 100 mm/s. Examples of the force-time and indentor movement-time curves for a 1 m2 spherical indentor test and a flat indentor test are presented in Figure 25 and Figure 26, respectively. Four other tests with flat indentors on shaped ice faces were done at the Ice Island in 1989, but for brevity they are not presented. Details of these other tests may be found in Frederking et al (1990a). Maximum force, time to maximum force and loading rate for six of the 1989 Ice Island tests have been summarized in Table 5
Figure 25 1989 Ice Island test 5 at a rate of ~100 mm/s with a apherical indentor
Table 5 Summary of maximum force, time and rate results of 1989 Ice Island tests
test Force (MN) time (s) rate (MN/s)
#5 1m2 spherical 2.8 0.31 9.0 #6 flat flexible 1.85 1.9 1.0 #7 flat flexible 4.4 0.3 14.7 #8 flat rigid 3.5 0.42 8.3 #9 flat rigid 4.5 0.3 15.0 #10 flat rigid 2.1 0.35 6.0
The summary data from Table 5 have been plotted in Figure 27 and Figure 28, to make trends clearer. Figure 27 shows a trend of increasing force with increasing force rate, similar to the
CCGS Terry Fox.
Figure 27 Maximum force as a function of loading rate, Ice Island 1989 tests
3.5
1990 Ice Island
In 1990 there was another test program at the Ice Island (Masterson et al, 1993). A range of tests with a number of different indentors and prepared ice faces were run, but eight will be singled out here. A flat rigid indentor 1220 mm wide by 1500 mm high was used with three actuators, and run at a constant rate of 100 mm/s. Force time curves for the five tests with the rigid indentor are presented in Figure 29. Test TFR -3 and TFR 05 differed from the other tests in that they started off with a contact area 500 mm by 500 mm, rather than 100 mm by 100 mm for TFR 02 and TFR 04, and 300 mm by 1500 mm for TFR 01.
Figure 29 1990 Ice Island tests with large rigid indentor at 100 mm/s
For the 700 m wide by 1000 mm high flat flexible indentor there were two tests at 400 mm/s and one at 100 mm/s. This high rate was achieved by using three servo valves to provide sufficient flow of oil to a single actuator. One of the high rate tests, SFF 2, is presented in Figure 30, and the 100 mm/s test, TFF 3, in Figure 31.
Figure 30 1990 Ice Island test SFF2 at 400 mm/s
Figure 31 1990 Ice Island test SFF3 at 100 mm/s
The results of the eight test from the Ice Island in 1990 are summarized in Table 6, and plotted in Figure 32 and Figure 33. In this case no loading rate effect can be seen.
SFF 2 -425 -415 -405 -395 -385 -375 -365 -355 0.2 0.25 0.3 0.35 0.4 0.45 0.5 time (s) Ac tu at or D is p la c e me nt ( m m) 0 1 2 3 4 5 Ac tu a tor Fo rc e (MN ) ADA (mm) AL1 (MN) 400 mm/s
Table 6 Summary of selected 1990 Ice Island tests
Test# Force(MN) Time (s) Rate (MN/s)
TFR 01 9.0 1.50 6.0 TFR 02 9.3 1.31 7.1 TFR 03 9.3 0.95 9.8 TFR 04 9.4 1.62 5.8 TFR 05 9.6 0.81 11.8 SFF 1 4.0 0.24 16.6 SFF 2 4.7 0.19 24.7 SFF 3 4.4 0.60 7.3
Figure 32 Maximum force as a function of loading rate, Ice Island 1990 tests TFR1 TFR2 TFR3 TFR4 TFR5 SFF1 SFF2 SFF3 0 2 4 6 8 10 12 0 5 10 15 20 25 30 Fo rc e ( M N) Loading rate (MN/s) Large Indentor Small indentor
Figure 33 Maximum force as a function of time to maximum force, Ice Island 1990 tests
4. SUMMARY
A characteristic of the 2001 CCGS Terry Fox field trials and four sets of medium scale field indentation tests is the increase of force to a maximum over a short time interval. From this information loading time and loading rate can be determined. For the CCGS Terry Fox trials, impact was characterized by an increase of force to a maximum followed by a decrease back to zero; an impact followed by a rebound. This maximum force was related to the mass of the ice feature but could not be related to the ship velocity. The shape of the ice pieces in the local area where the ship impacted them were not defined and was probably quite different for each impact. Likely the local shape of the ice pieces played a controlling role in determining the maximum ice impact force, and the time to reach that maximum force. The maximum impact forces can best be described as stochastic. In the case of the medium scale field indentation tests, indentation velocity was controlled and either a spherical indentor of known geometry indented a flat ice face or a flat indentor indented a prepared ice edge geometry, with an increase in force as the nominal contact area increased.
The results of the four medium scale field indentation tests have been compared with the CCGS
Terry Fox trials on the basis of loading rate and time to maximum force, while recognizing there
were differences in the manner in which the two sets of data were obtained. Figure 34 compares the maximum force as a function of the loading rate. Loading rate was a good basis for sorting the apparently similar CCGS Terry Fox impacts, revealing a rate effect. The impact force can be characterized by an expression
F = 0.25
where F is force in MN and is loading rate in MN/s. The 1989 and 1990 Ice Island tests with a single actuator yielded results with a similar loading rate dependence. The Pond Inlet, Byam Martin and some of the 1990 Ice Island tests were conducted with three actuators, so they had a load capacity of 13.5 MN and generated higher loading rates, and consequently higher forces.
TFR1 TFR2 TFR3 TFR4 TFR5 SFF1 SFF2 SFF3 0 2 4 6 8 10 12 0 0.2 0.4 0.6 0.8 1 1.2 1.4 1.6 1.8 F o rc e (M N )
Time to maximum force (s) Large Indentor
Figure 34 Maximum force as a function of the loading rate for CCGS Terry Fox impacts and medium-scale field indentation tests
The maximum force as a function of time to maximum force is plotted in Figure 35. Even though the CCGS Terry Fox results showed a contrary trend when examined separately, when combined with the medium scale field indentation tests an overall general trend of increasing maximum force with increasing loading time is apparent. The implication is that increasing the loading system capacity, in the case of indentation tests, or impacting larger pieces of ice in the case of
CCGS Terry Fox-type trials, would lead to longer loading times and higher indentation forces.
5. ACKNOWLEDGEMENTS
The authors would like to acknowledge the financial support of the Program of Energy Research and Development (PERD). I would also like to acknowledge the discussions and suggestions on this work by my colleague Michelle Johnston.
6. REFERENCES
Frederking, R. and Johnston, M., 2005. Local Ice Pressures on the CCGS Terry Fox, Proceedings of the 15th (2005) International Offshore and Polar Engineering Conference, Seoul, Korea, June 14-24, 2005, Vo1. 1, p. 718-723.
Frederking, R., Blanchet, D., Jordaan, I.J., Kennedy, K., Sinha, N.K. and Stander, R., 1990a. Field Tests of Ice Indentation At Medium Scale - Ice Island, April 1989, National Research Council – Institute for Research in Construction, Report CR-5866.1, October, 1990.
Frederking, R., Jordaan, I.J. and McCallum, J.S., 1990b. Field tests of ice indentation at medium scale -- Hobson's Choice Ice Island, 1989. IAHR Symposium on Ice, Espoo, Vol. II, pp. 931-944.
Frederking, R, 2010. Strain Rate Effect on the Compressive Strength of Ice and Its Relation to Indentation Processes, Ice Induced Vibrations JIP Workshop, 29-30 November, Oslo, Norway, Invited Paper and Presentation, 20 pp.
Frederking, R, 2011. Rate Effect in Medium Scale Field Indentation Tests, Workshop on Ice-resistant Platforms in the Bohai Sea: field experience and measurements, 13-14 January 2011, National University of Singapore, Invited Paper and Presentation, 22 pp.
Gagnon, R., Cumming, D., Ritch, R., Browne, R., Johnston, M., Frederking, R., McKenna, R. and Ralph, F., 2008. Overview accompaniment for papers on the bergy bit impact trial, Cold Regions Science and Technology, Vol. 52, 1–6.
Masterson, D.M., Johnson, R., Nevel, D., Kenny, J. and Spencer, P.A., 1992. Pressure vs. area relationships from medium scale field ice impact tests. IAHR (11th International Ice Symposium, Banff. pp. 930-966.
Masterson, D. M., R. M. W. Frederking, I. J. Jordaan, P. A. Spencer, 1993. Description of Multi-Year Ice Indentation Tests at Hobson's Choice Ice Island - 1990, OMAE Conference, Glasgow, Scotland, June, 1993 (Paper 93-127), pg. 145-155.
Masterson, D.M., Spencer, P.A., Nevel, D. and Nordgren, R.P., 1999. Velocity effects from multi-year ice tests, 18th OMAE Conference, St. John’s NL, Canada, July 11-16, paper OMAE99-1127.
Ralph, F., McKenna, R. and Gagnon, R. 2008 Iceberg characterization for the bergy bit impact study, Cold Regions Science and Technology, Vol. 52, pp. 7–28.
Ritch, R., Frederking, R., Johnston, M., Browne, R. and Ralph, F., 2008. Local Ice Pressures Measured on a Strain Gauge Panel During the CCGS Terry Fox Bergy Bit Impact Study, Cold Regions Science and Technology, Vol. 52, pp 29-49.
Sinha, N.K., 1981. Rate Sensitivity of Compressive Strength of columnar-Grained Ice, Experimental Mechanics, Vol. 21, No. 6, pp. 209-218, June 1981.