READ THESE TERMS AND CONDITIONS CAREFULLY BEFORE USING THIS WEBSITE.
https://nrc-publications.canada.ca/eng/copyright
Vous avez des questions? Nous pouvons vous aider. Pour communiquer directement avec un auteur, consultez la première page de la revue dans laquelle son article a été publié afin de trouver ses coordonnées. Si vous n’arrivez pas à les repérer, communiquez avec nous à [email protected].
Questions? Contact the NRC Publications Archive team at
[email protected]. If you wish to email the authors directly, please see the first page of the publication for their contact information.
NRC Publications Archive
Archives des publications du CNRC
This publication could be one of several versions: author’s original, accepted manuscript or the publisher’s version. / La version de cette publication peut être l’une des suivantes : la version prépublication de l’auteur, la version acceptée du manuscrit ou la version de l’éditeur.
Access and use of this website and the material on it are subject to the Terms and Conditions set forth at
High-quality lighting: energy-efficiency that enhances employee
well-being
Veitch, J. A.; Newsham, G. R.; Jones, C. C.; Arsenault, C. D.; Mancini, S.
https://publications-cnrc.canada.ca/fra/droits
L’accès à ce site Web et l’utilisation de son contenu sont assujettis aux conditions présentées dans le site LISEZ CES CONDITIONS ATTENTIVEMENT AVANT D’UTILISER CE SITE WEB.
NRC Publications Record / Notice d'Archives des publications de CNRC:
https://nrc-publications.canada.ca/eng/view/object/?id=53f056ca-7b54-4ca3-82c1-7295d97bfaba https://publications-cnrc.canada.ca/fra/voir/objet/?id=53f056ca-7b54-4ca3-82c1-7295d97bfaba
http://www.nrc-cnrc.gc.ca/irc
H igh-qua lit y light ing: e ne rgy-e ffic ie nc y t ha t e nha nc e s e m ploye e w e
ll-be ing
N R C C - 5 3 2 8 6
V e i t c h , J . A . ; N e w s h a m , G . R . ; J o n e s , C . C . ;
A r s e n a u l t , C . D . ; M a n c i n i , S .
M a r c h 2 0 1 0
A version of this document is published in / Une version de ce document se trouve dans:
CIE 2010 Lighting Quality and Energy Efficiency, Vienna, Austria, March
14-17, 2010, pp. 197-204
The material in this document is covered by the provisions of the Copyright Act, by Canadian laws, policies, regulations and international agreements. Such provisions serve to identify the information source and, in specific instances, to prohibit reproduction of materials without written permission. For more information visit http://laws.justice.gc.ca/en/showtdm/cs/C-42
Les renseignements dans ce document sont protégés par la Loi sur le droit d'auteur, par les lois, les politiques et les règlements du Canada et des accords internationaux. Ces dispositions permettent d'identifier la source de l'information et, dans certains cas, d'interdire la copie de documents sans permission écrite. Pour obtenir de plus amples renseignements : http://lois.justice.gc.ca/fr/showtdm/cs/C-42
HIGH-QUALITY LIGHTING: ENERGY-EFFICIENCY
THAT ENHANCES EMPLOYEE WELL-BEING
Jennifer A. Veitch†, Guy R. Newsham†, Carol C. Jones‡, Chantal D. Arsenault†, & Sandra Mancini†
† National Research Council of Canada, Institute for Research in Construction; ‡ Battelle – Pacific Northwest National Laboratory
ABSTRACT
A century of lighting research has delivered a good understanding of how interior lighting affects visual processes, but less clarity concerning how to improve lighting quality beyond adequate seeing. This paper reports a field investigation into the behavioural effects of an energy-saving lighting retrofit. The results show that workstation-specific direct-indirect lighting with individual control is perceived as being more comfortable than recessed parabolic-louvered luminaires. Offices lit with the new lighting were more likely to be perceived as having better lighting than other similar offices. These effects have been previously associated with better outcomes related to organizational productivity. The pattern of results from several studies shows that good-quality lighting can deliver individual, organizational, and environmental benefits.
Keywords: luminaire, lighting appraisal, occupant satisfaction, energy-efficiency, organizational productivity
1. INTRODUCTION
One way to conceptualize lighting quality is to consider it as the result of the successful integration of three domains: the needs of the individual in the space; the architectural features of the space; and, the economic and environmental context of the project [1] (Figure 1). We have a good understanding of the effects of interior lighting on visual processes [2]. However, the means to improve the quality of the lit environment beyond merely adequate seeing — to provide lighting that enhances the health, wealth, and happiness of the occupant — remain unclear [2].
Figure 1. General model of lighting quality [1].
Recent laboratory research has begun to provide guidance on this question. Several investigations have demonstrated that short-term occupants of an office-like setting prefer the appearance of the space when it is lit with a combination of direct and indirect lighting [3-5] Another variable showing consistent findings in sensitive laboratory experiments is individual control over workstation lighting. The benefits include more positive appraisals of the work environment and reduced lighting energy use [6-8]. Moreover, people who appraised their lighting as being of higher quality showed more favourable judgements of the appearance of the room, a more pleasant mood, and better well-being at the end of the working day [9].
Despite these desirable outcomes, one important question has remained: Do these laboratory results hold true in real organizations? The only way to address this question is to conduct a field study in a functioning organization. This paper reports on such a study. It builds on the laboratory experiments cited above [3] and on the linked mechanisms demonstrated in the laboratory data [9]. Figure 2 shows the linked mechanisms
Originally published in Proceedings of CIE 2010 “Lighting Quality and Energy Efficiency“ (CIE x035:2010, pp. 197-204). Vienna, Austria: Commission Internationale de l’Eclairage.
map for the field study. Each concept in the linked mechanisms map has at least one associated measurement, either from the online surveys, on-site measurements, or archival data.
Figure 2. Proposed conceptual model. The
solid black lines indicate relationships observed in the previous experiments. The blue dotted lines are relationships derived from other research. The red dotted line is a logical inference. The grey box denotes archival data. The white boxes are variables measured by the research team.
2. METHOD
2.1 Research Design
The investigation was a naturally-occurring field quasi-experiment taking place in three buildings that are occupied by one organization, a large Canadian corporation. The organization is undergoing a phased renovation of certain floors within its three buildings, involving changes to both lighting and furnishings. The old lighting consists of recessed parabolic-louvered luminaires (abbreviated PARAB) and the new lighting consists of workstation-specific
individually-controllable suspended direct/indirect luminaires (abbreviated WSDI), or
the same luminaire with the indirect lamp turned off (abbreviated WSD).
The investigation consisted of extensive surveys of occupants on three occasions and detailed physical measurements in offices.
The phasing-in of the lighting retrofit has provided comparison groups to permit the separation of effects associated with light distribution, individual control over lighting, and office furnishings. Table 1 shows the groups formed by the combinations of lighting and furnishings. In addition, some of the floors with WSDI and WSD lighting lacked individual control at either T0 or T1, enabling comparisons of the
effect of individual control between groups with the same luminaire and furnishings.
Table 1. Lighting and furnishings combinations in the three buildings, with valid sample sizes (N) for T0, T1, T2 shown beneath. PARAB WSDI WSD Old panels – teal Bldg 1, 2 474, 451, 373 Old panels – grey Bldg 3 4, 10, 12 Bldg 3 69, 80, 62 New panels Bldg 1 20, 12, 8 Bldg 1, 2 61, 77, 43 Bldg 3 35, 50, 45 2.2 Participants
Over the three waves, a total of 3841 individuals were invited to participate at least once and 1750 people participated at least once, for an overall participation rate of 46%. (The number of survey invitations and respondents by wave were T0, 2749/1022, T1 3035/1022, T2
2856/791.) Data analysis focused on the 89% of participants whose offices were in the open-plan areas of the buildings, and for which the lighting and furnishings types could be confidently determined (T0, N = 663, T1 N = 680, T2 N =
543). Slightly more women responded than expected (49% of the sample was female, versus 45 % of the organization) and the sample was slightly younger than the organization as a whole (sample weighted average age = 41 years; organization weighted average age = 42.8).
2.3 Building and Lighting Conditions
2.3.1 Buildings
The three buildings are located in one large metropolitan area in western Canada. Buildings 1 and 2 were constructed in the late 1980s/early 1990s; Building 3 was constructed in the mid-1990s and three floors were added in 2007. All the buildings have large windows on all sides. The old furniture and floor layout placed private
offices on the perimeter and cubicles centrally. One of the goals of the renovation was to increase daylight access for occupants; therefore the new layouts place private, enclosed offices in the interior and open-plan cubicles in the perimeter, and use lower panel heights to increase daylight penetration.
2.3.2 Furnishings
Both the old and new furnishings consist of modular systems furniture, but the old offices have higher panels covered in a dark fabric (average reflectance 27%, with accents of 45% grey and 10% maroon) and the new ones feature lower panels and lighter colours (predominantly white at 63% reflectance, with accents of 33% gold). A small subset of the offices have furniture more in the old style (grey panels, 35%) but have had the new lighting for several years. Figure 3 shows the old and new designs in views taken from the location of a seated occupant.
Figure 3 (top). Workstation with old lighting and furnishings. Figure 3 (bottom). Workstation with new lighting and furnishings. 2.3.3 Lighting
The PARAB lighting consists of recessed 2’ x 4’ (90%) and 2’ x 2’ (10%) recessed deep-cell (4”) parabolic-louvered luminaires, each with 2 T8 lamps at 85 CRI and 3500 CCT and
non-dimming electronic ballasts. There is no individual control. As part of an extensive energy conservation program, some luminaires (principally those beside windows) have been delamped. Our photometric measurements were made in areas where there was no delamping.
The WSDI luminaires have three lamps, all 32WT8 lamps at 85 CRI and 3500 CCT. One of the three lamps provides the indirect component; it is run on a non-dimming electronic ballast at full power throughout the workday. The other two lamps provide the direct component, and are run on a dimming electronic ballast. The occupant can control the direct component using an interface on the computer in the workstation. Occupancy and daylight-linked dimming controls operate automatically on the direct lamps to reduce energy consumption. The indirect lamp remains at a fixed setting throughout occupied hours.
The WSD variation used in Building 3 uses the same luminaire and controls, but the indirect (up) lamp is always off. The luminaire design ensures that there remains a substantial indirect component to the distribution when the remaining lamps are on. The individual and automatic controls are the same as for the WSDI luminaires.
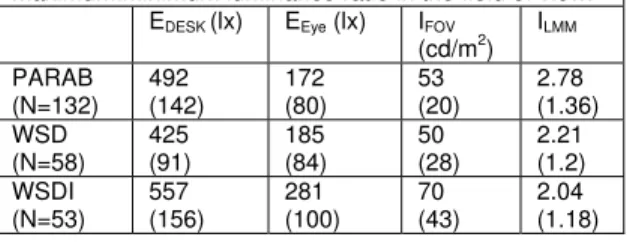
The research team visited the organization on three occasions and made extensive measurements of both luminance and illuminance at a large number of workstations both by day and night. Table 2 shows a selection of the average luminous conditions measured at night (i.e., electric lighting only) for PARAB, WSD, and WSDI luminaires.
Table 2. Mean (standard deviation) measured luminous conditions for electric lighting systems at 100% output. EDESK is the average of two desktop readings. EEYE is the vertical illuminance at the eye location of a seated occupant. IFOV is the luminance of the 40-degree field of view of a seated occupant. ILMM is the log(10) of the maximum:minimum luminance ratio in the field of view.
EDESK (lx) EEye (lx) IFOV (cd/m2) ILMM PARAB (N=132) 492 (142) 172 (80) 53 (20) 2.78 (1.36) WSD (N=58) 425 (91) 185 (84) 50 (28) 2.21 (1.2) WSDI (N=53) 557 (156) 281 (100) 70 (43) 2.04 (1.18) 2.4 Procedure
There were three measurement waves: a baseline (T0) measurement (Spring 2008) and
two post-renovation surveys, T1 (Spring 2009)
and T2 (Summer 2009). Each wave included an
online survey for the building occupants. The surveys were composed of questionnaires and tasks to assess all of the concepts in the linked mechanisms map) together with demographic questions and questions about job demands and work group communications. The latter data were used to establish the comparability of the comparison groups, following the principles of quasi-experimental research design [10].
Each survey wave was announced to potential participants with an article in the weekly employee newsletter and a separate message to building occupants. Occupants of the target floors in the three buildings received an invitation to participate in an e-mail message from NRC-IRC. The invitation included a hyperlink to the survey, which was hosted on a secure server at NRC. Each survey wave was three weeks long, with reminder e-mails sent at the start of each week. As an incentive to participate, a contribution of $5 per respondent was made to the organization’s charitable foundation. Following each wave there was an announcement in the employee newsletter of the amount that had been generated.
The research team made a site visit in conjunction with each survey wave to assess the physical conditions at selected locations in the three buildings. At the T0 site visit, the protocol
included workstation acoustics, temperature, relative humidity, afternoon illuminance (with daylight), night (electric lighting only) illuminance and luminance. At T1 and T2, the protocol
included temperature, relative humidity, afternoon illuminance and luminance (with daylight), night (electric lighting only) illuminance and luminance. We also obtained archival measurements of power consumption for the three buildings over the study period.
3. RESULTS
The survey included assessments of lighting quality, satisfaction with the physical environment, mood, room appearance, job satisfaction, organizational commitment, intent to turnover, and physical and visual comfort, as well as cognitive task performance and, at T0
only, creativity. This report is limited to judgements of lighting quality using the Office Lighting Survey (OLS) [11] and satisfaction with windows and daylighting. Results for the other outcomes will be presented elsewhere.
We selected subsets of the data to conduct planned comparisons within and across measurement waves. The principal comparison in the investigation was between the PARAB and WSD/WSDI lighting installations. We also examined the additional benefits of obtaining individual control over lighting, and examined the effects of the furniture change alone.
3.1 Lighting Design Effects
3.1.1 With Old Furniture
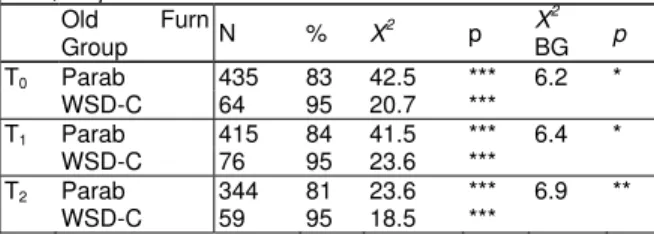
We considered the two old furniture types to be roughly comparable in layout and reflectance, although clearly different in colour. There were two lighting types represented among the floors with old furniture: PARAB and WSD-C (WSD with control). All of the WSD workstations with old furniture included individual control over the lighting at all survey times. The results for this comparison were consistent over the three survey times. Overall, the participants judged their lighting to be more comfortable than the normative sample for the Office Lighting Survey; however, at all three times there was a significant difference between the two lighting types in which the proportion of people that judged WSD-C to be comfortable was greater than the proportion judging PARAB to be comfortable (Table 3).
Table 3. Per cent agreement at each survey time with the statement “Overall, the lighting is comfortable.” (Norm: 69% agree), for PARAB and WSD lighting groups with old furniture. The first X2
column tests the result for this group against the normative sample. The X2
BG column is the test for the difference between two study groups * p< 0.05; ** p< 0.01; *** p< 0.001.. Old Furn Group N % X 2 p X 2 BG p T0 Parab 435 83 42.5 *** 6.2 * WSD-C 64 95 20.7 *** T1 Parab 415 84 41.5 *** 6.4 * WSD-C 76 95 23.6 *** T2 Parab 344 81 23.6 *** 6.9 ** WSD-C 59 95 18.5 ***
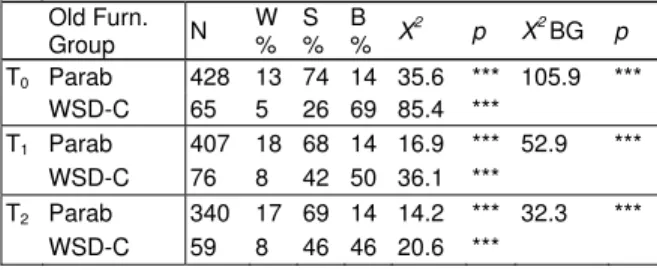
Similarly, there was a consistent result in which more WSD-C than PARAB respondents judged their lighting to be better than in similar workplaces in other buildings, at all three times (Table 4). The PARAB group itself was more likely than expected (based on the normative sample) to say that the lighting the same as in other workplaces, and less likely than expected to rate it as better.
Table 4. Responses to the question “How does the lighting compare to similar workplaces in other buildings?” for PARAB and WSD-C lighting groups with old furniture. Norm: 19% Worse / 60% Same / 22% Better. The first X2
column tests the result for this group against the normative sample. The X2
BG column is the test for the difference between two
study groups. *** p< 0.001. Old Furn. Group N W % S % B % X 2 p X2 BG p T0 Parab 428 13 74 14 35.6 *** 105.9 *** WSD-C 65 5 26 69 85.4 *** T1 Parab 407 18 68 14 16.9 *** 52.9 *** WSD-C 76 8 42 50 36.1 *** T2 Parab 340 17 69 14 14.2 *** 32.3 *** WSD-C 59 8 46 46 20.6 ***
3.1.2 With New Furniture
One floor had the new furniture, but PARAB lighting. There were sufficient respondents at T0
(N=20) from this floor to compare their responses to a subset of individuals with new furniture and WSD lighting, but no individual control (WSD) (N=35). These results also showed the WSD lighting to be more likely to be rated as comfortable (100% agree for WSD, 65% agree for PARAB, X2(1)=14.04, p<.001)and
as better than lighting in other similar workplaces (Table 5). Unfortunately, the response rates for the other survey times did not permit a repeat of this test for T1 or T2. In this
contrast, note that the PARAB group ratings were not different from the normative sample.
Table 5. Responses to the question “How does the lighting compare to similar workplaces in other buildings?” for PARAB and WSD lighting groups with new furniture. Norm: 19% Worse / 60% Same / 22% Better. The first X2
column tests the result for this group against the normative sample. The X2 BG column is the test for the difference between two study groups. ** p< 0.01; *** p< 0.001. New Furn. Group N W % S % B % X 2 p X2 BG p T0 Parab 20 10 55 35 2.5 9.8 ** WSD 35 0 26 74 57.0 ***
3.2 Lighting Control Effects
We examined four comparisons to assess the effect of having individual control over lighting, two at T0 and one at T1
At T0, there was a group with WSD and new
furniture whose individual controls had not been activated. We compared this group to a group with WSD and control (WSD-C), but old furniture, and to a group with WSDI-C and new furniture. The OLS scores for all of these groups were better than the normative values, but they
did not differ. Individual controls were activated for the WSD group shortly after T0.
At T1, in an intervention, we arranged for
individual controls not to be activated when occupants moved into a newly-renovated floor (WSDI). We compared their OLS scores to a WSDI-C floor in the same building, but which had been occupied for more than 18 months. Again, scores for both groups showed that the WSDI lighting was more comfortable and perceived as better than lighting in other workplaces, but the scores did not differ between the groups. Individual controls were activated shortly after T1.
We also compared the OLS responses at T1
(WSDI) and T2 (WSDI-C) for people on the floor
where we had intervened. The T1 ratings were
very high (86% of people rated the lighting as comfortable, and only 10% rated the lighting as worse than in other offices). The T2 ratings were
slightly higher, as expected (91% of people rated the lighting as comfortable, and none rated it as worse than in other offices). The differences between the times were not statistically significant, but this is attributable to the small sample size (at T1, N=21, at T2, N=11). On the
comparison floor, which had WSDI-C at both times, there were also no statistically significant differences between T1 and T2; on that floor the
trends showed either no change or a slight decline over time.
This investigation did not demonstrate an effect of individual control over lighting separate and in addition to the effect of having a workstation-specific luminaire. two limitations might account for this. In each case in which we intervened to delay the addition of individual controls. people without control had moved to newly renovated spaces within the previous 3 months. This could have led to a ceiling effect because of the generally good appraisals of the luminaires. The small sample sizes for these comparisons are the second limitation to this study. Previous laboratory research has shown repeatable effects of individual control [3, 7].
3.3 Furnishings Effects
The renovation changed the visual environment dramatically because of both the new lighting and the new furnishings. We controlled as far as possible for the effects of the furnishings in the contrasts above. Nonetheless, we needed to examine differences in lighting evaluations in relation to changes in furnishings. This
comparison involved participants with WSD-C lighting at both T1 and T2. All of these
participants worked in Building 3, so that insofar as possible, all conditions were constant between the two groups except for the furnishings. The results were consistent at T1
and T2. At both times, only one question showed
a statistically significant difference: Participants with new furniture were more likely to judge the lighting as being better than in other similar workplaces (Table 6), although both groups were more likely than the normative sample to make that judgement. The new furniture has a positive effect, but the luminaire effect is in addition to this (note that the luminaire tests reported in section 3.1 held furniture constant).
Table 6. Responses to the question “How does the lighting compare to similar workplaces in other buildings?” for WSD lighting groups with old and new furniture. Norm: 19% Worse / 60% Same / 22% Better. The first X2
column tests the result for this group against the normative sample. The
X2
BG column is the test for the difference between two study groups. * p< 0.05; ** p< 0.01; *** p< 0.001. WSD-C Group N W % S % B % X 2 p X2 BG p T1 Old 80 9 41 50 37.6 *** 6.9 * New 50 2 26 72 74.1 *** T2 Old 63 8 48 44 20.1 *** 12.1 ** New 45 2 20 78 82.3 ***
The finding that furnishings influenced this lighting appraisal might explain the absence of a Control effect in the T0 WSD contrast (section
3.2), when one group had control (with old furniture) and one did not (the group with new furniture). There was no difference on any OLS item at that time, perhaps because of the simultanous opposing influences of control and new furniture.
3.4 Power Consumption
We had planned to examine archival data for measured power consumption for lighting in the three buildings over the study period. It was not possible to obtain all of the data required for this comparison. Moreover, the organization initiated a competitive energy conservation program shortly before T0, which led to delamping efforts
on floors without individual control and to actions such as the removal of the indirect lamps on the workstation-specific luminaires in Building 3. The strong goal of reducing power consumption, and ongoing communications on the topic, over the study period would have confounded the comparison had the data been available.
However, a previous study of lighting energy use comparing WSDI luminaires with varying
control strategies against PARAB luminaires with zonal on/off switching is pertinent here [12]. This study contrasted the same lighting strategies compared in our survey, and found that the WSDI installation together with occupancy, daylight-sensing, and individual controls reduced lighting energy use (and peak power demand) by 69% over the PARAB installation with the same furniture layout. A similar result would be expected in the renovated areas studied here.
4. DISCUSSION
The lighting industry has sought for decades to demonstrate that investments in good lighting will have financial benefits for organizations. This study is an important link in the evidentiary chain. As far as we are aware it is the largest field investigation of its kind.
The results presented here are limited to a single outcome measure, lighting appraisals using the Office Lighting Survey. They show that workstation-specific direct-indirect lighting with individual control is perceived as superior to recessed parabolic-louvered luminaires. Although many other outcomes remain to be analysed, this finding is significant because of its connection to previous investigations. Reporting on previous Light Right Consortium research, Veitch et al. [9] reported that people who judged the lighting to be more comfortable (using the same measure as reported here) also reported that the room was more attractive, that their mood was more pleasant, and that their end-of-day environmental and performance satisfaction was higher. An NRC-IRC study of open-plan offices found that higher overall environmental satisfaction predicted higher job satisfaction [13]. In turn, higher job satisfaction predicts higher organizational commitment and lower intent to turnover [14]. Further analyses of this data set will test this chain directly.
The lighting retrofit implemented here delivers known energy savings. It also delivers benefits for the office occupants. These benefits, based on sound organizational psychology research, translate into reduced personnel costs for organizations in the form of reduced turnover. Not all energy-efficiency retrofits will have these many beneficial outcomes. Those that pay attention to the many dimensions of lighting quality, will.
7
REFERENCES
1. Veitch, J.A., W. Julian, and A.I. Slater, A
framework for understanding and promoting lighting quality, in Proceedings of the First CIE Symposium on Lighting Quality, J.A. Veitch,
Editor. 1998, Commission Internationale de l'Eclairage: Vienna, Austria. p. 237-241.
2. Boyce, P.R., Lighting research for interiors:
the beginning of the end or the end of the beginning. Lighting Research and Technology,
2004. 36: p. 283-294.
3. Boyce, P.R., et al., Lighting quality and office
work: Two field simulation experiments. Lighting
Research and Technology, 2006. 38(3): p. 191-223.
4. Houser, K.W., et al., The subjective response
to linear fluorescent direct/indirect lighting systems. Lighting Research and Technology,
2002. 34(3): p. 243-264.
5. Veitch, J.A. and G.R. Newsham, Preferred
luminous conditions in open-plan offices: Research and practice recommendations.
Lighting Research and Technology, 2000. 32: p. 199-212.
6. Boyce, P.R., et al., Occupant use of switching
and dimming controls in offices. Lighting
Research and Technology, 2006. 38(4): p. 358-378.
7. Newsham, G.R., et al., Effect of dimming
control on office worker satisfaction and performance, in Proceedings of the IESNA Annual Conference, Tampa, FL, July 26-28, 2004. 2004, IESNA: New York. p. 19-41.
8. Veitch, J.A. and G.R. Newsham, Exercised
control, lighting choices, and energy use: An office simulation experiment. Journal of
Environmental Psychology, 2000. 20: p. 219-237.
9. Veitch, J.A., et al., Lighting appraisal,
well-being, and performance in open-plan offices: A linked mechanisms approach. Lighting Research
and Technology, 2008. 40(2): p. 133-151.
10. Shadish, W.R., T.D. Cook, and D.T. Campbell, Experimental and quasi-experimental
designs for generalized causal inference. 2002,
Boston, MA: Houghton Mifflin.
11. Eklund, N.H. and P.R. Boyce, The
development of a reliable, valid, and simple office lighting survey. Journal of the Illuminating
Engineering Society, 1996. 25(2): p. 25-40.
12. Galasiu, A.D., et al., Energy saving lighting
control systems for open-plan offices: a field study. Leukos, 2007. 4(1): p. 7-29.
13. Veitch, J.A., et al., A model of satisfaction
with open-plan office conditions: COPE field findings. Journal of Environmental Psychology,
2007. 27(3): p. 177-189.
14. Carlopio, J.R., Construct validity of a
physical work environment satisfaction questionnaire. Journal of Occupational Health
Psychology, 1996. 1: p. 330-344.
ACKNOWLEDGEMENTS
This investigation forms part of the NRC-IRC project Light Right Field Study (NRCC Project # B3230), supported by the Light Right Consortium, which is managed by Pacific
Northwest National Laboratory (http://www.lightright.org). This phase of the
Light Right Consortium was supported by the US Department of Energy, the National Electrical Manufacturers Association, the New York State Energy Research and Development Authority, BC Hydro, the Illuminating Engineering Society of North America, the International Association of Lighting Designers, the International Facility Management Association, and the National Research Council of Canada. The authors thank for their assistance many people at the host organization, NRC-IRC staff Benjamin Birt and Dan Sander, and students YuJing Fan, Tessa Finch, Navaneethan Siva, Emilie Thibault, and Richard Wong.
Authors
Jennifer A. Veitch
National Research Council of Canada Institute for Research in Construction Bldg M-24, 1200 Montreal Road Ottawa, ON K1A 0R6 Canada +1 613-993-9671
+1 613 993-9671
© 2010, National Research Council of Canada & Battelle Pacific Northwest National Laboratory
![Figure 1. General model of lighting quality [1].](https://thumb-eu.123doks.com/thumbv2/123doknet/14147795.471410/4.918.487.771.280.547/figure-general-model-lighting-quality.webp)