HAL Id: hal-00301537
https://hal.archives-ouvertes.fr/hal-00301537
Submitted on 6 Dec 2004HAL is a multi-disciplinary open access
archive for the deposit and dissemination of sci-entific research documents, whether they are pub-lished or not. The documents may come from teaching and research institutions in France or abroad, or from public or private research centers.
L’archive ouverte pluridisciplinaire HAL, est destinée au dépôt et à la diffusion de documents scientifiques de niveau recherche, publiés ou non, émanant des établissements d’enseignement et de recherche français ou étrangers, des laboratoires publics ou privés.
Evaluation of the hydrological cycle of MATCH driven
by NCEP reanalysis data: comparison with GOME
water vapor field measurements
R. Lang, M. G. Lawrence
To cite this version:
R. Lang, M. G. Lawrence. Evaluation of the hydrological cycle of MATCH driven by NCEP reanalysis data: comparison with GOME water vapor field measurements. Atmospheric Chemistry and Physics Discussions, European Geosciences Union, 2004, 4 (6), pp.7917-7984. �hal-00301537�
ACPD
4, 7917–7984, 2004 Hydrological cycle of MATCH R. Lang and M. G. Lawrence Title Page Abstract Introduction Conclusions References Tables Figures J I J I Back CloseFull Screen / Esc
Print Version Interactive Discussion
EGU
Atmos. Chem. Phys. Discuss., 4, 7917–7984, 2004 www.atmos-chem-phys.org/acpd/4/7917/
SRef-ID: 1680-7375/acpd/2004-4-7917 European Geosciences Union
Atmospheric Chemistry and Physics Discussions
Evaluation of the hydrological cycle of
MATCH driven by NCEP reanalysis data:
comparison with GOME water vapor field
measurements
R. Lang and M. G. Lawrence
Max-Planck Institute for Chemistry, Mainz, Germany
Received: 15 October 2004 – Accepted: 22 November 2004 – Published: 6 December 2004 Correspondence to: R. Lang (lang@mpch-mainz.mpg.de)
ACPD
4, 7917–7984, 2004 Hydrological cycle of MATCH R. Lang and M. G. Lawrence Title Page Abstract Introduction Conclusions References Tables Figures J I J I Back CloseFull Screen / Esc
Print Version Interactive Discussion
EGU
Abstract
This study examines two key parameters of the hydrological cycle, water vapor (WV) and precipitation rates (PR), as modelled by the chemistry transport model MATCH (Model of Atmospheric Transport and Chemistry) driven by National Centers for Envi-ronmental Prediction (NCEP) reanalysis data (NRA). For model output evaluation we
5
employ WV total column data from the Global Ozone Monitoring Experiment (GOME) on ERS-2, which is the only instrument capable measuring WV on a global scale and over all surface types with a substantial data record from 1995 to the present. We find that MATCH and NRA WV and PR distributions are closely related, but that significant regional differences in both parameters exist in magnitude and distribution patterns
10
when compared to the observations. We also find that WV residual patterns between model and observations show remarkable similarities to residuals observed in the PR when comparing MATCH and NRA output to observations comprised by the Global Precipitation Climatology Project (GPCP). We conclude that deficiencies in model pa-rameters shared by MATCH and NRA, like, for example, in the evapotranspiration rates,
15
are likely to lead to the observed differences. Regional differences between MATCH modelled WV columns and the observations can be as large as 2 cm on the basis of a three years monthly average. Differences in the global mean WV values are, how-ever, below 1 mm. Regional differences in the PR between MATCH and GPCP can be above 5 mm per day and MATCH computes on average a higher PR than what has
20
been observed. As a consequence, this leads to shorter model WV residence times by about 1 day as compared to NRA data and the observations. We find that MATCH has problems in modelling the WV content in regions of strong upward convection like, for example, along the Inter Tropical Convergence Zone, where it appears to be gen-erally too dry as compared to the observations. The study therefore suggests that a
25
too rapid conversion of WV to precipitate in MATCH, especially in instances of strong convection, leads to regionally too dry model results and in turn to generally too low WV residence times. The study additionally demonstrates the value of the GOME WV
ACPD
4, 7917–7984, 2004 Hydrological cycle of MATCH R. Lang and M. G. Lawrence Title Page Abstract Introduction Conclusions References Tables Figures J I J I Back CloseFull Screen / Esc
Print Version Interactive Discussion
EGU
record for model evaluation.
1. Introduction
The accurate knowledge of the 3-D water vapor (WV) field is essential for the un-derstanding of a variety of physical and chemical processes in the atmosphere and therefore one of the key parameters for the accurate modelling of climate forcing and
5
its feedback mechanisms. WV is the strongest greenhouse gas, because it is the fourth most abundant atmospheric constituent absorbing over large parts of the spec-tral region from the visible up to the infra-red, and because of its emission of thermal radiation from the far infrared to the microwave regions (Learner et al.,2000). WV plays an essential role in the direct and indirect effect of radiative forcing via its influence on
10
aerosol optical properties and the formation of clouds and precipitation. WV is a driving parameter in reactive chemistry related to ozone and HOx. Due to its complex spec-troscopic structure the contribution of WV to the total radiative forcing budget and the various feedback processes, however, still can not be quantified accurately (Maurellis
and Tennyson,2003;Minschwander and Desseler,2004). Detailed parameterizations
15
of aerosol optical properties and cloud formation in general circulation models (GCM) and chemical transport models (CTM) are currently being developed (e.g. in the frame-work of the EU funded Particles of Human Origin Extinguishing Natural solar radiation In Climate Systems project PHOENICS, or the Global Aerosol Model interCOMparison project AEROCOM), but will significantly increase the demand for accurate knowledge
20
of the 3D-WV distribution in the near future (Metzger et al.,2002), as well as the de-mand for data for cross-comparison and model performance evaluation.
Comparisons of global model output to observations of the atmospheric WV distribu-tion from both GCMs and CTMs are still in their early stages due to lack of independent and consistent observations with global coverage on longer time scales. This paper
25
and a following companion paper will therefore address the question how well the hy-drological cycle is represented by a CTM frequently used for modelling of tropospheric
ACPD
4, 7917–7984, 2004 Hydrological cycle of MATCH R. Lang and M. G. Lawrence Title Page Abstract Introduction Conclusions References Tables Figures J I J I Back CloseFull Screen / Esc
Print Version Interactive Discussion
EGU
ozone and aerosol related chemistry: The Model of Atmospheric Transport and Chem-istry (MATCH). MATCH is, as other CTMs, driven by basic meteorological input data, i.e. temperature, pressure, horizontal winds, surface wind stresses, and latent and sen-sible heat fluxes, which are taken from weather center analysis and re-analyses, such as those from the National Centers for Environmental Prediction (NCEP) or the
Euro-5
pean Center for Medium-range Weather Forecasts (ECMWF). However, in contrast to other CTMs, MATCH is currently, to the best of our knowledge, the only CTM where the tropospheric hydrological cycle is calculated directly within the model, using NCEP surface evapotranspiration fluxes as the input of WV to the troposphere and employing parameterizations for cloud formation and precipitation, which are closely related to
10
those used in the Community Climate Model version 3 (CCM3) of the National Center for Atmospheric Research (NCAR). MATCH may therefore be characterized as what we call a “semi-online” CTM. This specific formulation of the MATCH model guaran-tees a consistent balance between evaporation fluxes and precipitation rates (PR), and prevents an under or overestimation of the atmospheric WV residence time via a too
15
rapid or too slow conversion of nudged specific humidity in precipitation.
The question posed by this paper is how well are the main parameters of the hy-drological cycle represented by MATCH over longer time series in comparison to data-assimilation models like the ECMWF REanalysis ERA-40 (ERA) and the NCEP/NCAR Reanalysis (NRA). The paper focuses on the evaluation of modelled monthly mean
20
WV content and precipitation amounts computed by MATCH driven by NRA. MATCH has been used for numerous studies of atmospheric chemistry and transport includ-ing the chemistry of tropospheric ozone and nonmethane hydrocarbons (Rasch et al.,
1997;Mahowald et al.,1997a,b;Lawrence and Crutzen,1998,1999;Lawrence,2001;
Lawrence et al.,1999,2003a;von Kuhlmann et al.,2003a,b;Bonn et al.,2004;
Kunhikr-25
ishnan et al.,2004a,b,c;Labrador et al.,2004a,b), and for chemical weather forecasting using NCEP Analysis data (Lawrence et al.,2003b). Differences between model out-put and observations are analyzed in light of the previously mentioned ongoing studies on new aerosol and cloud microphysical parameterizations used in models which only
ACPD
4, 7917–7984, 2004 Hydrological cycle of MATCH R. Lang and M. G. Lawrence Title Page Abstract Introduction Conclusions References Tables Figures J I J I Back CloseFull Screen / Esc
Print Version Interactive Discussion
EGU
may successfully be evaluated providing a good understanding of all other parameters and mechanism leading to the observed residuals. The evaluation of the modelled WV distribution requires appropriate observations on a global scale, preferably from independent sources, which also can be cross-evaluated to help reveal where model discrepancies appear robust in light of measurement errors. The second main purpose
5
of this study is to present such a set of observations, which we will use to evaluate var-ious configurations of MATCH as well as of the GCM ECHAM version 5 in subsequent studies.
MATCH and NRA WV distributions will be compared to independent satellite based remote sensing measurements from the Global Ozone Monitoring Experiment (GOME)
10
on ESA’s ERS-2 satellite platform covering the whole globe. GOME WV data retrievals have recently be demonstrated to deliver good results over all surface types and in cloud-free situations (Lang et al.,2003). GOME data is not assimilated in either ERA or NRA and provides a data record starting in August 1995 until present, which makes it suitable for model evaluations. The evaluated data periods cover August 1996 to
15
1998 and January 1996 to 1998, including the strong ENSO years of 1997 and 1998. There is no other instrument with a comparable data record measuring WV on a global scale and over all surfaces types. Well known instrument suites like the TIROS Oper-ational Vertical Sounder (TOVS) and is successors (Advanced-TOVS series; 1979 to present), or the Special Sensor Microwave Imager (SSM/I) on the Defense
Meteoro-20
logical Satellite Platform (DMSP) series (1987 to present) measure WV in the infrared or microwave regions and are restricted to either land or ocean surfaces (Engelen
and Stephens, 1999). New generations of instruments like the Moderate Resolution Imaging Spectroradiometer (MODIS) on the Aqua and Terra platforms (1999–present), the Medium Resolution Imaging Spectrometer (MERIS) and the SCanning Imaging
25
Absorption spectroMeter for Atmospheric CartograpHY (SCIAMACHY) on ESA’s EN-VISAT (2002 to present), as well as the instruments more specifically dedicated to WV like the Atmospheric Infrared Sounder (AIRS; 2002 to present) on Aqua and the In-frared Atmospheric Sounding Interferometer (IASI) to be launched by the end of 2005
ACPD
4, 7917–7984, 2004 Hydrological cycle of MATCH R. Lang and M. G. Lawrence Title Page Abstract Introduction Conclusions References Tables Figures J I J I Back CloseFull Screen / Esc
Print Version Interactive Discussion
EGU
on EUMETSATs Metop series, will greatly improve our knowledge of the tropospheric 3-D WV field. However, the data record of most of the named instruments is not yet long enough for valuable model evaluations. It should also be mentioned, that even though significant advances in remote sensing technology have been made in recent years and instruments like AIRS and IASI will achieve unprecedented spatial
resolu-5
tion performances, in order to get the complete knowledge of the 3-D WV distribution a combination of data from various sensors as well as radiosondes will still be required within the foreseeable future. This study will demonstrate the value as well as the limitations of the GOME WV data record and that of its successors (GOME-2 on the METOP series) to contribute to blended WV products for model evaluation.
10
In Sect.2we describe the various sources used for MATCH model output evaluation starting with a detailed description of the GOME WV product (Sect. 2.1). This is the first use of the GOME WV-record for model evaluation. A brief description of the ap-plied Spectral Structure Parameterization (SSP) algorithm developed byMaurellis et al.
(2000a) andLang et al. (2003) for retrieval of narrow band absorbers will be provided
15
together with a more detailed description of the simultaneously derived cloud-mask (Sect.2.2). The latter is crucial for instruments measuring tropospheric constituents in the near-infrared, the visible and the UV region of the spectrum like WV or NO2, for which the total columns retrieved are significantly affected by clouds blocking the light from travelling through the lower region of the atmosphere. Satellite based WV
mea-20
surements from SSM/I briefly described in Sect.2.3are used together with radiosonde data to demonstrate the feasibility of using GOME WV data for model evaluations over ocean and land surfaces. The NASA Water Vapor Project (NVAP) data set introduced in Sect. 2.4 combines WV data from SSM/I, the TOVS instruments, and radiosonde data to provide a product for model evaluation and climate studies on a global scale.
25
We use NVAP data as an additional source for comparison of both model output data and data retrieved from GOME. Note, however, that NVAP is not a completely indepen-dent source for transport model evaluations because both SSM/I and TOVS data are routinely assimilated in weather center reanalysis products. The meteorological input
ACPD
4, 7917–7984, 2004 Hydrological cycle of MATCH R. Lang and M. G. Lawrence Title Page Abstract Introduction Conclusions References Tables Figures J I J I Back CloseFull Screen / Esc
Print Version Interactive Discussion
EGU
parameters from NRA used in MATCH will be discussed in Sect.4for their crucial influ-ence on the MATCH hydrological cycle and the specific implementation of the MATCH model employed here is laid out in Sect.5.
After a detailed evaluation of the GOME WV record over the three years period of interest in Sect. 6.1 we compare monthly averaged WV fields computed by MATCH
5
for different periods with results from GOME, NVAP and NRA in Sect. 6.2. Therein, residuals between rain gauges measurements compiled by the Global Precipitation Climatology Project (GPCP) (Rudolf,2001) (for a description of the GPCP data set see Sect.3) and model as well as reanalysis fields, will be compared to derived residuals from comparisons of model WV fields with GOME measurements. We will focus on
10
regions like Europe and the Southern Asian/Indian Ocean area, which are of specific interest with respect to the impact of anthropogenic and non-anthropogenic aerosol load on the parameters of the hydrological cycle. The results will be discussed in order to differentiate between MATCH model-related effects on the observed residual patterns and differences caused by the influence of reanalysis data contribution on the
15
model results. We will finally draw conclusions which will provide a basis for following-up MATCH model sensitivity studies using different sets of reanalysis data and different assumptions in the basic parameters.
2. Water vapor measurements
2.1. GOME
20
The Global Ozone Monitoring Experiment (GOME) spectrometer on the European Space Agency’s ERS-2 satellite (ESA,1995;Burrows et al.,1999) measures backscat-tered solar radiation continuously between between 240 and 790 nm with a spectral resolution of on average 0.22 nm in the visible and near infrared regions. Column con-centration retrieval is routinely carried out for O3and NO2(level 2 products). Important
25
ACPD
4, 7917–7984, 2004 Hydrological cycle of MATCH R. Lang and M. G. Lawrence Title Page Abstract Introduction Conclusions References Tables Figures J I J I Back CloseFull Screen / Esc
Print Version Interactive Discussion
EGU
BrO, has also been delivered (Thomas et al.,1998). The instrument measures on a spatial resolution of 40 by 320 km at three different observation angles, west, nadir and east scanning, resulting in a total swath width of 960 km. ERS-2 crosses the equator at about 10:30 local time. The absorption spectra derived from channel 3 and 4 of the instrument contain 3 overtone absorption bands of WV around 580, 640 and 720 nm.
5
Measurements presented here make use of the 580 nm absorption band covered by 185 detector pixels between 560 and 600 nm. This spectral region also contains ad-ditional broad-band absorption features of the O3 Chappuis absorption band and a strong absorption by (O2)2 (see Fig. 1)(Lang et al., 2002). The forward model em-ployed is the Spectral Structure Parameterization (SSP) model (Maurellis et al.,2000a;
10
Lang et al.,2003) including direct-surface and single-scattering path contribution. SSP
already demonstrated its capability to derive total water vapor column (WVC) values over all surface types in cloud-free situation with an accuracy of 0.3 cm for moderate aerosol-impact scenarios based on more than 300 representative GOME retrievals and 0.5 cm in aerosol rich environments. So far, WVC from the GOME instrument has been
15
derived for specific case studies only (No ¨el et al., 1999; No ¨el et al., 2002; Maurellis
et al.,2000b;Casadio et al.,2000;Wagner et al.,2003;Lang et al.,2002,2003), which have not yet demonstrated their potential for transport model evaluation over longer time series. Apart from providing WVC over all surface types and in cloud-free situa-tions, GOME WVC are an independent measurement validation from water vapor fields
20
delivered by the NCEP or ECMWF reanalysis set, which are frequently used for data assimilation or evaluation in CTMs. In contrast, SSM/I and (A)TOVS WVC are routinely assimilated in the mentioned reanalysis sets. The coarse spatial resolution is one of the major disadvantages of the GOME data set, resulting in a significant amount of ground pixels identified as being affected by clouds and therefore having to be removed from
25
the analysis. However, with its now more than nine years record of data the instrument data set is well suited for the evaluation of model-parameters from transport models or even from general circulation model output, where usually monthly averaged quantities of more than six to seven years are required for meaningful climatological comparisons
ACPD
4, 7917–7984, 2004 Hydrological cycle of MATCH R. Lang and M. G. Lawrence Title Page Abstract Introduction Conclusions References Tables Figures J I J I Back CloseFull Screen / Esc
Print Version Interactive Discussion
EGU
with measured data. 2.2. GOME cloud mask
The quality of the detection of clouds within the observed slant path is a crucial cri-terium for the quality of tropospheric retrievals from instruments measuring in the vis-ible and infrared region. Clouds may alter the retrieved total column results in two
5
ways: either by blocking the light from travelling through the lower regions of the atmo-sphere leading, in case of WV, to a reduced total column retrieval, or by increasing the path length due to multiple scattering inside or at the cloud edges, which may in con-trast lead to an increased column retrieval depending on cloud height and geometry. Advanced cloud detection schemes of nadir viewing instruments delivering
informa-10
tion about cloud top height and cloud fraction (fraction of the ground pixel covered by clouds) may also be used to deliver some profile information about the atmospheric species under study (Albert et al., 2001). Here, we focus on the accuracy of the to-tal column value and therefore the accuracy of the derived cloud mask removing pixels from the analysis, where the occurrence of clouds leads to a deviation of retrieved WVC
15
value from the real one. Figure1shows the atmospheric reflectivity spectrum between 565 and 600 nm as seen by GOME. Besides the two absorption features of the 5ν-polyad WV overtone band around 570 and 592 nm also the broad absorption feature by the oxygen collision complex (O2)2 with a maximum absorption around 577 nm is clearly visible. This feature is used for each retrieval to evaluate the averaged
tra-20
versed air-mass by all photons detected for an individual GOME pixel scan (Pfeilsticker
et al.,1997;Wagner et al.,2003). The retrieval algorithm employs pressure and tem-perature profiles from the Neutral Atmosphere Empirical Model NRLMSISE-00 (Picone
et al.,2002) for altitude-layer dependent calculations of cross-sections, the calculation of Rayleigh single scattering albedo and the calculation of geometrical air-mass
fac-25
tors depending on the measurement geometry. Pressure dependent cross-sections for (O2)2 are provided by (Naus and Ubachs, 1999). From the relation between the geometrical air-mass factor and the observed one, as derived from the (O2)2
absorp-ACPD
4, 7917–7984, 2004 Hydrological cycle of MATCH R. Lang and M. G. Lawrence Title Page Abstract Introduction Conclusions References Tables Figures J I J I Back CloseFull Screen / Esc
Print Version Interactive Discussion
EGU
tion, a pixel averaged cloud top pressure can be derived, which is used here as the primary cloud detection criterium (SSP-(O2)2 retrieval scheme). Two additional sec-ondary criteria are used in order to decide if a pixel is marked as cloud covered as opposed to cloud free. One is a ground-pixel-averaged albedo value larger than 0.1, spectrally averaged between 560 and 600 nm and the second is a flat or decreasing
5
spectral dependency of the albedo with respect to wavelength. The latter criterium dis-tinguishes desert pixels with bright surfaces and increasing albedo (with wavelength) in this specific region of the spectrum (Koelemeijer et al.,1997) from white or grey cloud surfaces. In cases where the primary air-mass factor derives a pixel averaged cloud top-height of 500 m above the ground and the two secondary criteria are satisfied, the
10
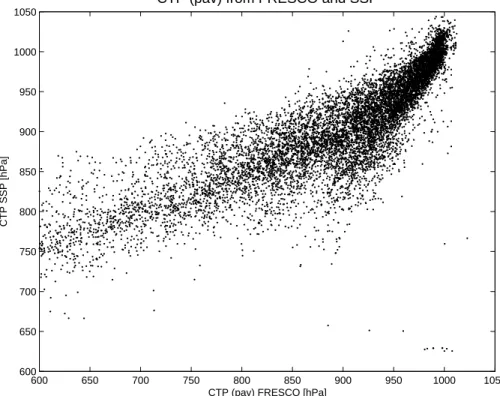
ground pixel is marked as affected by clouds and removed from the retrieval results. We evaluate the performance of this cloud masking scheme by comparison with corresponding cloud masks and cloud top pressures as derived from the Fast Re-trieval Scheme for Cloud from the Oxygen A-band (FRESCO)(Koelemeijer et al.,2001). FRESCO is based on non-linear least squares fitting of the GOME reflectivity
mea-15
sured around the oxygen A-band (758–778) in order to derive cloud top pressures and cloud fraction from the GOME instrument. The cloud albedo is fixed to 0.8 re-sembling an optically thick cloud. FRESCO derived CTP and cloud fraction should therefore be seen as effective numbers. Comparisons between FRESCO and inde-pendent satellite cloud products like monthly averaged values from the International
20
Satellite Cloud Climatology Project (ISCCP)(Rossow and Schiffer,1991) reveal a bias in the FRESCO derived CTP of around 50 hPa lower cloud tops and with comparable standard deviation, which has been identified as a result of neglecting the absorp-tion of oxygen within and below the cloud. FRESCO has already successfully been used in a number of applications retrieving tropospheric constituents from GOME and
25
tested in additional inter-comparison studies confirming largely the above cited results
(Tuinder et al., 2004). FRESCO data from GOME is generated and provided by the
SCIAMACHY data center (http://neonet.knmi.nl/neoaf/).
ACPD
4, 7917–7984, 2004 Hydrological cycle of MATCH R. Lang and M. G. Lawrence Title Page Abstract Introduction Conclusions References Tables Figures J I J I Back CloseFull Screen / Esc
Print Version Interactive Discussion
EGU
retrieval scheme. FRESCO CTP values are weighted by the FRESCO cloud-fraction in order to provide comparable ground-pixel averaged CTP values. The figure indicates a good correlation between both retrieval schemes, although FRESCO sees on average higher clouds than SSP-(O2)2. However, for the construction of an operational cloud mask, as required here, it is necessary to introduce an empirical limit in cloud fraction
5
or cloud top height, which has been evaluated to affect the retrieved column quantities only to an extent below or of the order of other quantified retrieval errors. From previous studies, we evaluated the influence of a 15% cloud cover on the retrieved column to be on average below other retrieval biases (Lang et al., 2003). Figure 3 compares the cloud mask derived from FRESCO on 1 August 1998, applying a 15% cloud cover
10
fraction limit, with the cloud mask derived from SSP-(O2)2. For the SSP-(O2)2 applied limits laid out above, both cloud mask retrievals compare very well except for desert regions, where FRESCO is known to deliver significantly larger cloud fraction values as observed from other cloud-retrieval schemes (Grzegorski,2003). In contrast, SSP-(O2)2observes the Saharan region, together with the Near East and the Gobi desert,
15
as expected as being predominantly cloud free. 2.3. SSM/I
The Special Sensor Microwave/Imager (SSM/I) (Hollinger et al.,1990) has been in orbit since 1987 on various platforms, predominantly of the Defense Meteorological Space Programs (DMSP) F-platform series. For the purpose of this study we use data from the
20
F-13 and F-14 platforms in an near circular, sun-synchronous, and near-polar orbit with an inclination of 98.8◦ at an altitude of about 850 km and an orbital period of 102 min. F-13 and F-14 were launched in 24 March 1995 and 4 April 1997 and cross the equa-tor at 06:15 and 08:20 local time, respectively. SSM/I data from these platforms can be correlated with GOME data within 4 and 2 h (ERS-2 equator crossing at 10:30 LT).
25
The SSM/I is a seven-channel radiometer operating on vertical and horizontal polar-ization at 19.35, 37.0, 85.5 and 22.235 GHz. The total swath width is 1400 km with a ground-pixel spacing of 25 km for the lower (19 to 37 GHz) and 12.5 km for the high
fre-ACPD
4, 7917–7984, 2004 Hydrological cycle of MATCH R. Lang and M. G. Lawrence Title Page Abstract Introduction Conclusions References Tables Figures J I J I Back CloseFull Screen / Esc
Print Version Interactive Discussion
EGU
quency (85 GHz) channel. The measured brightness temperature depends on surface temperature (TS), effective atmospheric temperature (TE), near surface wind speed (W), near-surface wind direction (Φ), WVC, liquid water content (L) and atmospheric pressure (P). The algorithm used for operational retrievals from SSM/I has been de-veloped byWentz(1997). Parameters retrieved are W, WVC and L. The dependence
5
on TS is considered to be weak above ocean surfaces for which climatological input data is used to account, for example, for ENSO. Therefore the retrievals are restricted to ocean surfaces only. TE is specified from an empirical correlation with V and TS derived from radiosonde observations and W andΦ are dependent parameters. The rms accuracy of the modelled brightness temperature is estimated to be between 0.5
10
and 1 K and the rms on the retrieved WVC is estimated to be 0.12 cm with an bias of 0.6 mm. From a detailed analysis of SSM/I averaging kernels and response functions,
Engelen and Stephens (1999) reveal that SSM/I is especially sensitive to the lower
troposphere over ocean surfaces, which is important for the quality of the total column WV product. SSM/I retrievals are not affected by clouds except those with heavy
pre-15
cipitation events. SSM/I data quality can, however, be affected by small islands within the range of the observed ground pixel and are significantly affected by ice-cover. In the operational product both instances are usually masked out, however, strong devi-ations from correlated measurements are nevertheless reported, for example, at high altitudes, which are attributed to impact of ice-shields on the retrievals (No ¨el et al.,
20
2004).
DMSP SSM/I data has been assimilated in the most recent ECMWF reanalysis data set (ERA-40) for the period between 1987 until 2001 (G ´erard and Saunders, 1999). Previous data sets, like ERA-15, were relying on data from the TIROS Operational Vertical Sounder (TOVS). It is important to note for the purpose of this paper that
25
temperature values from the latter instrument have also been assimilated in the NCEP reanalysis data-set (NRA) except for regions between 20 north and 20 south due to rain contamination (Kistler et al.,2001). For the NRA data set no attempts have been made so far to assimilate products from the SSM/I instrument series.
ACPD
4, 7917–7984, 2004 Hydrological cycle of MATCH R. Lang and M. G. Lawrence Title Page Abstract Introduction Conclusions References Tables Figures J I J I Back CloseFull Screen / Esc
Print Version Interactive Discussion
EGU
2.4. NVAP
The NASA water VApor Project (NVAP) (Randel et al.,1996) is an effort to blend var-ious WV products from ground based radio-stations with satellite based observations. A first data set was constructed for the years 1988–1992 on a 1 by 1◦ spatial res-olution and has been extended in recent years until 1999, comprising observations
5
from TOVS and SSM/I. NVAP provides 3 atmospheric layers of WV content until 1994 adding a 4th layer in 1995. Recently the Next Generation data set called NVAP-NG has been provided (http://eosweb.larc.nasa.gov/PRODOCS/nvap/table nvap.html) us-ing an improved SSM/I antenna pattern correction, an optimal estimation assimilation scheme for data from the Advanced Microwave Scanning Unit (AMSU-B) and SSM/T2
10
(Special Sensor Microwave Temperature-2), as well as adding Tropical Rainfall Mea-suring Mission (TRMM) Microwave Imager (TMI) and Advanced TOVS (ATOVS) WVC values to the data set. For NVAP-NG also the resolution has been improved to half a degree horizontally and 5 layers in the vertical (Vonder Haar et al.,2003).
NVAP therefore provides a so far unique global WV data set where different
instru-15
ments are combined according to their strengths and limitations.Simpson et al.(2001) compared the NVAP data from 1988 to 1995 to TOPEX/POSEIDON microwave ra-diometer WVC retrievals (TMW) and ECMWF reanalysis fields. They found that NVAP was drier than TMW, which was in turn drier than ECMWF fields. It was determined that NVAP has sufficient relative accuracy for variability studies, although its absolute
20
accuracy is uncertain.Engelen and Stephens(1999) found in their study of the detailed response functions of SSM/I and TOVS that TOVS is sensitive to the middle and upper part of the troposphere but relies, for the lower troposphere, heavily on a priori infor-mation. Due to this known problem in the quality of total column TOVS data (Stephens
et al.,1994) TOVS is weighted low as compared to SSM/I and radiosonde data in the
25
NVAP blending procedure. Significant TOVS contributions to the global data set can be expected over remote land region where no high quality radiosonde data is available (e.g. Africa and the tropical South America). However, comparisons between models
ACPD
4, 7917–7984, 2004 Hydrological cycle of MATCH R. Lang and M. G. Lawrence Title Page Abstract Introduction Conclusions References Tables Figures J I J I Back CloseFull Screen / Esc
Print Version Interactive Discussion
EGU
driven by reanalysis data as well as reanalysis data sets themselves and NVAP are not independent because most of the data sets employed in NVAP (SSM/I, TOVS and radiosondes) are also used for the reanalysis products of NCEP and ECMWF.
3. Precipitation measurements
The Global Precipitation Climatology Project (GPCP) provides global gridded
precipi-5
tation estimates from raingauge and satellite observations on a 2.5 by 2.5◦ horizontal grid (GPCP-V1)(Huffman et al.,1997;Rudolf,2001). The data set comprises data from geostationary and polar-orbiting satellite infrared histograms for convective precipita-tion between 40◦ north and 40◦ south, SSM/I 19 GHz radiances for large-sacle frontal precipitation over the ocean, SSM/I 85 GHz radiances for large-scale precipitation in
10
the extra-tropical land and ocean region, estimates from TOVS at high latitudes and from a gridded analysis of raingauge stations from about 7000 geolocations over land surfaces. Data is available starting from 1979 and is updated on a near real time basis. The general GPCP blending approach for the data is the use of preferences for the regionally best data sources, no use of data believed to be unreliable, the stepwise
15
adaption of estimates of low quality to the more reliable ones, and the use of corrected raingauge measurements (Huffman et al.,1995). Recently the improved fully global combined product (GPCP-V2) has been published (Huffman et al.,2001;Adler et al.,
2003). The data-set archive also contains the individual input fields, a combined satel-lite estimate, and error estimates for each field.
20
GPCP precipitation amounts have been compared to the NCEP-NCAR Climate Pre-diction Center Merged Analysis of Precipitation (CMAP) (Xie and Arkin,1997) in vari-ous studies (Gruber et al.,2000;Rudolf,2001). It has to be noted that CMAP is not a completely independent source from the GPCP data-set as it relies also on SSM/I data and uses the gauge-network provided by GPCP. In addition CMAP uses also data from
25
the MSU instrument, which has been adjusted to gauge data from island and coastal stations. Both data-sets, CMAP and GPCP, are frequently used and available online.
ACPD
4, 7917–7984, 2004 Hydrological cycle of MATCH R. Lang and M. G. Lawrence Title Page Abstract Introduction Conclusions References Tables Figures J I J I Back CloseFull Screen / Esc
Print Version Interactive Discussion
EGU
Differences between the two data sets can be as large as 6.5 mm per day, where GPCP shows more precipitation over high latitude oceans, and less for Indonesia and the trop-ical Pacific for a case study based on monthly averaged data of January 1999 (Rudolf,
2001).
4. The NCEP reanalysis data sets
5
The NCEP reanalysis (NRA) system described in detail byKalnay et al.(1996) employs the NCEP global spectral model with 28 sigma vertical levels and a horizontal triangu-lar truncation of 62 nodes, which relates to about 200 km. A 3-dimensional variational (3-D-Var) scheme for assimilation of observational data is employed in spectral space using the 6-h forecast results of the model as the initial guess values. This also means
10
that in regions with little data for ’adjustment’ the analysis can be heavily influenced by the model. Using different model versions in the standard analysis system can there-fore lead to significant changes in the results and artificial climate jumps. To prevent this, NRA uses the forecast model operational in 1995 for their most recent reanalysis system. The reanalysis is reported to be essentially free of the inhomogeneities due to
15
changes in model resolution and physics (Kistler et al.,2001).
NRA uses data from upper air rawinsonde observations of temperature, horizontal wind, and specific humidity, from TOVS vertical temperature soundings over ocean ex-cept between 20 north and 20 south due to rain contamination, and TOVS temperature soundings over land above 100 hPa. Cloud tracked winds are incorporated from
geo-20
stationary satellites, together with aircraft observations of wind and temperature, land surface reports of surface pressure, and oceanic reports of surface pressure, temper-ature, horizontal wind and specific humidity (for details on the individual data set see
Kistler et al.,2001). For the focus period of this paper starting 1995, all of the named
observation sources had been available.
25
A large set of output parameters are delivered by the reanalysis, a good fraction of which has been calculated online (model predicted) and have not been based on
ACPD
4, 7917–7984, 2004 Hydrological cycle of MATCH R. Lang and M. G. Lawrence Title Page Abstract Introduction Conclusions References Tables Figures J I J I Back CloseFull Screen / Esc
Print Version Interactive Discussion
EGU
observational data directly and are labelled “C” variables (here we adapt the notation
byKistler et al.,2001). Others rely to a significant portion on the initial guess forecast
values and are labelled with “B”. Those which are dominated by the observations are labelled “A”. “A” variables are for example upper air temperature and wind fields, whereas all moisture variables and those near the surface are usually labelled “B”.
5
Evaporation and precipitation are “C” variables.
For the purpose of the study presented here, the focus is on those parameters of the hydrological cycle evaluated for both the NRA and MATCH model output, like WV, and precipitation. Even though the long term dynamics of the hydrological parameters in the reanalysis data is an important and interesting subject for climate studies, like,
10
for example, the steadily growing stronger hydrological cycle since 1991, here we are focusing on the consistency between the various parameters of the hydrological cycle in the individual models and with respect to observations. For a detailed discussion of the long term trends we refer toKistler et al.(2001).
NRA reanalysis output has also been compared to reanalysis values from the
15
ECMWF 0 to 6 and 12 to 24 h forecast models (ERA-06 and ERA-24) (Stendel and
Arpe,1997). Stendel and Arpe (1997) showed that the global hydrological cycle and surface energy budget are in better balance in the 12–24 h ERA forecasts than in the 0–6 h ERA forecasts. ERA global latent heat fluxes are about 10% higher than those by NRA and therefore compare better with the corrected observations byDa Silva et al. 20
(1994). They also compared NRA precipitation data with data from the GPCP climatol-ogy. Over land all reanalysis results exceed the independent estimates in the tropics, while NRA has the most precipitation near 60◦ north. NRA has too much precipitation over Russia and Canada in summer (Janowiak et al., 1998). Over the ocean ERA clearly has the most rainfall in the tropics, where the GPCP and CMAP disagree with
25
each other by as much as one mm per day. In the mid-latitude oceanic storm tracks both GPCP and CMAP estimates exceed the NRA and ERA precipitation amounts. NRA shows a strong correlation of precipitation with tropical air-sea temperature di ffer-ences and to a significantly lesser extent with sea surface temperatures (SST).
ACPD
4, 7917–7984, 2004 Hydrological cycle of MATCH R. Lang and M. G. Lawrence Title Page Abstract Introduction Conclusions References Tables Figures J I J I Back CloseFull Screen / Esc
Print Version Interactive Discussion
EGU
Moisture is a generally poorly measured variable in comparison to winds and tem-perature and is therefore a prototypical “B” variable. To the best of our knowledge little has been done so far to evaluate the water vapor fields of reanalysis model output with independent sources. This may be partly due to the lack of WV measurements on global scale which are not already assimilated in the NRA or ERA model. Kistler et al. 5
(2001) report that a comparison of relative humidity between NRA and ERA shows qualitative good agreement with, however, systematic differences in relative humidity of the order of 10%. These are large differences when compared to the interannual variability.
5. MATCH
10
The Model of Atmospheric Transport and Chemistry (MATCH) is an “semi-online” model, where the most basic meteorological parameters, apart from those of the hy-drological cycle, come from weather center analysis or reanalysis data. The model has been described in detail byRasch et al.(1997);Mahowald et al.(1997a,b);Lawrence
et al. (1999). Here we use temperature, pressure, horizontal winds, surface wind
15
stresses, latent and sensible heat flux from NRA, described before, for model cal-culations of the months January and August between 1996 and 1998. The runs are performed at a horizontal resolution of T63 (96 by 192 latitude-longitude grid) cor-responding to the resolution of the NRA input fields provided by NCAR. The terrain following 28 vertical sigma layers employed by NRA have been adopted. The
mete-20
orological data is read in every 6 h and is linearly interpolated to model time steps in between. The model includes representations of resolved scale transport, convective transport, boundary layer transport, and scavenging and deposition of soluble gases and aerosols (Lawrence,1996;Lawrence et al.,1999;von Kuhlmann et al.,2003a). In contrast to other CTMs, MATCH has the capability of simulating online all cloud
pro-25
cesses such as cloud water and ice content, cloud fraction, fraction of water converted to rain and snow as well as evaporation of hydrometeors. Using the evapotranspiration
ACPD
4, 7917–7984, 2004 Hydrological cycle of MATCH R. Lang and M. G. Lawrence Title Page Abstract Introduction Conclusions References Tables Figures J I J I Back CloseFull Screen / Esc
Print Version Interactive Discussion
EGU
at the surfaces from NRA, MATCH then calculates the full tropospheric hydrological cycle online. All these processes can therefore consistently be used in the aforemen-tioned model processes. In diagnosed mode, calculating the full hydrological cycle, the model runs approximately 4 times faster than the Commmunity Climate Model (CCM) of NCAR (Rasch et al.,1997).
5
For resolved transport of cloud water the model uses the flux-form semi-Lagrangian scheme called SPITFIRE (Rasch and Lawrence, 1998) with a correction for the surface-pressure mismatch between interpolated input and model data (for details, see
J ¨ockel et al.,2001;von Kuhlmann et al.,2003a). For the parameterization of moist
con-vection MATCH uses two schemes successively. First, the deep penetrative
convec-10
tion scheme byZhang and McFarlane (1995) is applied reducing convective available potential energy (CAPE) within the total column from the surface to the upper tropo-sphere. Then, a local convective transport scheme byHack(1994) is used to remove all remaining instabilities representing shallow convection and mid-level convection not originating in the boundary layer. The sensitivity of MATCH to the NRA input data and
15
the convection parameterization employed is described in Mahowald et al. (1997a,b). The parameterization of cloud microphysics in MATCH follows the parameterization developed byRasch and Kristj ´ansson(1998). The cloud fraction parameterization de-pends on relative humidity, vertical motion, static stability, and convective properties and is based on the work bySlingo(1987). The convective cloud fraction is also
pro-20
portional to the rate at which mass is detrained from the parameterized convective updrafts above 500 mb, and to the convective mass flux for the updraft core cloud frac-tions. Clouds are permitted at all tropospheric layers. The total mass of condensate within each gridbox is predicted for both liquid and ice clouds and the conversion from condensate to precipitation uses a bulk microphysical model. Precipitation values are
25
then in turn used to drive wet scavenging of soluble gases and aerosols. The scaveng-ing parameterization has been developed and tested inLawrence and Crutzen(1998);
Lawrence et al.(1999);Crutzen and Lawrence(2000).
ACPD
4, 7917–7984, 2004 Hydrological cycle of MATCH R. Lang and M. G. Lawrence Title Page Abstract Introduction Conclusions References Tables Figures J I J I Back CloseFull Screen / Esc
Print Version Interactive Discussion
EGU
of other GCMs or CTMs, and the distribution of precipitation and WV with respect to measurements using meteorological reanalysis input fields has not previously been carried out.
6. Results
In this section the key results of the comparisons between modelled WV and
precipita-5
tion fields and measurements are presented, followed by a discussion of the implication of these results in Sect.7.
6.1. GOME WV fields
Figure4 shows the comparison between GOME WVC and radiosonde data from the operational weather center sonde network provided by ECMWF. The scatter plots
com-10
pares data from August and January between 1996 and 2000. The data is taken from launch sites located within the area covered by one GOME ground pixel and with a temporal correlation of less than three hours and cloud covers below 15%. Tempo-ral and spatial cloud-free correlations have predominantly been found over Indonesia and Europe with some additional stations over North America. The significant scatter
15
of 0.4 cm is likely to a large part related to the problem in correlating a single sonde measurement to the large area of 40 by 320 km covered by the GOME instrument. In addition, the quality of the sonde data can vary significantly depending on the type of instruments used, on-site monitoring of measurements and the post measurement quality check of the data. Here, only data with more than four measurements per launch
20
have been used. Apart from removing data with physically unrealistic numbers, no ad-ditional quality assurance techniques have been applied, which may cause a number of measurements to deviate significantly from the GOME measurements. However, quality assurance of radiosonde data is a very complex and difficult task required for climate change monitoring (Lanzante at al, 2003) but of less importance for relative
ACPD
4, 7917–7984, 2004 Hydrological cycle of MATCH R. Lang and M. G. Lawrence Title Page Abstract Introduction Conclusions References Tables Figures J I J I Back CloseFull Screen / Esc
Print Version Interactive Discussion
EGU
short time scale comparisons. The bias of the correlation is found to be below 2.5% with a correlation of 70%, both supporting the high credibility of GOME data over land surfaces.
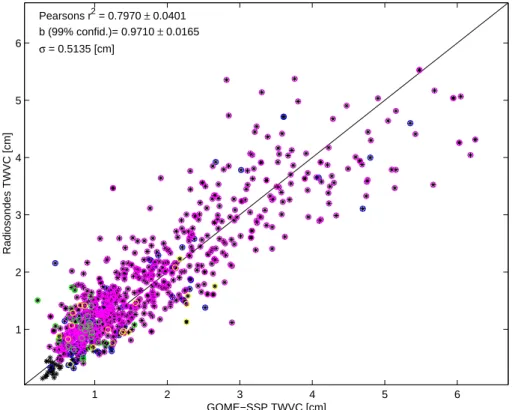
Over ocean surfaces we compare GOME WVC data with spatially correlated grid-ded (0.5 by 0.5◦) SSM/I data from SSM/I descending orbits of the F13 and F14 DMSP
5
satellite platforms (see Sect.2.3). Figure5 shows the correlation for August 1996 to 2000 and January 1996 to 2000 (excluding January 1999 because of an instrumen-tal problem of GOME affecting the employed spectral region of the WV absorption) with a standard deviations smaller than 0.5 cm, which we attribute to the significant differences between the instruments’ spatial resolution (25 km resolution for SSM/I as
10
opposed to 40 by 320 km resolution for GOME) and the reduced sensitivity over ocean surfaces for the GOME instrument as compared to land surfaces. The bias of this comparison is smaller than 1%. This demonstrates the capability of GOME to achieve good accuracy in WVC also over ocean surfaces, however, associated with an aver-aged increase in the retrieval error due to the low reflectivity of the ocean surface and
15
therefore an increased contribution of photons scattering above the surface.
Figure6shows the global distribution of the monthly mean retrieval error for August and January 1996 to 1998 as provided by the distribution matrix of the individual re-trievals and consisting of an estimate of the model-parameter error, the forward-model error and the retrieval noise contributions (for details on the error analysis, the
im-20
pact of multiple scattering and aerosol loading on the retrieval, we refer toLang et al.,
2003). The forward model error contribution contains the impact of aerosol scattering and absorption on the retrieval for two reference maritime and rural aerosol scenarios employed in dependence of the observed geolocation. The error values delivered by the retrieval are therefore good estimates of an upper error bound. This is due to the
25
fact that, especially for the rural aerosol case, the employed scenarios are more an exception than a standard. The figure shows that the error is smallest (below 0.1 cm) in the subsidence regions with relatively large WV content and little cloud cover, i.e., good statistics. For the strongest WV signals along the Inter Tropical Convergence
ACPD
4, 7917–7984, 2004 Hydrological cycle of MATCH R. Lang and M. G. Lawrence Title Page Abstract Introduction Conclusions References Tables Figures J I J I Back CloseFull Screen / Esc
Print Version Interactive Discussion
EGU
Zone (ITCZ) but small number of measurements the error is around 0.25 cm. The er-ror is largest (up to 0.5 cm) at high latitudes, where the WV absorption signal is weak both due to the low WV content (nearly three orders of magnitude lower at the poles as compared to the ITCZ) and due to large solar zenith angles (SZA). Large SZA cor-respond to large air masses traversed by the detected photons, which in turn lead to
5
high contributions of multiple scattering out and into the light path, which is not explic-itly accounted for by the retrieval model. Therefore we generally restrict the retrieval to latitudes within 70 to 80◦ of the equator. The number of measurements averaged over one month (three years) varies between 2 to 5 (6 to 15) measurements along the ITCZ and up to 15 (45) for the highest latitudes. The higher retrieval errors at high
lati-10
tudes are partially compensated in the multi-year average by the better statistics in this regions due to overlapping satellite passes. The relative error varies between below 5% along the ITCZ and the subsidence region, 25% between 50 to 60◦ and 100% and more around 70◦and above for the hemispheric winter. In the hemispheric summer the relative error at 70 degrees is around 25 to 50%.
15
Figure 7 shows monthly mean WVC values from GOME and NVAP together with their residual for August 1998. The general WV distribution pattern compares very well up to very small details. However, the difference plot (lower panel of Fig.7) also clearly identifies regions with systematic differences in the distribution pattern. NVAP is significantly moist over mountain areas like the Andes and the Rocky Mountains,
20
the Kongo basin in Central Africa, over Greenland and the Himalaya. GOME-SSP retrieves systematically lower values over the Amazon and much higher over the Sahel zone region. It also exhibits a moist bias over NH land masses when compared to NVAP for this time of the year.
Figure 8 presents the three-year average residuals for NVAP and SSM/I monthly
25
mean values when compared to GOME-SSP retrievals. As compared to the single year results of Fig.7some of the patterns are significantly reduced, like the moist NVAP bias over Greenland, though most of the other features examined before, remain to be significant. Over ocean the three-year average residuals for the two reference data
ACPD
4, 7917–7984, 2004 Hydrological cycle of MATCH R. Lang and M. G. Lawrence Title Page Abstract Introduction Conclusions References Tables Figures J I J I Back CloseFull Screen / Esc
Print Version Interactive Discussion
EGU
sets SSM/I and NVAP look quite similar because NVAP relies predominantly on SSM/I data over ocean surfaces.
The impact of mountain areas on the total retrieved WVC is much stronger in the case of GOME observations than for the NVAP WVC product. Especially for strong transitions between low and high surfaces (like for the Andes) the relatively coarse
5
resolution of the standard NVAP product smears out the WV distribution significantly. The generally high WVC content over the eastern equatorial Pacific is extended into Central South America for both products (even though weaker on the land side for GOME-SSP) but is significantly more disturbed by the mountain chains in the case of GOME-SSP. In contrast GOME-SSP WVC values seem to be unreasonably low
10
over the Central Amazon region and too high over the Sahel region. The latter is due to the strong impact of sand storms and aerosol content in this part of Africa during this month, while the former is presumably due to an impact of the surface albedo on the retrieval in this specific area, which will be discussed in Sect.7. GOME-SSP also exhibits a number of dry spots along the ITCZ and the Pacific warm pool regions, which
15
are not visible in the NVAP product, most of which can be attributed to unsatisfactory removal of clouds and low measurement statistics as they are also visible in the three years averaged comparisons with SSM/I data.
6.2. Comparison to model results
Monthly averaged WVC distributions for August and January 1996 to 1998 have been
20
modelled employing the MATCH CTM with driving meteorological input parameters from NRA, as has been described in Sects.4 and 5 of this paper. MATCH data has been written out at 10:30 local time to achieve maximum temporal overlap with GOME data. For comparisons between model and measurements we will first compare the model results with the observations on a global scale including globally and zonally
av-25
eraged comparisons and then focus on regional scales with two exemplifying regions, Europe and the Southern Asian/Indian Ocean region.
ACPD
4, 7917–7984, 2004 Hydrological cycle of MATCH R. Lang and M. G. Lawrence Title Page Abstract Introduction Conclusions References Tables Figures J I J I Back CloseFull Screen / Esc
Print Version Interactive Discussion
EGU
modelled by MATCH and NRA and as measured by GOME-SSP in January and Au-gust 1998 (Figs.9and12), as well as for the three years average from 1996 to 1998 for both months (Figs.10to12). It is very important to emphasize that for all comparisons presented here the cloud-mask derived from the GOME-SSP retrievals has also been applied to the model values, including the zonally and globally averaged results. This
5
has consequences for the accuracy of the presented absolute values. First, applying a cloud mask generally reduces the modelled mean WVC values by about 0.5 cm (10 to 15%) on a global average, as estimated from comparisons between the modelled values with and without the GOME cloud mask applied (see Table1). Second, it also influences the relative comparison between observation and model results because of
10
an effect we hereafter will refer to as the “common-cloud-problem”. Table 1 denotes an “artificial” model moistening effect by applying only the GOME cloud mask to the model. This is because pixels with cloud contamination are usually corresponding to high WVC amounts “relative” to surrounding clear-sky pixels. However, ground pix-els identified as cloudy by the GOME measurement do not necessarily correspond to
15
cloudy model pixels. As a consequence of applying only the measured GOME cloud mask to the model, this will generally lead to moister model results as compared to the measurement clear-sky scenario because the GOME cloud-mask will partly masked out model clear-sky pixel and leave cloudy model pixels (with relative high WVC) in the analysis. The impact of the “common-cloud-problem” on the comparisons is shown
20
by the results in Table 1 and can be quantified as an effect of about 0.3 cm (10%) when compared to applying only the GOME cloud mask to the model results. Table1
also shows that for instances of hemispheric winter cloud masking may lead to an even higher hemispheric mean value as compared to the unmasked means. This is because high latitudes with very low WVC (especially for hemispheric winter) see more cloud
25
cover and are therefore masked out applying the GOME cloud mask. This effect is, however, small for the global mean values and for hemispheric summer.
Figures9to11show, that MATCH generally models the global WV distribution quite well, from the moist ITCZ regions to the dry polar regions. MATCH also resembles
ACPD
4, 7917–7984, 2004 Hydrological cycle of MATCH R. Lang and M. G. Lawrence Title Page Abstract Introduction Conclusions References Tables Figures J I J I Back CloseFull Screen / Esc
Print Version Interactive Discussion
EGU
the overall shape of the moist and convective regions. However, significant differences between MATCH and GOME-SSP exist on regional scales and in the magnitude of the WVC distribution. MATCH is systematically lower than what has been observed over the Atlantic ITCZ and in the Pacific warm-pool region for both seasons (Figs.9and10) and the moist areas commonly extend more to the north and to the south. The most
5
pronounced features evident occur in the Western Pacific convergence zone. Here, MATCH significantly overestimates the southern branch of the Western Pacific split ITCZ in August and exhibits a too broad and moist feature in January in the same region, when compared to GOME measurements. These features become less pro-nounced when comparing to the three years averages including also the non-ENSO
10
year 1996 (Fig. 10). GOME-SSP is generally drier than MATCH over the northern hemisphere (NH) landmasses of Canada, as well as wide parts of Russia and the southern hemisphere (SH) oceans for August (Figs.9and 10). However, this conclu-sion also holds for the comparison between GOME-SSP and NVAP in Fig.8and may therefore additionally point to a low WVC bias of the GOME data in this region. We will
15
discuss these features in detail in the following section. The low bias of GOME-SSP over the SH oceans as observed before in the intercomparisons to NVAP and SSM/I values (Fig.8) is also visible for the MATCH comparisons. For January, Figs. 9 and
10 show that MATCH is generally high as compared to GOME-SSP for NH oceans, whereas MATCH agrees generally quite well with what is observed by GOME over
20
land, except for Central Africa and the aforementioned Central Amazon region, where GOME-SSP is drier than MATCH output.
The global WV distribution as given by NRA (Fig.11) generally resembles what has been modelled by MATCH. The shape of the ITCZ is quite similar to the MATCH model results for both seasons. For example, the strong southern branch of the Western
25
Pacific split ITCZ and the high WV values over NH land masses are similar features leading to similar residual patterns for NRA and MATCH when compared to the GOME-SSP results. NRA ITCZ values are, however, generally higher than those computed by MATCH. Differences are evident for the Central Amazon and Western Pacific regions,
ACPD
4, 7917–7984, 2004 Hydrological cycle of MATCH R. Lang and M. G. Lawrence Title Page Abstract Introduction Conclusions References Tables Figures J I J I Back CloseFull Screen / Esc
Print Version Interactive Discussion
EGU
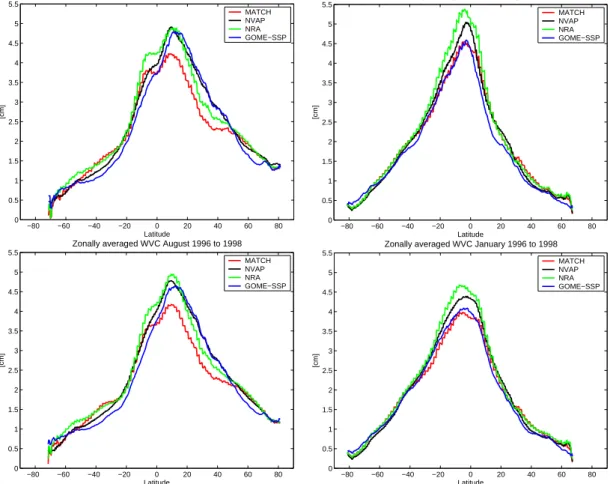
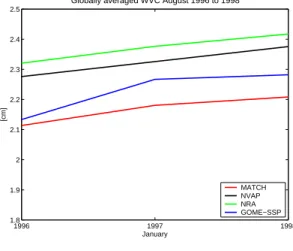
where MATCH is moist over the ocean and dry over land when compared to NRA. MATCH is about 0.1 to 0.3 cm lower in the globally averaged WV content as GOME-SSP, NVAP and NRA for August and compares well with GOME-SSP (within 0.1 cm difference) and NVAP for January as indicated by the lower panels of Fig. 12. For January, the shape of the zonal distribution of all four products compares very well,
5
however, NVAP and NRA peak significantly higher around the ITCZ than GOME-SSP and MATCH. A different picture occurs for the August zonal mean distributions. Here, NVAP, and GOME-SSP compare very well in shape and absolute quantities. MATCH is systematically low for the season with high WV content in the NH and around the ITCZ, but the shape of the zonal WV distribution of MATCH again resembles quite well
10
the shape of the NRA zonally averaged values.
Figure 13(upper panels) shows averaged daily PR as given by GPCP (cf. Sect. 3) for August (left panels) and January (right panels) 1996 to 1998. The middle panels of Fig. 13 show the corresponding model results from MATCH. MATCH models the basic patterns very well, like the continuous stream of precipitation along 10◦north in
15
August and the more distinct precipitation fields over the south western Pacific, Central South America, Africa and the Pacific Warm Pool. Differences occur, similar to the WVC distributions, on regional scales and due to differences in the absolute values (lower panel of Fig.13). MATCH PR are weaker along the ITCZ and more spread out in latitude leading to significant residuals of high MATCH PR north and southwards
20
of the ITCZ (e.g., the overestimation in precipitation along the southern branch of the Western Pacific split ITCZ in August). MATCH models significantly higher PR over the Central South American and Central African land masses for January and over North America, Europe and Russia for August, as compared to what has been measured by the GPCP observations.
25
As MATCH is driven by NRA parameters like temperature, wind fields, and evapo-transpiration rates, with potentially significant influence on the modelled WV and pre-cipitation patterns, the comparisons presented in Fig.14 give an indication to which extent MATCH precipitation model output may depend on NRA input parameters. The
ACPD
4, 7917–7984, 2004 Hydrological cycle of MATCH R. Lang and M. G. Lawrence Title Page Abstract Introduction Conclusions References Tables Figures J I J I Back CloseFull Screen / Esc
Print Version Interactive Discussion
EGU
figure compares NRA PR to those given by GPCP in a similar fashion as the com-parisons presented in Fig.13. The NRA precipitation distribution is for large parts of the globe closely related to the MATCH modelled PR indicating the strong influence of the before mentioned shared parameters on the precipitation distributions modelled by both products. The residual patterns of Fig. 14, however, also reveal significant
5
regional differences to what has been modelled by MATCH. MATCH PR are gener-ally higher over NH land masses in August and over the Central Amazon and Central African regions for January. There are considerably less differences in the precipitation residuals for NRA and MATCH over ocean surfaces. Generally the residuals of Figs.13
and14differ predominantly in magnitude and less in shape and geolocation.
10
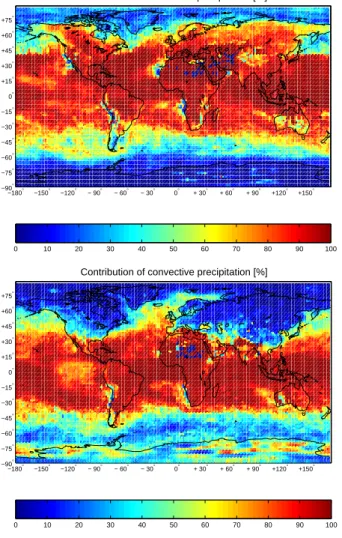
Figure 15 additionally provides the MATCH modelled contribution of convective to the total (large-scale plus convective) amount of precipitation, showing that seasonal changes in the residual patterns of Figs.13and 14are frequently related to changes in the relative contribution of convective precipitation. Generally, the large model to observation residuals correspond to the shift between north and south in the convective
15
precipitation for hemispheric summer.
Figures 16 and 17 provide a more detailed look at regional differences between model and measurements for Europe and the Indian Ocean/Southeast Asian region. Residuals between model and observations for WVC (upper panels) and PR (lower panels) distributions are given for the three-year averages of August 1996 to 1998, i.e.
20
for the summer season. MATCH and NRA show high atmospheric WV content over European land masses in August and low biases over the Mediterranean ocean and North Africa (Fig. 16). The close relation between NRA and MATCH WVC distribu-tion, as has been observed before for the global comparisons, is evident from Fig.16. MATCH is, however, generally drier than NRA but exhibits, in turn, higher PR. NRA and
25
MATCH show similar residual patterns in precipitation with an emphasize on regions with high elevations. The Indian Ocean/Southeast Asian region (Fig.17) exhibits sim-ilar relations between WV and precipitation residual patterns. Regions with relatively high WV content as compared to the GOME measurements, over land and south of
ACPD
4, 7917–7984, 2004 Hydrological cycle of MATCH R. Lang and M. G. Lawrence Title Page Abstract Introduction Conclusions References Tables Figures J I J I Back CloseFull Screen / Esc
Print Version Interactive Discussion
EGU
the Equator, correspond to regions with high PR when compared to the GPCP mea-surements and vice versa. A detailed discussion of the observed relation between WV and precipitation patterns is given in the following discussion section.
The comparisons presented here are finally summarized in Table2which presents the global and regional mean values in WVC content, PR and WV residence time. The
5
latter has been calculated as the ratio between WVC and PR and serves as an useful measure for the modelled and observed mean conversion of WV into precipitation, as discussed further in the following section.
7. Discussion
There are four immediate qualitative conclusions which can be drawn from the above
10
comparisons: First, GOME compares well to independent measurements of WVC by SSM/I over oceans and reasonably to measurements compiled by NVAP over land. Second, MATCH models the general global PR and atmospheric WV content quite well with a tendency to be on average drier than the observations and the reanalysis data. Third, the WV distribution patterns as modelled by MATCH are quite similar to those
15
given by NRA, whereas both MATCH and NRA exhibit significant regional differences to what has been observed by GOME. Fourth, the WVC residuals between MATCH and the GOME observations are for wide parts of the globe similar to residuals observed in the PR between MATCH model results and GPCP observations. These main points are discussed in detail in this section.
20
7.1. GOME observations
From comparisons between GOME WVC distributions and those given by other obser-vation products, like SSM/I and NVAP (Fig.8), GOME-SSP data quality over the Central Amazonian rain forest region and the African Sahel zone may be doubtful. Especially in the latter case, GOME exhibits some unusually high column values at around 15◦
ACPD
4, 7917–7984, 2004 Hydrological cycle of MATCH R. Lang and M. G. Lawrence Title Page Abstract Introduction Conclusions References Tables Figures J I J I Back CloseFull Screen / Esc
Print Version Interactive Discussion
EGU
north of the equator for August 1998, which might be related to the impact of Saharan dust and an increased contribution of multiple scattering, which is not accounted for by the retrieval method. Comparisons with radiosonde measurements (not shown) also reveal some extraordinary high GOME WVC measurements in this region. GOME-SSP WV columns are systematically lower than what has been observed by NVAP and what
5
is given by NRA over the Central Amazon and Central African region especially for the high WV content periods in January. Here, the surface albedo around the 590 nm re-trieval window is a matter of concern, because the rere-trieval assumes a linear behavior of the albedo over the spectral region applied, which is usually not the case for predom-inantly green surfaces in this region of the spectrum. However, NVAP and NRA both
10
rely predominantly on TOVS data over remote land regions and for the investigated periods, which is known, in turn, to heavily rely on a priori climatology information for the lower part of the atmosphere and therefore also for the total column values (cf.2.4
and references therein). The latter might also be the reason why NVAP and NRA ex-hibit high WVC when compared to GOME over various land surfaces, especially over
15
Canada, and wide parts of Russia (Siberia) and China in August.
The ITCZ land regions must be labelled to be the most critical for drawing ridged con-clusions from the presented comparisons. These regions are usually also very sparse in radiosonde measurements and data-quality for NVAP and NRA data is therefore low. In addition, regions of the ITCZ are predominantly covered by clouds, which leads
20
to an significantly reduced statistics and increased biases in the GOME data, as well as to an increased impact of residual cloud contamination on the retrieved WVC from GOME. Similar conclusions hold for GOME-SSP WVC measurements along the ITCZ over ocean surfaces. But, in this case and in contrast to land regions, the quality of GOME-SSP data can be estimated more rigorously by comparison to high quality
25
SSM/I measurements available for this region. GOME shows smaller averaged WVCs along the ITCZ as compared to SSM/I by up to 0.5 cm, for specific regions as much as 1 cm (e.g. the Pacific warm pool) on a three years average, and predominantly related to residual cloud contamination of the observed scene. However, due to the differences
ACPD
4, 7917–7984, 2004 Hydrological cycle of MATCH R. Lang and M. G. Lawrence Title Page Abstract Introduction Conclusions References Tables Figures J I J I Back CloseFull Screen / Esc
Print Version Interactive Discussion
EGU
in surface albedo between land and ocean surfaces, this result cannot be used as an estimate for GOME-SSP biases over ITCZ land regions. Cloud statistics and residual cloud contamination lead to significantly smaller zonally averaged GOME-SSP values around the ITCZ (up to 0.6 cm) as compared to NVAP and NRA. This effect is then consequently also visible in the globally averaged WVC values (Fig.12).
5
GOME-SSP tends to deliver smaller WVC as observed by NVAP and SSM/I for the SH oceans for August 1996 to 1998 and NH oceans in January (Fig.8). On a zonal average (Fig. 12) the effect is small for NH summer (less than 0.2 cm) but becomes significant for NH winter (more than 0.4 cm). This bias is probably due to the impact of hygroscopic aerosols (like, for example, sea salt), which grow significantly under low
10
relative humidity conditions forming haze and thin cloud layers. 7.2. Distribution of WV and precipitation
It is beyond the scope of this paper to analyze the detailed mechanisms behind the observed differences between MATCH and the observations but the results presented here encourage us to make those mechanisms subject of a follow-up study. Here,
15
we focus on the question: where are significant differences between MATCH and the observations found and which of those are unique to the MATCH model and therefore missing in a comparison between GOME-SSP data to NRA data. We call the observed differences significant for residual patterns, which are well outside the range of the 1-σ measurement and method of comparison related errors as discussed before (cf.
20
Sects.2.1to5, and Figs.5to8). GOME-SSP retrieval biases have been estimated to range between less than 0.1 cm (subsidence regions) and up to 0.6 cm (hemispheric oceans in winter and ITCZ region).
Along the ITCZ region MATCH is significantly drier than NRA, but exhibits generally very similar patterns with respect to the reanalysis values in the global WV distribution,
25
as well as in the latitudinal dependence of the zonally averaged values for both sea-sons. This is not surprising because MATCH and NRA share two of the most important parameters determining the amount of atmospheric WV content: temperature and the