HAL Id: hal-01288716
https://hal.sorbonne-universite.fr/hal-01288716
Submitted on 16 Mar 2016HAL is a multi-disciplinary open access
archive for the deposit and dissemination of sci-entific research documents, whether they are pub-lished or not. The documents may come from teaching and research institutions in France or abroad, or from public or private research centers.
L’archive ouverte pluridisciplinaire HAL, est destinée au dépôt et à la diffusion de documents scientifiques de niveau recherche, publiés ou non, émanant des établissements d’enseignement et de recherche français ou étrangers, des laboratoires publics ou privés.
Hepatitis B surface antigen quantification as a predictor
of seroclearance during treatment in HIV-hepatitis B
virus coinfected patients from Sub-Saharan Africa
Anders Boyd, Sarah Maylin, Raoul Moh, Nadia Mahjoub, Delphine Gabillard,
Serge Paul Eholié, Christine Danel, Xavier Anglaret, Fabien Zoulim,
Pierre-Marie Girard, et al.
To cite this version:
Anders Boyd, Sarah Maylin, Raoul Moh, Nadia Mahjoub, Delphine Gabillard, et al.. Hepatitis B surface antigen quantification as a predictor of seroclearance during treatment in HIV-hepatitis B virus coinfected patients from Sub-Saharan Africa. Journal of Gastroenterology and Hepatology, Wiley, 2016, 31 (3), pp.634-644. �10.1111/jgh.13156�. �hal-01288716�
1
Hepatitis B surface antigen quantification as a predictor of seroclearance during treatment in HIV-hepatitis B virus co-infected patients from Sub-Saharan Africa
Anders Boyd1, Sarah Maylin2,3,4,Raoul Moh5, Nadia Mahjoub2,3, Delphine Gabillard6,7, Serge Paul Eholié5,8, Christine Danel5,6,7, Xavier Anglaret5,6,7, Fabien Zoulim9, Pierre-Marie Girard10,11, Constance Delaugerre2,3,4,
Karine Lacombe10,11 for the ANRS 12240 VarBVA study
Institutional affiliations:
1
INSERM, UMR_S1136, Institut Pierre Louis d’Epidémiologie et de Santé Publique, Paris, France;
2
Laboratoire de Virologie, Hôpital Saint-Louis, AP-HP, Paris, France;
3
INSERM U941, Paris, France;
4 Université Paris-Diderot, Paris, France; 5
Programme PAC-CI, ANRS Research Site, Treichville University Hospital, Abidjan, Côte d’Ivoire;
6
INSERM, U897, Epidémiologie-Biostatistique, Bordeaux, France;
7 University of Bordeaux, ISPED, Bordeaux, France; 8
Department of Infectious and Tropical Diseases, Treichville University Teaching Hospital, Abidjan, Côte d’Ivoire;
9
Centre de Recherche sur le Cancer de Lyon, Equipes 15 et 16, INSERM, Unité 1052, CNRS, UMR 5286, Lyon, France;
10
Department of Infectious and Tropical Diseases, Saint-Antoine Hospital, AP-HP, Paris, France;
11
Sorbonne Universités, UPMC Univ Paris 06, UMR_S 1136, Institut Pierre Louis d’Epidémiologie et de Santé Publique, Paris, France.
2 Anders Boyd, MPH, PhD
Service de maladies infectieuses - Hôpital Saint-Antoine 184 rue du Faubourg Saint-Antoine
75012 Paris – FRANCE Tel: +33 1 71 97 05 17 Fax: +33 1 49 28 21 49 Email: anders.boyd@upmc.fr
3
ABSTRACT
Background and aim: In Sub-Saharan Africa, seroclearance of hepatitis B surface antigen (HBsAg) and
hepatitis B “e” antigen (HBeAg), including their quantifiable markers, have rarely been evaluated during long-term antiviral treatment among patients co-infected with HIV and hepatitis B virus (HBV).
Methods: In this prospective cohort study from two randomized-control trials in Côte d’Ivoire, 161
antiretroviral-naïve HIV-HBV co-infected patients starting lamivudine (n=76) or tenofovir/emtricitabine (n=85) containing antiretroviral therapy were included. HBV-DNA was quantified using an in-house assay (detection limit=12 copies/mL) and HBsAg quantification (qHBsAg) using the Elecsys assay.
Results: Overall, 33 (20.5%) patients were HBeAg-positive, 121 (75.2%) had detectable HBV-DNA and
92/93 (98.9%) harbored HBV genotype E. Median treatment duration was 35.5 months (IQR: 24.3-36.4). Among HBeAg-positive patients, cumulative proportion with HBeAg-seroclearance was 46.3% (n=14). Overall, cumulative proportion of HBsAg-seroclearance was 6.6% (n=10). Lower baseline qHBsAg levels and strong 12-month declines in qHBsAg were significantly associated with HBsAg-seroclearance for both HBeAg-negative and positive patients. When taken at certain levels, these determinants provided moderate sensitivity (Se) and specificity (Sp) in predicting HBsAg-seroclearance at month-36 (≤1000 IU/mL at baseline, Se=0.80, Sp=0.80; ≥1.0 log10 IU/mL drop at month-12, Se=0.57, Sp=1.00). Instead,
qHBsAg levels ≤100 or ≤10 IU/mL at month-12 were optimal (both Se=0.90, Sp=1.00). Detectable HBV-DNA provided fairly high Se and Sp when evaluated at baseline (Se=1.00, Sp=0.80), but not at month-12 (Se=0.80, Sp=0.40).
Conclusions: HBsAg seroclearance rates are not common in patients from Sub-Saharan Africa treated
with anti-HBV containing antiretroviral therapy. qHBsAg levels at twelve months of treatment may accurately predict HBsAg-seroclearance.
4
Key words: HBsAg quantification; HBeAg quantification; immunosuppression; serological endpoints;
5
INTRODUCTION
In Sub-Saharan Africa (SSA), at most 10% of patients infected with the human immunodeficiency virus (HIV) are also chronically infected with hepatitis B virus (HBV).1 From studies in industrialized countries, co-infection is clearly associated with increased risk of liver cirrhosis, hepatocellular carcinoma, and liver-related morbidity and mortality.2–4 Serum levels of HBV replication are strongly associated with these events5, while mounting evidence has shown a reduction of hepatocellular carcinoma in particular with antiviral-associated HBV suppression.6 Antiretroviral therapy (ART) with dual activity against HIV and HBV would then be considered ideal for co-infected patients in any setting.
Nevertheless, one of the most important surrogates in establishing therapeutic response is hepatitis B surface antigen (HBsAg), considering loss of HBsAg is strongly associated with reduced viral activity in the liver and improved clinical prognosis.7 HBsAg-loss has already been studied in HIV-HBV co-infected patients from industrialized countries treated with long-term tenofovir (TDF)-containing ART, with prospective results demonstrating cumulative HBsAg-seroclearance rates ranging from 5-8%.8,9 To date,
the sparse literature on HBsAg-seroclearance in SSA includes only small numbers of patients and extends to roughly one year of follow-up.10,11 This period would be judged fairly inadequate, given that HBsAg-loss is most likely to occur within the first three years of treatment.9
The aim of the study herein is then to estimate the rates of HBsAg-seroclearance and its determinants among HIV-HBV patients from Côte d’Ivoire initiating either a lamivudine (LAM) or TDF-containing ART regimen. Using hepatitis B “e” antigen (HBeAg) as another marker of clinical improvement, yet possibly less useful given the characteristically low proportion of patients with HBeAg-positive serology on the continent12, we further estimated rates of seroclearance and its determinants among
HBeAg-6 positive patients. Finally, we used biomarkers strongly correlated with these events, HBsAg
quantification (qHBsAg) and HBeAg quantification (qHBeAg), in order to examine the on-treatment kinetics after ART-initiation and its ability to predict seroclearance.
METHODS
Study population
The VarBVA study13 is an observational cohort including patients from two prospective, randomized, open-label, multi-center trials in Abidjan, Côte d’Ivoire: Trivacan ANRS 1269 (NCT00158405), aimed at evaluating the benefits and risks of structured treatment interruption; and Temprano ANRS 12136 (NCT00495651), aimed at evaluating the benefits and risks of starting ART earlier than current World Health Organization (WHO) recommendations. Study randomization and follow-up procedures have been detailed elsewhere.14,15
Briefly, study inclusion criteria were as follows – both studies: age ≥18 years, HIV-1 or mixed HIV-1/2 infection, and ART-naïve (with the exception of short-course treatment for the prevention of mother-to-child HIV transmission); Trivacan: CD4 cell count between 150-350/mm3 or CD4 percentage between 12.5%-20.0%; Temprano: CD4 cell count <800/mm3 and no concurrent criteria for ART-initiation according to most recent WHO guidelines. The study non-inclusion criteria were as follows – both
studies: residence outside of Abidjan; unwillingness to participate; pregnancy; severe renal or hepatic
disease; severe psychiatric disorder; or any ongoing severe clinical features of undiagnosed origin;
7 tuberculosis disease, or severe cardiac disorder. All participants gave written informed consent and approval of the study protocols were obtained by the Ministry of Health of Côte d’Ivoire and the French National Agency for Research on AIDS and Viral Hepatitis (ANRS, Paris, France).
Antiretroviral treatment
In the Trivacan trial, all patients started ART at inclusion, receiving zidovudine/LAM in combination with either efavirenz or ritonavir-boosted lopinavir (“LAM-containing ART”). After a 6 to 18 months phase of continuous ART, those who fulfilled randomization criteria (CD4 >350 /mm3, plasma HIV-1 RNA <300 copies/mL) were randomized to one of three arms: continuous-ART, CD4-guided ART interruptions (reintroduction when CD4 <250/mm3, interruption when CD4 >350/mm3), or fixed-schedule ART interruptions (2-months-off and 4-months-on). Those who did not reach randomization criteria
underwent continuous-ART. In the Temprano trial, patients were randomized at inclusion to either start ART immediately or defer ART until WHO ART-initiation criteria were met. In both strategies, the first-line ART regimen was TDF/FTC in combination with one other antiretroviral agent: efavirenz, zidovudine, or ritonavir-boosted lopinavir (“TDF/FTC-containing ART”).
Study visits
For the VarBVA study, we considered all patients included in the Trivacan trial between December 2002 and April 2004 and all patients included in the Temprano trial between March 2008 and March 2011. All patients from these studies were tested for HBsAg at study inclusion (Mini Vidas® assay; Biomerieux, Marcy l’Etoile, France). We included patients who tested HBsAg-positive, confirmed by the HBsAg Qual II Architect assay (Abbott Laboratories, Rungis, France), and who started ART at inclusion or any time
8 during participation in the trial. For this analysis, we define the “baseline” visit at ART-initiation and “follow-up” visits at each yearly visit thereafter until the date of last follow-up (with available frozen sample), study termination, permanent treatment discontinuation, or treatment switch. In the Temprano study, if the last follow-up visit was not on the yearly interval, the closest 6-month visit was used instead.
Plasma alanine aminotransferase (ALT) at baseline and aspartate aminotransferase (AST) at baseline and during follow-up were quantified during the Trivacan study, while ALT was available at for all visits during the Temprano study. CD4+ cell counts (True Count technique on FACScan, Becton Dickinson, Aalst-Enembobegem, Belgium) and plasma HIV-1 RNA [real-time polymerase chain reaction (PCR) on TaqMan technology ABI Prism 7000, Applied Biosystems, Courtaboeuf, France; detection threshold: 300
copies/mL] were measured at baseline and every follow-up visit.16
HBV viral loads and serological battery
From frozen samples stored at -80°C, HBV-DNA viral loads were quantified at baseline and every follow-up visit using an in-house PCR-based assay (QuantiFast SYBR® Green PCR kit, Qiagen, Courtaboeuf, France; Light Cycler 480, Roche, Boulogne-Billancourt, France) with a detection limit of 12 copies/mL.13
Qualitative HBsAg was detected using the HBsAg Qual II test (detection limit=0.03 IU/mL, Architect, Abbott Laboratories, Rungis, France) at baseline and during follow-up. Qualitative HBeAg and anti-HBe antibodies (anti-HBeAb) were detected using the Elecsys assay (Roche Diagnostics, Meylan, France) for the same visits. The following definitions were used throughout the study: HBeAg-seroclearance, HBeAg-loss from the previous visit, and HBsAg-seroclearance, HBsAg-loss from the previous visit.
9
Quantification of HBV serological markers
For HBsAg-positive samples, qHBsAg was quantified using the Elecsys assay with the Modular E170 analyzer (Roche Diagnostics, Meylan, France). Similarly for HBeAg-positive samples, qHBeAg was quantified using the Elecsys assay. This automated electrochemiluminescence immunoassay gives qHBeAg levels in a semi-quantitative manner and is interpreted as the ratio of sample relative light units to a cut-off value. These units were converted to Paul Ehrlich Institute units (PEIU/mL) from a previously established protocol.17
Statistical analysis
Statistical analysis was performed using STATA (v12.1, College Station, TX) and significance was determined using a p-value <0.05. Unless otherwise specified, all comparisons were performed using Kruskal-Wallis test for continuous variables and Pearson χ² test or Fisher’s exact test for categorical variables.
In HBeAg-positive patients, median (IQR) qHBeAg levels and change in qHBeAg from baseline (∆qHBeAg) were summarized at each yearly interval. For all patients, median (IQR) qHBsAg levels and change in qHBsAg from baseline (∆qHBsAg) were also summarized at each yearly interval, but due to substantial differences in qHBsAg kinetics, patients were stratified by HBeAg-status at baseline.8,18 Preliminary analysis (Supplementary results) demonstrated no significant differences between patients undergoing LAM versus TDF/FTC-containing ART and hence they were pooled together.
10 Determinants of qHBsAg levels per HBeAg-status were evaluated over time with a Generalized
Estimating Equation, accounting for within-patient effects using an unstructured working correlation. A multivariable model was constructed by adding all covariables with a p<0.1 in univariable analysis and removing those variables above this p-value threshold in backwards-stepwise fashion. In post hoc analysis, we compared ∆qHBsAg during follow-up between the following factors by including an interval time×risk-factor interaction term in the multivariable model: TDF/FTC- versus LAM-containing ART and LAM-randomization arm.
Finally, several clinical factors were compared between patients who did versus did not achieve specific serological endpoints. In exploratory analysis, we selected several criteria a priori to predict HBsAg-seroclearance: qHBsAg ≤10,000 IU/mL, ≤1000 IU/mL, and ≤100 IU/mL at baseline; qHBsAg ≤100 IU/mL and ≤10 IU/mL at month-12; qHBsAg drop ≥1.0 and ≥2.0 log10 IU/mL at month-12; and HBV-DNA >12
copies/mL at baseline and at month-12. Time-dependent classification probabilities, sensitivity (Se) and specificity (Sp), and predictive values, positive predictive value (PPV) and negative predictive value (NPV), were calculated for each criterion as a predictor of HBsAg-loss until months-24 and 36. Time-dependent receiver operator characteristic (ROC) curves were constructed and area under the ROC curves (AUC) were compared between criteria using the method of Blanch et al.19 Likewise, we also examined prediction of HBsAg-seroclearance with two commonly obtained markers: HBeAg-serology at baseline and change in CD4+ cell counts at 12-months. In order to determine whether adding these criteria improved prediction of HBsAg-seroclearance, HBeAg-serology and 12-month change in CD4+ cell counts were combined with the optimal qHBsAg criterion using the “or” Boolean operator and AUCs were compared to the optimal qHBsAg criterion alone. Due to the low prevalence of HBeAg-positive status, we did not attempt similar analysis for HBeAg-seroclearance.
11
RESULTS
Description of the study population
At inclusion, 259 of 2465 patients enrolled in both trials were HBsAg-positive. Among them, 98 were not included in analysis because they did not have confirmed HBsAg-positive serology (n=31) or had
suspected acute HBV-infection (n=1), never initiated ART (n=30), had only one follow-up visit (n=16), discontinued ART <6 months due to pregnancy (n=3) or adverse event (n=2), had missing data on HBV viral load at baseline (n=8), or had missing data on qHBsAg levels at baseline or during follow-up (n=7). In total, 161 patients were included with 76 and 85 undergoing LAM- and TDF/FTC-containing ART, respectively. Among those undergoing LAM-containing ART, 12 (15.8%) were randomized to continuous-ART, 22 (29.0%) to CD4-guided ART interruptions, 28 (36.8%) to fixed-schedule ART interruptions, and 14 (18.4%) non-randomized while taking continuous LAM.
A total of 33 (20.5%) patients were HBeAg-positive. Demographic, HIV and HBV-related characteristics at baseline are summarized in Table 1 and stratified by status. As expected, patients with HBeAg-positive serology were more likely to have detectable HBV-DNA (p<0.001) and higher HBV-DNA viral loads (p=0.0001). HBeAg-positive patients were also more severely immunocomprimised, as they had significantly lower CD4+ cell counts (p=0.02) and higher WHO clinical stages of HIV-infection (p=0.01) when compared to HBeAg-negative patients (Table 1).
Patients were followed for a median 35.5 months (IQR: 24.3-36.4). In patients with detectable HBV-DNA at baseline, undetectable HBV-DNA was achieved by 97/121 (cumulative rate=83.0%) at the end of
12 follow-up, while HBeAg-positive patients had a lower cumulative rate of undetectable HBV-DNA
compared to HBeAg-negative patients (58.8% versus 91.1%, log-rank test p=0.0002).
HBeAg quantification during treatment
In the 33 HBeAg-positive patients, overall median qHBeAg was 173.1 PEIU/mL (IQR: 85.8-367.0) at baseline. qHBeAg levels and ∆qHBeAg are summarized for each follow-up time point in Figure 1A. There was a progressive drop in qHBeAg levels, reaching low levels for the majority of patients.
Rates and determinants of HBeAg-seroclearance
A total of 14/33 patients (42.4%) had HBeAg-serocleance after a median 14.8 months (IQR: 11.2-25.2) of anti-HBV-containing ART, giving an incidence rate of 1.7/100 person·years and cumulative proportion of HBeAg-seroclearance at 46.3% (Figure 2A). Comparison of clinical, virological, and immunological factors between patients with versus without HBeAg-seroclearance are summarized in Table 2. Lower baseline qHBsAg (p=0.02) and greater decreases of 12-month ∆qHBsAg (p=0.002) were significantly associated with HBeAg-seroclearance. When examining the qHBeAg profiles of patients with HBeAg-seroclearance (Figure 2A), it would appear that most patients had relatively low qHBeAg at baseline, with three patients exhibiting severe declines in qHBeAg after ART-initiation.
HBsAg quantification during treatment
Overall, median qHBsAg levels were 3.99 log10 IU/mL (IQR: 3.37-4.22) at baseline, with significantly
HBeAg-13 negative serology (3.82 IU/mL, IQR: 3.27-4.10) (p=0.0001). qHBsAg levels and ∆qHBsAg for each follow-up time point are summarized in Figure 1B among HBeAg-positive and HBeAg-negative patients. A large reduction in qHBsAg was observed after ART-initiation for mainly HBeAg-positive patients.
In multivariable analysis (Supplementary Table 1), baseline qHBsAg level emerged as a significant predictor of qHBsAg levels for all time-points (HBeAg-positive, p<0.001 and HBeAg-negative, p<0.001). Significant declines from baseline were observed for both HBeAg-positive and HBeAg-negative patients. In post hoc analysis, there was no significant difference in ∆qHBsAg during follow-up between LAM- versus TDF/FTC-containing ART (HBeAg-positive, p=0.2; HBeAg-negative, p=0.3). Significant differences in ∆qHBsAg between LAM-randomization groups were observed among HBeAg-negative (p=0.0007) and not HBeAgpositive patients (p=0.17). In further analysis, there was an immediate mean difference of -0.21 log10/mL of ∆qHBsAg in HBeAg-negative patients randomized to continuous LAM during the first
12-months compared to those randomized to receive treatment interruptions, which was maintained throughout follow-up (p=0.004).
Rates and determinants of HBsAg-seroclearance
A total of 10/161 patients (6.2%) had HBsAg-seroclearance after a median 12.3 months (IQR: 12.2-23.5) from ART-initiation, of whom 5/33 (cumulative proportion=15.8%) were HBeAg-positive and 5/128 (cumulative proportion=4.2%) HBeAg-negative (log-rank test p=0.02). In HBeAg-positive patients, lower HBV-DNA viral loads, lower baseline qHBsAg levels, greater 12-month changes in CD4+ cell count and qHBsAg were all significantly associated with HBsAg-seroclearance (Table 3). In HBeAg-negative patients, lower baseline qHBsAg levels and greater 12-month changes in HBV-DNA and qHBsAg were significantly associated with seroclearance (Table 3). As shown in Figure 2B, patients with
HBsAg-14 seroclearance either had fairly low baseline qHBsAg levels or had steep declines in qHBsAg after ART-initiation. Interestingly, one HBeAg-positive patient with HBsAg-seroclearance exhibited rather slow declines in qHBsAg during the first 12-months, which followed in a rapid decline at the next study visit.
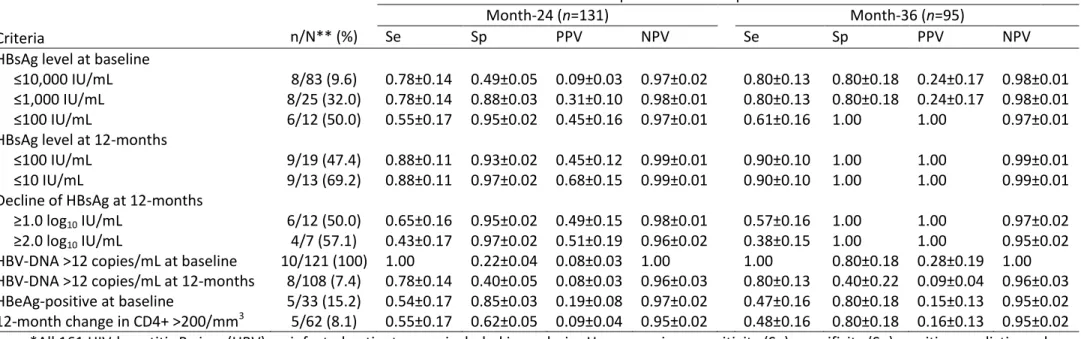
Serological quantifiable markers as predictors of HBsAg-seroclearance
Time-dependent classification probabilities and predictive values of HBsAg-seroclearance are given in Table 4 for a variety of virological and serological criteria. Detectable HBV-DNA at baseline provided perfect Se and NPV during follow-up, yet PPV was rather poor. Baseline qHBsAg levels at ≤1000 IU/mL were ideal for predicting HBsAg-loss at both month-24 and month-36 of anti-HBV containing ART. During treatment, 12-month changes in qHBsAg greater than 1.0 or 2.0 log10 IU/mL had excellent Sp,
albeit with very poor Se. Nevertheless, the optimal markers in predicting HBsAg-loss at month-36 were HBsAg levels ≤100 and ≤10 IU/mL at month-12 of treatment.
Accordingly, AUCs at month-36 were significantly higher for qHBsAg levels ≤100 and ≤10 IU/mL at month-12 of treatment when compared to all other criteria (p<0.04), except for baseline qHBsAg ≤1000 IU/mL (p=0.14 and 0.14, respectively) and detectable HBV-DNA at baseline (p=0.6 and 0.6, respectively). The only other significant difference in AUC at month-36 was observed between baseline qHBsAg ≤1000 IU/mL and detectable DNA at month-12 of treatment (p<0.001). Of note, adding detectable HBV-DNA at baseline and qHBsAg levels ≤100 IU/mL at month-12 together did not improve prediction (p=0.9).
When examining routinely collected parameters, time-dependent classification probabilities were substantially lower for both HBeAg-positive serology and 12-month change in CD4+ cell count >200/mm3 compared to qHBsAg levels ≤100 IU/mL at month-12 (Table 4), with significantly lower AUCs at month-36
15 (respectively 0.636 and 0.642 versus 0.948, p=0.03 and p=0.03). Even after adding these markers to qHBsAg levels ≤100 IU/mL at month-12, there was no significant gain in AUC at month-36 (for HBeAg-positive serology: 0.900, p=0.6; for 12-month change in CD4+ cell count >200/mm3, 0.690, p=0.001).
DISCUSSION
In our study, we present the longest, prospective follow-up to date of serological outcomes among treated HIV-HBV co-infected patients in SSA. In HBeAg-positive patients, HBeAg-seroclearance was achieved in a cumulative 46.3% and HBsAg-seroclearance in a cumulative 15.8%. In HBeAg-negative patients, cumulative HBsAg-seroclearance was observed in 4.2% at the end of follow-up. Despite the high prevalence of HBV genotype E, which is known to have markedly slower kinetics of HBsAg decline during NA-therapy20, these rates fell surprisingly close in line with previous studies among co-infected patients harboring non-E genotypes.8,18,21–23 Importantly, the only two determinants consistent in predicting both HBeAg and HBsAg-seroclearance were lower qHBsAg levels at baseline and stronger decreases in qHBsAg kinetics during the first 12-months after initiating treatment. In HBeAg-positive patients, neither qHBeAg at baseline nor its 12-month change was able to accurately predict any seroclearance event, questioning the clinical utility of this particular marker.
Indeed, the use of qHBsAg has gained a great deal of attention as an indicator for HBsAg-seroclearance events during treatment24, yet has been found to be fairly elusive for nucleoside/nucleotide analogue (NA)-based therapy.25 In co-infected patients treated with potent NAs possessing anti-HBV activity, low levels of pre-treatment qHBsAg have been suggested as an adequate predictor of
16 accurate measure of HBsAg-loss in treated HIV-HBV co-infected patients8,21; however, this might not occur within the first year of treatment.9 In our study, we observed that a lower qHBsAg level at 12-months of anti-HBV containing ART was an ideal predictor of HBsAg-seroclearance, giving both high sensitivity and specificity and significantly higher AUC compared to almost all other criteria. This
criterion would appear to accommodate profiles of patients with either low baseline qHBsAg or large 12-month declines in qHBsAg who would be likely to lose HBsAg-positive serology. Of course, these findings would need to be confirmed for larger cohorts with more seroclearance events.
The difficulty in defining milestones for qHBsAg is extremely important to consider if it is to be used in resource-limited settings. One alternative marker of choice would certainly be HBV-DNA, allowing assessment of treatment efficacy in suppressing virus and providing a potential explanation of viral-induced liver pathology. However, viral load quantification runs at almost a 6-times higher cost than serological assays. In addition, as access to anti-HBV treatments without any evidence of resistance mutations, namely TDF26, increases on the continent27, the need to assess virological breakthrough becomes less warranted. While although we observed that detectable HBV-DNA provided high sensitivity and specificity in our study, it has been repeatedly observed to be a poor predictor of serological events.8,9,18
Intriguingly, there was no recognizable difference in qHBsAg decline between specific anti-HBV NAs included in the ART regimen for either HBeAg-positive or HBeAg-negative patients. In HBeAg-positive patients, only one head-to-head comparison between LAM and TDF during the first 48 weeks has been performed with respect to on-treatment kinetics of qHBsAg, demonstrating no significant differences in qHBsAg decline.21 This observation could be linked to HBV-DNA replication, which is known to be more strongly correlated with qHBsAg levels during HBeAg-positive chronic infection.28,29 HBV-DNA replication
17 in HBeAg-positive patients from both our study and others substantially declined during the first twelve months of therapy with no significant difference between anti-HBV treatment regimens. The similar initial kinetics of DNA replication would likely follow that of qHBsAg. In HBeAg-negative HBV-monoinfected patients, larger decreases in qHBsAg levels have been observed with TDF compared to other NAs, especially LAM.30 Of course, the large difference regarding our study was the overwhelming majority of patients with HBV genotype E, in whom very slow declines in qHBsAg during potent NA-treated HBeAg-negative infection have been observed compared to non-E genotypes.20
Since the study population herein was HIV-HBV co-infected, there are inherent differences when
comparing our results to HBV-monoinfected patients. More recent research directly comparing HIV-HBV and HBV-monoinfected patients, treated specifically with TDF and recruited in the same catchment areas, has actually observed no difference in infection groups with regards to HBeAg-seroclearance, HBeAg-seroconversion, or HBsAg-seroclearance.31,32 However, one more discernable feature that could drive differences in seroclearance rates is HIV-associated immunosuppression.
Nonetheless, immune function has been inconsistently shown to play a role in seroclearance. We have previously demonstrated that baseline CD4 cell count >350/mm3 is associated with faster qHBsAg declines in TDF-treated co-infected patients.18 Yet since the population of this study had extensive treatment experience prior to TDF-initiation, those with CD4+ cell counts <350/mm3 may have represented a specific subgroup with impaired capacity to produce effective immunity.33 Others have found strong correlations with increases in CD4+ cell count and early kinetics of qHBsAg8, while higher degrees of immunosuppression have been associated with seroclearance in general.34 Broadening these results, we observed that 12-month changes in CD4+ cell count were significantly associated with HBsAg-seroclearance, but only in HBeAg-positive patients. Since the development of anti-HBV immunity is quite
18 active during HBeAg-positive infection7, perhaps the additive effect of immunorestoration facilitates HBsAg-seroclearance mainly in the HBeAg-positive phase.
Our study does have a certain number of limitations to address. First, we have stratified LAM- and TDF/FTC-containing ART in past analyses due to the important differences in study designs, while avoiding any comparisons between treatment groups.13 Patients undergoing LAM-containing ART had much lower CD4+ cell counts and the majority was undergoing treatment interruptions during therapy. However, almost all CD4+ cell counts were at levels that have not been associated with differences in qHBsAg/qHBeAg (i.e. >350 cells/mm3) and qHBsAg levels are generally known to remain stable during bouts of HBV-DNA replication29,35, which might have occurred during treatment interruption.36 Second, there were only a handful of HBeAg-seroclearance events and even fewer numbers of patients with HBsAg-seroclearance. Consequently, we did not have sufficient power to perform multivariable analysis and determine independent factors associated with these events, while classification probabilities and predictive values for HBsAg-seroclearance need to be interpreted with some caution. Finally, patients with severe liver-related morbidity were excluded from both trials, thus partially limiting the
generalizability of our results.
In conclusion, seroclearance rates in treated HIV-HBV co-infected patients in SSA, harboring
predominately HBV genotype E, are greatly similar to previous studies in industrialized countries. On the whole, our data underscore the difficulty in achieving these therapeutic endpoints, while the slow declines in HBsAg quantification draws further attention to the persistent nature of chronic hepatitis B. The low rates of serological responses in HIV-HBV co-infected patients stress the need for life-long ART containing an anti-HBV agent, which is an important consideration for scale-up programs in SSA.
19
ACKNOWLEDGEMENTS
We thank all patients who participated in both trials. We also gratefully acknowledge the valuable contributions of the SMIT, CeDReS, CEPREF, USAC, CIRBA, CNTS, La Pierre Angulaire, Hôpital Général Abobo, Formation Sanitaire Anonkoua Kouté, Centre de santé El Rapha, the Programme PACCI team, as well as the INSERM exU593 and U897 teams (Abanou Matthieu, Adou Isabelle, Aman Adou, Anasthasie Yapo, Bakayoko Ibouraîma, Bombo Léontine, Célestin N’chot, Christian Kouadio, Cissé Edwidge, Coulibaly Ali, Djédjé Lucien, Djetouan Hugues, Djobi-Djo Edouard, Goly Jocelyn, Kassi Marie-Cécile, Koffi Justine, Koffi-N’Dri Aholi, Konan Sylvie, Konaté Mamadou, Kouadio Bertin, Kouamé Martin, Kouadio Cheftin, Kouadio Martin, Kouadio Victoire, Kouakou-Aboua Adrienne, Kouakou Yao, Kouamé Antoine, Kouamé Ferdinand, Kouamé Gérald, Kouamé Justine, Labibi Georgette, Lehou Jean, Lokou Benjamin, Martin Marie-Pierre, Moh Jules, Moussa-Doumbia Mariam, N’Chot Célestin, N’Dri Marie Julie, Nalourgou Tuo, N’Goran Brou, Nogbout Marie-Pascale, Orne-Gliemann Joanna, Ouattara Bakary, Ouattara Minata, Oupoh Joséphine, Sidibé Abdelh, Siloué Bertine, Soro Adidiata, Tchehy Amah-Cécile, Yao Emile, Yao Juliette, Yoro Guei, and Zaho Marcel); and Bristol-Myers Squibb for providing Zerit and Videx; Gilead Sciences, for the donation of Truvada; and Merck Sharp & Dohme, for the donation of Stocrin. We would finally like to thank Paul Dény and Mariama Issoufou for the quantification of HBV-DNA viral loads and HBV sequencing as well as Gilles Peytavin for determining antiviral concentrations.
This study was supported by funds from the Agence Nationale de Recherche sur le Sida et les Hépatites (ANRS 12240). The Trivacan and Temprano studies also received funding from the ANRS (ANRS
1269/ANRS 12104 and ANRS 12136, respectively). Finally, A.B. was awarded a post-doctoral fellowship from the ANRS and SIDACTION for some of the work presented in this manuscript.
20
Potential conflicts of interest
The authors report no conflicts of interest relative to the article.
REFERENCES
1. Lacombe K, Rockstroh J. HIV and viral hepatitis coinfections: advances and challenges. Gut. 2012 May;61 Suppl 1:i47–58.
2. Ioannou GN, Bryson CL, Weiss NS, Miller R, Scott JD, Boyko EJ. The prevalence of cirrhosis and hepatocellular carcinoma in patients with human immunodeficiency virus infection. Hepatol. 2013 Jan;57(1):249–57.
3. Falade-Nwulia O, Seaberg EC, Rinaldo CR, Badri S, Witt M, Thio CL. Comparative risk of liver-related mortality from chronic hepatitis B versus chronic hepatitis C virus infection. Clin Infect Dis. 2012 Aug;55(4):507–13.
4. Ly KN, Xing J, Klevens RM, Jiles RB, Ward JW, Holmberg SD. The increasing burden of mortality from viral hepatitis in the United States between 1999 and 2007. Ann Intern Med. 2012 Feb
21;156(4):271–8.
5. Chen C-J, Yang H-I, Iloeje UH, REVEAL-HBV Study Group. Hepatitis B virus DNA levels and outcomes in chronic hepatitis B. Hepatol. 2009 May;49(5 Suppl):S72–84.
6. Papatheodoridis GV, Chan HL-Y, Hansen BE, Janssen HLA, Lampertico P. Risk of hepatocellular carcinoma in chronic hepatitis B: Assessment and modification with current antiviral therapy. J Hepatol. 2015 Apr;62(4):956–67.
21 7. European Association For The Study Of The Liver. EASL clinical practice guidelines: Management of
chronic hepatitis B virus infection. J Hepatol. 2012 Jul;57(1):167–85.
8. Zoutendijk R, Zaaijer HL, de Vries-Sluijs TEMS, Reijnders JGP, Mulder JW, Kroon FP, et al. Hepatitis B surface antigen declines and clearance during long-term tenofovir therapy in patients coinfected with HBV and HIV. J Infect Dis. 2012 Sep 15;206(6):974–80.
9. Boyd A, Maylin S, Gozlan J, Delaugerre C, Simon F, Girard P-M, et al. Use of hepatitis B surface and “e” antigen quantification during extensive treatment with tenofovir in patients co-infected with HIV-HBV. Liver Int. 2015 Mar;35(3):795–804.
10. Hamers RL, Zaaijer HL, Wallis CL, Siwale M, Ive P, Botes ME, et al. HIV-HBV Coinfection in Southern Africa and the Effect of Lamivudine- Versus Tenofovir-Containing cART on HBV Outcomes. J Acquir Immune Defic Syndr. 2013 Oct 1;64(2):174–82.
11. Matthews GV, Manzini P, Hu Z, Khabo P, Maja P, Matchaba G, et al. Impact of lamivudine on HIV and hepatitis B virus-related outcomes in HIV/hepatitis B virus individuals in a randomized clinical trial of antiretroviral therapy in southern Africa. AIDS. 2011 Sep 10;25(14):1727–35.
12. Hadziyannis SJ. Natural history of chronic hepatitis B in Euro-Mediterranean and African countries. J Hepatol. 2011 Jul;55(1):183–91.
13. Boyd A, Moh R, Gabillard D, le Carrou J, Danel C, Anglaret X, et al. Low risk of lamivudine-resistant hepatitis B virus and hepatic flares in treated HIV-HBV co-infected patients from Côte d’Ivoire. Antivir Ther. 2015 (in press)
14. Danel C, Moh R, Minga A, Anzian A, Ba-Gomis O, Kanga C, et al. CD4-guided structured
antiretroviral treatment interruption strategy in HIV-infected adults in west Africa (Trivacan ANRS 1269 trial): a randomised trial. Lancet. 2006 Jun 17;367(9527):1981–9.
22 15. Jean K, Gabillard D, Moh R, Danel C, Fassassi R, Desgrées-du-Loû A, et al. Effect of early
antiretroviral therapy on sexual behaviors and HIV-1 transmission risk among adults with diverse heterosexual partnership statuses in Côte d’Ivoire. J Infect Dis. 2014 Feb 1;209(3):431–40.
16. Rouet F, Ekouevi DK, Chaix M-L, Burgard M, Inwoley A, Tony TD, et al. Transfer and evaluation of an automated, low-cost real-time reverse transcription-PCR test for diagnosis and monitoring of human immunodeficiency virus type 1 infection in a West African resource-limited setting. J Clin Microbiol. 2005 Jun;43(6):2709–17.
17. Maylin S, Boyd A, Martinot-Peignoux M, Delaugerre C, Bagnard G, Lapalus M, et al. Quantification of hepatitis B e antigen between Elecsys HBeAg and Architect HBeAg assays among patients infected with hepatitis B virus. J Clin Virol. 2013 Apr;56(4):306–11.
18. Maylin S, Boyd A, Lavocat F, Gozlan J, Lascoux-Combe C, Miailhes P, et al. Kinetics of hepatitis B surface and envelope antigen and prediction of treatment response to tenofovir in antiretroviral-experienced HIV-hepatitis B virus-infected patients. AIDS. 2012 May 15;26(8):939–49.
19. Blanche P, Dartigues JF, Jacqmin-Gadda H. Estimating and comparing time-dependent areas under receiver operating characteristic curves for censored event times with competing risks. Stat Med. 2013;32(20):5381–97.
20. Boglione L, Cardellino CS, De Nicolò A, Cariti G, Di Perri G, D’Avolio A. Different HBsAg decline after 3 years of therapy with entecavir in patients affected by chronic hepatitis B HBeAg-negative and genotype A, D and E. J Med Virol. 2014 Nov;86(11):1845–50.
21. Matthews GV, Ali RJ, Avihingsanon A, Amin J, Hammond R, Bowden S, et al. Quantitative HBsAg and HBeAg predict hepatitis B seroconversion after initiation of HAART in HIV-HBV coinfected individuals. PLoS One. 2013;8(4):e61297.
23 22. Strassl R, Reiberger T, Honsig C, Payer BA, Mandorfer M, Grabmeier-Pfistershammer K, et al. Viral
determinants predicting hepatitis B surface antigen (HBsAg) seroclearance in HIV-/HBV-coinfected patients. J Viral Hepat. 2014 Jul;21(7):508–16.
23. Kosi L, Reiberger T, Payer BA, Grabmeier-Pfistershammer K, Strassl R, Rieger A, et al. Five-year on-treatment efficacy of lamivudine-, tenofovir- and tenofovir + emtricitabine-based HAART in HBV-HIV-coinfected patients. J Viral Hepat. 2012 Nov;19(11):801–10.
24. Chan HL-Y, Thompson A, Martinot-Peignoux M, Piratvisuth T, Cornberg M, Brunetto MR, et al. Hepatitis B surface antigen quantification: why and how to use it in 2011 - a core group report. J Hepatol. 2011 Nov;55(5):1121–31.
25. Janssen HLA, Sonneveld MJ, Brunetto MR. Quantification of serum hepatitis B surface antigen: is it useful for the management of chronic hepatitis B? Gut. 2012 May;61(5):641–5.
26. Kitrinos KM, Corsa A, Liu Y, Flaherty J, Snow-Lampart A, Marcellin P, et al. No detectable resistance to tenofovir disoproxil fumarate after 6 years of therapy in patients with chronic hepatitis B. Hepatol. 2014 Feb;59(2):434–42.
27. Lemoine M, Eholié S, Lacombe K. Reducing the neglected burden of viral hepatitis in Africa: strategies for a global approach. J Hepatol. 2015 Feb;62(2):469–76.
28. Thompson AJV, Nguyen T, Iser D, Ayres A, Jackson K, Littlejohn M, et al. Serum hepatitis B surface antigen and hepatitis B e antigen titers: disease phase influences correlation with viral load and intrahepatic hepatitis B virus markers. Hepatol. 2010 Jun;51(6):1933–44.
29. Martinot-Peignoux M, Lapalus M, Asselah T, Marcellin P. The role of HBsAg quantification for monitoring natural history and treatment outcome. Liver Int. 2013 Feb;33 Suppl 1:125–32. 30. Boglione L, D’Avolio A, Cariti G, Gregori G, Burdino E, Baietto L, et al. Kinetics and prediction of
HBsAg loss during therapy with analogues in patients affected by chronic hepatitis B HBeAg negative and genotype D. Liver Int. 2013 Apr;33(4):580–5.
24 31. Plaza Z, Aguilera A, Mena A, Vispo E, Sierra-Enguita R, Tomé S, et al. Influence of HIV infection on
response to tenofovir in patients with chronic hepatitis B. AIDS. 2013 Sep 10;27(14):2219–24. 32. Piroth L, Pol S, Lacombe K, Miailhes P, Rami A, Rey D, et al. Management and treatment of chronic
hepatitis B virus infection in HIV positive and negative patients: the EPIB 2008 study. J Hepatol. 2010 Dec;53(6):1006–12.
33. Sauce D, Larsen M, Fastenackels S, Pauchard M, Ait-Mohand H, Schneider L, et al. HIV disease progression despite suppression of viral replication is associated with exhaustion of lymphopoiesis. Blood. 2011 May 12;117(19):5142–51.
34. Miailhes P, Trabaud M-A, Pradat P, Lebouché B, Chevallier M, Chevallier P, et al. Impact of highly active antiretroviral therapy (HAART) on the natural history of hepatitis B virus (HBV) and HIV coinfection: relationship between prolonged efficacy of HAART and HBV surface and early antigen seroconversion. Clin Infect Dis. 2007 Sep 1;45(5):624–32.
35. Boyd A, Gozlan J, Maylin S, Delaugerre C, Peytavin G, Girard P-M, et al. Persistent viremia in human immunodeficiency virus/hepatitis B coinfected patients undergoing long-term tenofovir: virological and clinical implications. Hepatol. 2014 Aug;60(2):497–507.
36. Dore GJ, Soriano V, Rockstroh J, Kupfer B, Tedaldi E, Peters L, et al. Frequent hepatitis B virus rebound among HIV-hepatitis B virus-coinfected patients following antiretroviral therapy interruption. AIDS. 2010 Mar 27;24(6):857–65.
25
FIGURE LEGENDS
Figure 1. Decline in quantification of hepatitis B “e” antigen (qHBeAg) and hepatitis B surface antigen (qHBsAg) during treatment
For both qHBeAg, among HBeAg-positive patients (A), and qHBsAg (B), median levels and their IQRs (in bars) during follow-up are given on the left panels, while median changes from baseline and their IQRs (in bars) are given on the right panels. For qHBsAg levels, patients were stratified on baseline HBeAg status.
Figure 2. Rates of hepatitis B “e” antigen (HBeAg) and hepatitis B surface antigen (HBsAg) seroclearance during treatment
Cumulative proportions of HBeAg-seroclearance, among HBeAg-positive patients (A), and
HBsAg-seroclearance (B) are given in the left panel. For each patient achieving their respective endpoint, HBeAg quantification (qHBeAg) (A) or HBsAg quantification (qHBsAg) (B) during treatment is detailed on the right panel. For qHBsAg levels, patients were stratified on baseline HBeAg status.
26
TABLES
Table 1. Baseline description of the study population stratified by HBeAg-status
Total HBeAg-negative HBeAg-positive
(n=161) (n=128) (n=33) p†
Demographic characteristics
Gender, male/female (% males) 54/107 (33.5) 46/82 (35.9) 8/25 (24.2) 0.2
Age, years* 35 (30-41) 35 (30-41) 34 (29-37) 0.3
BMI, kg/m²* 21.5 (19.3-24.2) 21.9 (19.4-24.9) 21.1 (19.1-22.3) 0.06
Current smoker** 17 (10.7) 13 (10.3) 4 (12.1) 0.8
HIV characteristics
WHO clinical stage** 0.01
Stage I 66 (41.0) 55 (43.0) 11 (33.3)
Stage II 54 (33.5) 47 (36.7) 7 (21.2)
Stage III 38 (23.6) 25 (19.5) 13 (39.4)
Stage IV 3 (1.9) 1 (0.8) 2 (6.1)
HIV-RNA >300 copies/mL** 154 (96.9) 121 (96.0) 33 (100) 0.6 HIV-RNA, log10 copies/mL*†† 5.05 (4.52-5.50) 4.98 (4.50-5.36) 5.35 (4.68-5.73) 0.05
CD4+ cell count, /mm3* 312 (223-430) 327 (250-438) 268 (183-369) 0.02
Initial antiretroviral treatment** 0.7
TDF+FTC+EFV 58 (36.0) 48 (37.5) 10 (30.3) TDF+FTC+LPV/r 19 (11.8) 16 (12.5) 3 (9.1) TDF+FTC+AZT 8 (5.0) 7 (5.5) 1 (3.0) LAM+AZT+EFV 67 (41.6) 51 (39.8) 16 (48.5) LAM+AZT+IDV/r 7 (4.4) 5 (3.9) 2 (6.1) LAM+AZT+LPV/r 2 (1.2) 1 (0.8) 1 (3.0) HBV characteristics HBV-DNA >12 copies/mL** 121 (75.2) 88 (68.8) 33 (100) <0.001 HBV-DNA, log10 copies/mL*†† 4.17 (3.14-7.57) 3.36 (3.03-5.09) 8.34 (7.54-8.56) 0.0001
HBV-DNA >7.0 log10 copies/mL** 41 (33.9) 12 (13.6) 29 (87.9) <0.001 HBV genotype [N=93]** 0.4 A 1 (1.1) 0 1 (3.0) E 92 (98.9) 60 (100) 32 (97.0) ALT [N=145], IU/mL* 25 (17-38) 25 (16-37) 28 (20-45) 0.4 AST [N=74], IU/mL* 36 (28-48) 33 (26-43) 45 (32-69) 0.04
ALT or AST >40 IU/mL** 49 (30.4) 35 (27.3) 14 (42.4) 0.09 *Median (IQR). **Number (%).
†
Significance between treatment groups determined using Kruskal-Wallis test for continuous variables and Pearson χ² test or Fisher’s exact test for categorical variables.
††
27 Abbreviations: ALT, alanine aminotransferase; AST, aspartate aminotransferase; AZT, zidovudine; BMI, body mass index; EFV, efavirenz; FTC, emtricitabine; HBeAg, hepatitis B “e” antigen; HBV, hepatitis B virus; HIV, human immunodeficiency virus; IDV/r, ritonavir-boosted indinavir; LAM, lamivudine; LPV/r, ritonavir-boosted lopinavir; TDF, tenofovir; WHO, World Health Organization.
28
Table 2. Comparison of patients with and without HBeAg-seroclearance
No HBeAg-seroclearance HBeAg- seroclearance (n=19) (n=14) p† Baseline characteristics
Gender, male/female (%males) 6/13 (31.6) 2/12 (14.3) 0.4
Age, years* 35 (28-37) 32 (29-42) 0.9
BMI, kg/m²* 21.2 (19.2-22.3) 21.0 (19.1-23.2) 0.9
WHO clinical stage** 0.7
Stage I 6 (31.6) 5 (35.7)
Stage II 3 (15.8) 4 (28.6)
Stage III 9 (47.4) 4 (28.6)
Stage IV 1 (5.3) 1 (7.1)
HIV-RNA, log10 copies/mL* 5.42 (4.68-5.81) 5.31 (4.65-5.68) 0.6
CD4+ cell count, /mm3* 283 (183-385) 223 (171-291) 0.5
Anti-HBV ART component** 0.9
LAM 11 (57.9) 8 (57.1)
TDF/FTC 8 (42.1) 6 (42.9)
HBV-DNA >12 copies/mL** 19 (100) 14 (100) ntp
HBV-DNA, log10 copies/mL* 8.34 (7.57-8.56) 8.27 (7.32-8.78) 0.9
HBV-DNA >7.0 log10 copies/mL** 17 (89.5) 12 (85.7) 0.9
ALT, IU/mL [N=31]* 28 (20-47) 28 (16-39) 0.5
AST, IU/mL [N=18]* 39 (32-98) 59 (36-65) 0.7
ALT or AST >40 IU/mL** 7 (36.8) 7 (50.0) 0.5
qHBeAg, PEIU/mL* 190.0 (88.4-378.5) 144.5 (4.6-310.5) 0.6 qHBsAg, log10 IU/mL* 4.82 (4.28-5.04) 4.26 (3.71-4.64) 0.02
During follow-up (12 months)
∆CD4+ cell count, /mm3* 146 (18-285) 233 (105-369) 0.08 ∆HBV-DNA, log10 copies/mL* -5.05 (-7.48, -1.66) -4.81 (-6.18, -3.25) 0.9
∆qHBeAg, PEIU/mL* -60.6 (-107.3, -22.2) -144.3 (-295.7, -4.4) 0.3 ∆qHBsAg, log10 IU/mL* -0.11 (-0.25, -0.02) -0.60 (-2.70, -0.38) 0.002
Analysis was performed among patients with HBeAg-positive serology at baseline [N=33]. *Median (IQR). **Number (%).
†
Significance between treatment groups determined using Kruskal-Wallis test for continuous variables and Pearson χ² test or Fisher’s exact test for categorical variables. ntp – no test performed
29
Table 3. Comparison of patients with and without HBsAg-seroclearance
HBeAg-positive (N=33) HBeAg-negative (N=128)
p†
No seroclearance Seroclearance No seroclearance Seroclearance
(n=28) (n=5) (n=123) (n=5)
Baseline characteristics
Gender, male/female (%males) 6/22 (21.4) 2/3 (40.0) 0.6 42/81 (34.2) 4/1 (80.0) 0.06
Age, years* 34 (28-36) 42 (32-43) 0.08 35 (30-41) 44 (37-47) 0.15
BMI, kg/m²* 21.1 (18.9-22.9) 20.0 (19.1-21.1) 0.5 21.9 (19.6-25.0) 19.0 (18.8-19.5) 0.07
WHO clinical stage** 0.3 0.9
Stage I/II 14 (50.0) 4 (80.0) 98 (79.7) 4 (80.0)
Stage III/IV 14 (50.0) 1 (20.0) 25 (20.3) 1 (20.0)
HIV-RNA, log10 copies/mL* 5.38 (4.78-5.72) 5.27 (4.51-5.73) 0.9 4.94 (4.41-5.29) 5.67 (5.35-6.44) 0.05
CD4+ cell count, /mm3* 279 (190-385) 171 (148-268) 0.11 326 (251-433) 390 (248-448) 0.7
Anti-HBV ART component** 0.9 0.4
LAM 16 (57.1) 3 (60.0) 56 (45.5) 1 (20.0)
TDF/FTC 12 (42.9) 2 (40.0) 67 (54.5) 4 (80.0)
HBV-DNA >12 copies/mL** 28 (100) 5 (100) ntp 83 (67.5) 5 (100.0) 0.3
HBV-DNA, log10 copies/mL* 8.45 (7.68-8.76) 7.21 (5.57-7.93) 0.02 3.04 (0.30-3.73) 3.83 (3.09-4.40) 0.14
HBV-DNA >7.0 log10 copies/mL** 26 (92.9) 3 (60.0) 0.1 11 (8.9) 1 (20.0) 0.4
ALT, IU/mL [N=145]* 29 (20-46) 19 (13-26) 0.12 25 (16-37) 35 (25-53) 0.18
AST, IU/mL [N=74]* 47 (32-92) 43 (29-69) 0.9 33 (25-42) 46†† ntp
ALT or AST >40 IU/mL** 12 (42.9) 2 (40.0) 0.9 33 (26.8) 2 (40.0) 0.6
qHBeAg, PEIU/mL* 183.0 (87.7-355.4) 125.6 (4.6-1140.5) 0.9 -- --
qHBsAg, log10 IU/mL* 4.63 (4.26-4.96) 2.64 (1.75-4.08) 0.03 3.87 (3.36-4.12) -0.29 (-0.92-0.16) 0.0003
During follow-up (12 months)
∆CD4+ cell count, /mm3* 154 (48-277) 344 (276-369) 0.04 154 (45-275) 125 (109-161) 0.6 ∆HBV-DNA, log10 copies/mL* -5.20 (-6.71, -1.74) -4.34 (-5.27, -3.54) 0.9 -1.69 (-3.06, 0) -3.53 (-4.10, -2.79) 0.04
∆qHBeAg, PEIU/mL* -68.8 (-171.5, -21.3) -125.5 (-754.4, -4.4) 0.6 -- --
∆qHBsAg, log10 IU/mL* -0.18 (-0.65, -0.03) -3.05 (-3.94, -0.53) 0.006 0.00 (-0.08, 0.07) -1.01 (-1.46, -0.37) 0.0004
30
†
Significance between treatment groups determined using Kruskal-Wallis test for continuous variables and Pearson χ² test or Fisher’s exact test for categorical variables. ntp – no test performed †† Only one value available.
Table 4. Predicting HBsAg-seroclearance using time-dependent classification probabilities during anti-HBV containing antiretroviral treatment
Criteria
Classification probabilities and predictive values ± SE*
Month-24 (n=131) Month-36 (n=95)
n/N** (%) Se Sp PPV NPV Se Sp PPV NPV
HBsAg level at baseline
≤10,000 IU/mL 8/83 (9.6) 0.78±0.14 0.49±0.05 0.09±0.03 0.97±0.02 0.80±0.13 0.80±0.18 0.24±0.17 0.98±0.01 ≤1,000 IU/mL 8/25 (32.0) 0.78±0.14 0.88±0.03 0.31±0.10 0.98±0.01 0.80±0.13 0.80±0.18 0.24±0.17 0.98±0.01 ≤100 IU/mL 6/12 (50.0) 0.55±0.17 0.95±0.02 0.45±0.16 0.97±0.01 0.61±0.16 1.00 1.00 0.97±0.01
HBsAg level at 12-months
≤100 IU/mL 9/19 (47.4) 0.88±0.11 0.93±0.02 0.45±0.12 0.99±0.01 0.90±0.10 1.00 1.00 0.99±0.01 ≤10 IU/mL 9/13 (69.2) 0.88±0.11 0.97±0.02 0.68±0.15 0.99±0.01 0.90±0.10 1.00 1.00 0.99±0.01
Decline of HBsAg at 12-months
≥1.0 log10 IU/mL 6/12 (50.0) 0.65±0.16 0.95±0.02 0.49±0.15 0.98±0.01 0.57±0.16 1.00 1.00 0.97±0.02
≥2.0 log10 IU/mL 4/7 (57.1) 0.43±0.17 0.97±0.02 0.51±0.19 0.96±0.02 0.38±0.15 1.00 1.00 0.95±0.02
HBV-DNA >12 copies/mL at baseline 10/121 (100) 1.00 0.22±0.04 0.08±0.03 1.00 1.00 0.80±0.18 0.28±0.19 1.00 HBV-DNA >12 copies/mL at 12-months 8/108 (7.4) 0.78±0.14 0.40±0.05 0.08±0.03 0.96±0.03 0.80±0.13 0.40±0.22 0.09±0.04 0.96±0.03 HBeAg-positive at baseline 5/33 (15.2) 0.54±0.17 0.85±0.03 0.19±0.08 0.97±0.02 0.47±0.16 0.80±0.18 0.15±0.13 0.95±0.02 12-month change in CD4+ >200/mm3 5/62 (8.1) 0.55±0.17 0.62±0.05 0.09±0.04 0.95±0.02 0.48±0.16 0.80±0.18 0.16±0.13 0.95±0.02 *All 161 HIV-hepatitis B virus (HBV) co-infected patients were included in analysis. However, since sensitivity (Se), specificity (Sp), positive predictive value (PPV) and negative predictive value (NPV) are in function of Kaplan-Meier survival probabilities, the number of patients considered [i.e., those not lost to follow-up or having hepatitis B surface antigen (HBsAg)-seroclearance] during each time-interval has been included. Standard errors (SE) of each estimator are also provided.
**Number with antigen loss (n) over total number of patients with the given criteria (N). A total of ten patients had HBsAg-seroclearance in the study population. All HBsAg-seroclearance events occurred within the first 24 months and thus these values did not change while extending follow-up. In contrast, classification probabilities and predictive values do depend on patient follow-up and could change at later time-points.
Figure 1.
A
n 33 32 27 20 n 33 32 27 20B
n HBeAg+ 33 32 27 20 HBeAg- 128 118 105 78 n HBeAg+ 33 32 27 20 HBeAg- 128 118 105 78 0 100 200 300 400 q H B e A g ( P E IU /mL ) 0 12 24 36Treatment duration (months)
-800 -600 -400 -200 0 C h a n g e in q H B e A g (P E IU /mL ) 0 12 24 36
Treatment duration (months)
0.00 2.00 4.00 6.00 q H B s A g ( lo g 1 0 I U /mL ) 0 12 24 36
Treatment duration (months)
HBeAg+ HBeAg--5.00 -4.00 -3.00 -2.00 -1.00 0.00 C h a n g e in q H B s A g (lo g 1 0 I U /mL ) 0 12 24 36
Treatment duration (months)
HBeAg+
HBeAg-Figure 2.
A
B
0.00 0.25 0.50 0.75 1.00 Cu m u la tive p ro b a b ilit y o f HB e A g -lo ss 0 12 24 36Treatment duration (months)
0 500 1000 1500 q HB e A g ( P E I U/ m L ) 0 12 24 36
Treatment duration (months)
0.00 0.20 0.40 0.60 0.80 C u mu la ti ve p ro b a b ili ty o f H Bs Ag -l o ss 0 12 24 36
Treatment duration (months)
HBeAg-HBeAg+ -2.00 0.00 2.00 4.00 6.00 q HB sA g ( lo g 1 0 I U/ m L ) 0 12 24 36
Treatment duration (months)
HBeAg-HBeAg+