Publisher’s version / Version de l'éditeur:
Vous avez des questions? Nous pouvons vous aider. Pour communiquer directement avec un auteur, consultez la première page de la revue dans laquelle son article a été publié afin de trouver ses coordonnées. Si vous n’arrivez pas à les repérer, communiquez avec nous à [email protected].
Questions? Contact the NRC Publications Archive team at
[email protected]. If you wish to email the authors directly, please see the first page of the publication for their contact information.
https://publications-cnrc.canada.ca/fra/droits
L’accès à ce site Web et l’utilisation de son contenu sont assujettis aux conditions présentées dans le site LISEZ CES CONDITIONS ATTENTIVEMENT AVANT D’UTILISER CE SITE WEB.
Canadian Society of Civil Engineers. Hiroshi Tanaka Symposium on Wind
Engineering: 14 June 2011, Ottawa, Canada [Proceedings], pp. 1-8, 2011-06-14
READ THESE TERMS AND CONDITIONS CAREFULLY BEFORE USING THIS WEBSITE. https://nrc-publications.canada.ca/eng/copyright
NRC Publications Archive Record / Notice des Archives des publications du CNRC :
https://nrc-publications.canada.ca/eng/view/object/?id=b03055ad-848b-4776-a3cf-2bb7dde571bb
https://publications-cnrc.canada.ca/fra/voir/objet/?id=b03055ad-848b-4776-a3cf-2bb7dde571bb
NRC Publications Archive
Archives des publications du CNRC
This publication could be one of several versions: author’s original, accepted manuscript or the publisher’s version. / La version de cette publication peut être l’une des suivantes : la version prépublication de l’auteur, la version acceptée du manuscrit ou la version de l’éditeur.
Access and use of this website and the material on it are subject to the Terms and Conditions set forth at
Application of wind engineering for building envelope designs
Baskaran, B. A.
Applic a t ion of w ind e ngine e ring for building e nve lope de signs
N R C C - 5 4 4 5 8
B a s k a r a n , A .
J u n e 2 0 1 1
A version of this document is published in / Une version de ce document se trouve dans:
Canadian Society of Civil Engineers. Hiroshi Tanaka Symposium on Wind
Engineering, Ottawa, Canada, June-14-17, 2011, pp. 1-8,
http://www.nrc-cnrc.gc.ca/irc
The material in this document is covered by the provisions of the Copyright Act, by Canadian laws, policies, regulations and international agreements. Such provisions serve to identify the information source and, in specific instances, to prohibit reproduction of materials without written permission. For more information visit http://laws.justice.gc.ca/en/showtdm/cs/C-42
Les renseignements dans ce document sont protégés par la Loi sur le droit d'auteur, par les lois, les politiques et les règlements du Canada et des accords internationaux. Ces dispositions permettent d'identifier la source de l'information et, dans certains cas, d'interdire la copie de documents sans permission écrite. Pour obtenir de plus amples renseignements : http://lois.justice.gc.ca/fr/showtdm/cs/C-42
GCXXX-1
APPLICATION OF WIND ENGINEERING FOR BUILDING ENVELOPE
DESIGNS
Dr. A. Baskaran P.Eng; Group Leader
National Research Council, 1200 Montreal Road, Ottawa, ON, Canada, K1A OR6 Ph (613) 990-3616;Fax (613) 998-6802; Email: [email protected]
Abstract : Professor Tanaka’s contributions to bridge aerodynamics are well known to wind engineers
world-wide. Also known are pioneering studies conducted at various international laboratories under his supervision for many of the world’s milestone bridge structures. Tanaka also made significant contribution to the building envelope community through his novel ideas by blinding wind engineering principals with building science theories. The objective of this presentation is to highlight these hidden secrets to the Canadian Civil Engineers.
At the Institute for Research in Construction (formerly known as Division of Building research) – National Research Council (NRC–IRC), researchers collaborated with Tanaka. In respecting the page limitation of this paper, author presents only three of them as follows:
1. Wind resistance evaluation of roof assemblies 2. Wind load determination for roof assemblies 3. Wind pressure interaction with building stack effect
These respectively summarize research collaboration in 2000’s, 1990’s and 1980’s. Personally, author had the privilege of participating two of these research projects. Research findings resulted in the development of national standard by the Canadian Standards Association (CSA) and American Society of Heating, Refrigerating and Air-Conditioning Engineers (ASHRAE) design guidelines
1. Introduction
Canadian contribution to the wind engineering is not only well known to the Canadian Society of Civil Engineers (CSCE) but also to the international engineering community. So much so, given a wall of fame is created to wind engineers, Canadian research will dominate the wall. It is the CSCE members’ pioneering developments offered solutions to some of the classical wind engineering problems. It is not hard to list to them as follows:
• Late Alan Davenport (University of Western Ontario): Statistical description of the complex wind and wind induced loadings on buildings and structures.
• Peter Irwin (formerly with NRC – RWDI Consulting Engineers): Practical applications of wind engineering theories to the design of international buildings and structures.
• Bob Wardlaw and Kevin Cooper (NRC): Application of low speed wind aerodynamics to the vortex shedding.
• Alan Dalgliesh and Don Taylor (NRC): Field measurement of the wind loads and development of glass standards.
• David Surry and Nick Isyumov (University of Western Ontario): Pneumatic averaging techniques and force balance techniques of wind interaction measurements in the boundary layer wind tunnel.
It is hard to limit the above citation as many more are currently involved in advancing the state of the art. No doubt, the National Building Code of Canada (NBCC 2010) and its Part 4 Commentaries have benefited as these novel contributions translating into design guidelines and specifications. The global construction market recognized the leadership of Canadian Civil engineers through these knowledge acquisitions. Several international icon buildings and structures embraced Canadian engineering expertise in the design and construction process.
In this wall of fame, Hiroshi Tanaka takes a predominant place for his contributions to bridge aerodynamics and for his pioneering studies that were conducted under his supervision at various international laboratories. Equally, Tanaka made significant contribution to the building envelope community through his novel ideas by fusing wind engineering principals with building science theories. The objective of this presentation is to highlight these hidden secrets to the Canadian Civil Engineers. In respecting the page limitation of this paper, author presents only three of them as follows:
1. Wind resistance evaluation of roof assemblies 2. Wind load determination for roof assemblies 3. Wind pressure interaction with building stack effect
These respectively summarize research collaboration in 2000’s, 1990’s and 1980’s. Personally, author had the privilege of working with Tanaka in two of those research projects. Research findings resulted in the development of national standard by the Canadian standards associations and ASHRE design guidelines.
2. Wind Resistance Evaluation of Roof Assemblies
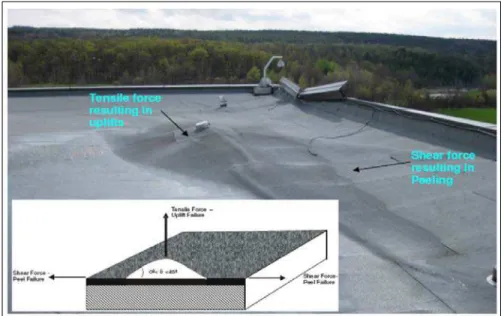
Wind uplift on Adhesive Applied Roofing System (AARS) induces both shear and tensile stresses on the roof components. Shear forces result in peeling failure, whereas tensile forces result in uplift failure. The shear and tensile force development is illustrated in Figure 1.Peeling failure is the single most common premature failure of AARS, and it leads to the loss of the watertight integrity of the AARS membrane (RICOWI 2006, 2007, 2010). Existing North American wind uplift standards [CSA A123.21 (2010), FM 4474 (2004) and UL 580 (2006)] mainly focus on mechanically-attached and fully-bonded roof assemblies. Little is known about the resistance of AARS against shear forces that are derived from the wind uplift, and there are currently no standards that can be used to evaluate the peel resistance of AARS.
θ
Towards development of a national standard, Tanaka proposed a simplified engineering hypothesis that “Higher resistance against tensile and shear force will result in the same or higher wind uplift resistance”. Under his supervision, three Masters and a Doctorial student developed methods to validate this hypothesis. This approach offered alternates design options for the industries partners.
2.1 Small scale experiments simulating tensile forces
A detailed comparative analysis by Current (2009) concluded the most appropriate conditions for simulating tensile forces, in order of importance, are (figure 2a):
• Tensile loading rate = 0.25 in/min (6.35 mm/min) • Specimen size = 12 in x 18 in (305 mm x 457 mm) • Attachment condition = fixed end conditions
2.2 Small scale experiments simulating shear forces
To simulate shear forces, a peel test method was developed by Wu (2009) (figure 2b): • Peeling rate = 1.0 in/min or 25.4 mm/min;
• Peeling angle = 15 degrees;
• The suggested sample curing time was 28 days after assembly.
2.3 Full-scale wind uplift test method
The full-scale test method simulates the wind uplift effects on AARS mock-ups. The full-scale experimental research on how to quantify the AARS wind uplift load resistance was carried out by Murty (2010). All experiments were carried out at the Dynamic Roofing Facility (DRF). Figure 2c displays the structure of the pressure chamber with a 16 ft x 32 ft (4.9 m x 9.8 m) table in which a 8 ft x 32 ft (2.5 m x 9.8 m) modified bitumen system was installed.
(a) Specimen ready for testing (b) Specimen ready for testing by simulating tensile forces by simulating shear forces
(c) Specimen ready for testing by simulating wind uplift forces
Figure 2. Experimental Setup Attachment Strip
Top Plate-Flanged Housing (for Steel Stress Plate) Specimen Mounting Platform Steel Stress Plate Crosshead Angle Controller Specimen Fixer
0.0 0.5 1.0 1.5 2.0
Uplift Peel Wind uplift
Sample 1 Sample 2
2.4 Experimental Configuration
Li (2010) carried out a major experimental investigation towards validating Tanaka’s hypothesis. This had been demonstrated using full-scale example in which the AARS had modified membrane as a waterproofing component. The roofing configuration includes a modified bitumen membrane (cap sheet and base sheet), a dense deck (DD) prime board and a steel deck. For Sample 1, the regular base sheet was integrated in the DD prime board with cold adhesive using the fully coated format. For Sample 2, the base sheet was self-adhered. A specific primer was rolled over the DD prime surface, then left to dry before laying the self-adhered base sheet. All other components were the same in both samples.
2.5 Validation of Hypothesis
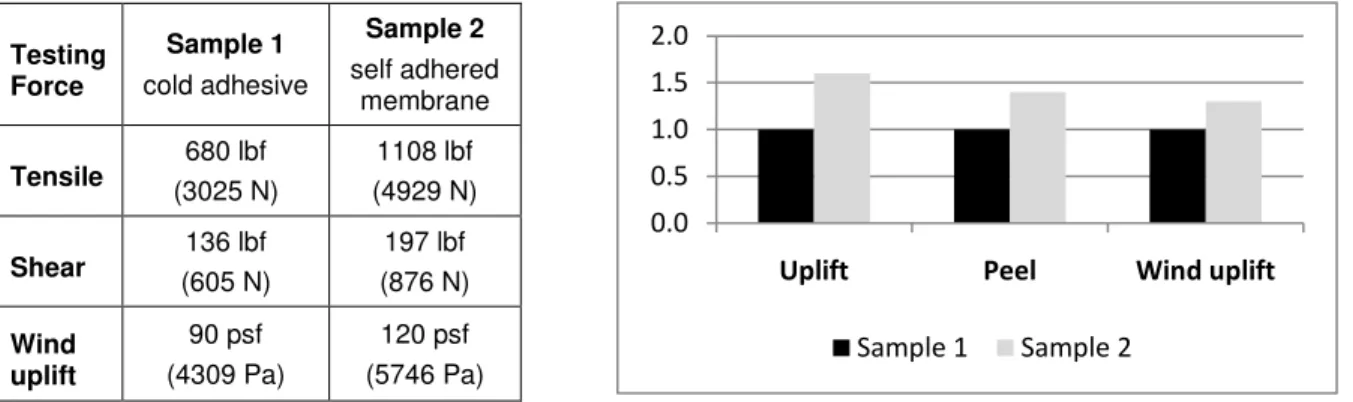
As shown in figure 3, for Sample 1, the mean resistance values obtained from the nine uplift resistance and nine peel test specimens are 680 lbf (3025 N) and 136 lbf (605 N), respectively. For the wind uplift testing, a rating of 90 psf (4309 Pa) or resistance of 60 psf (2872 Pa) [Resistance = Rating / Factor of Safety = 90/1.5 = 60 psf (CSA A123.21-10)] was obtained. For Sample 2, an increased mean value was obtained for the uplift resistance, peel and wind uplift resistance: 1108 lbf (4929 N), 197 lbf (876 N) and 80 psf (3830 Pa), respectively.
Figure 3: Resistance data tested by simulating tensile, shear and wind uplift forces
A resistance ratio of Sample 2 to Sample 1 for the quantitative comparison was developed and expressed by a column chart in figure 3. It normalizes the uplift resistance, peel and wind uplift resistances of Sample 1 to 1.0. The ratio of test results of Sample 2 is then calculated as the uplift resistance, peel and wind uplift resistance of Sample 2 divided by that of Sample 1. The trend can be clearly seen in figure 3: that the uplift resistance and peel resistances of Sample 2 are higher than that of Sample 1, when the self-adhered membrane is used instead of the cold adhesive bonded membrane.
The uplift resistance of Sample 2 was found 1.6 times higher than the uplift resistance of Sample 1; while its peel resistance was increased by 45% from 136 lbf (605 N) to 197 lbf (876 N). The dynamic wind uplift resistance of 80 psf (3830 Pa) for Sample 2 was 1.3 times higher than the original resistance of 60 psf (2872 Pa) for Sample 1.
This validates the hypothesis that “Higher resistance in both peel and uplift tests will result in the same or
higher wind uplift resistance”.
3. Wind Load Determination for Roof Assemblies
NBCC (2010), international building codes and wind load specifications standards derived the design values (pressure coefficients) mainly from the wind tunnel studies. In a wind tunnel, buildings were modelled using appropriated linear scale and wind is generated by following boundary layer flow simulation. The scale model is instrumented with pressure tapes to quantify the wind induced pressures.
A flat roof surface is known to be subjected to unusually high suction induced by a pair of “horse shoe” vortices caused by the wind coming diagonally facing a corner of the building (Kind and Wardlaw, 1979).
Testing Force Sample 1 cold adhesive Sample 2 self adhered membrane Tensile (3025 N) 680 lbf (4929 N) 1108 lbf Shear (605 N) 136 lbf (876 N) 197 lbf Wind uplift 90 psf (4309 Pa) 120 psf (5746 Pa)
Parapet Half Section Plexig lass Ins trum ent ation Pa nel Spliter Plate 240 m m 240 m m 1.5 mm 45 mm • • • • • • • • • • • • • • • • • • • • • • • • • • • • • • • • • • • • Wind (45°)
This phenomenon can cause very serious damages to the roofing system such as dislocation of concrete “pavers” or insulation boards. It is also known that some architectural features of the building such as the existence of parapets and their height would have some influence on these phenomena (Baskaran, 1986). At the same time, wind tunnel testing of this situation is a challenging task because the extent of damages depends a lot on the structural details, which can hardly be modelled properly in a reduced scale.
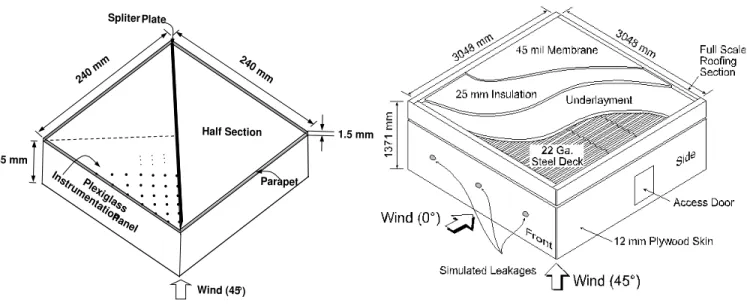
Tanaka made a proposal to improve the situation of scaling by simulating only a half or even smaller portion of the building for wind tunnel tests, which in turn could be carried out in much larger scale, even at nearly full scale, provided that exceptionally large wind tunnel facilities are available. The idea is reasonable considering the fact that the “horse shoe” vortex pattern of wind flow over the roof for the most critical case is nearly symmetric with respect to the 45o diagonal line along the mean wind. An important question, of course, is whether or not a good simulation of flow pattern can be achieved when only a portion of the structure is modelled. If indeed it is confirmed that the similar flow and pressure pattern can be experimentally obtained with a half building configuration, it becomes possible to have a very large building model with the scale of 1/2 or even 1/1 in the NRCC 9m x 9m wind tunnel. Then it becomes also possible to examine the effectiveness of the structural details against the wind action.
What is presented here is a pilot study regarding this issue. A 1/10 scaled model of the building previously tested in the NRCC 9m x 9m wind tunnel (Kind, Savage & Wardlaw 1988) was constructed with a further reduction in scale to 1/100 in a smaller wind tunnel, the 0.9m x 0.9m wind tunnel which in fact is a 1/10 scaled model of the 9m x 9m tunnel, and was tested, first of all, to make sure that the same pressure pattern can be reproduced in this scale (figure 4). Then the same model was reduced from a whole building to a half of it (figure 5) to examine if the wind induced pressure pattern in the critical area of the roof would remain the same. Finally, two larger scales, 1/37.5 and 1/21, were introduced to examine the consistency of results in different linear scales. When the building model is constructed in larger scales, the building height becomes a new problem since the wind tunnel blockage becomes too excessive and a correction in one way or another would be required.
Figure 4. Full-roof and a half-roof of a full-scale model configurations
It is understood that testing full-scale roof components is an optimistic extension and it should be given some careful second thoughts. For example, when the building model is constructed in a very large scale such as 1/2 or 1/1, it may not be possible to simulate the building height with the same linear scale because the wind tunnel blockage would become too excessive. On the other hand, if the building height is reduced, the resulted roof pressure may not be the same. Another correction is needed to account for the building aspect ratio effect that can be treated separately or it may have to be combined with the blockage effect (Ghariani, 1991). Nevertheless, it still is useful to obtain data with 1/1 scale model for all
practical purposes. By taking Tanaka’s novel idea, SIGDERS (Special Interest Group for Dynamic Evaluation of Roofing Systems) composed of roofing industries, manufacturers, associations and building owners, enhanced a wind load determination method on flat roofs (www.sigders.ca).
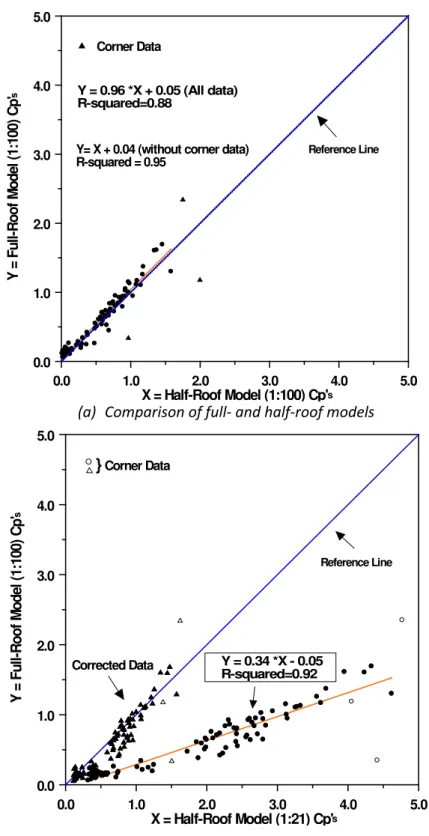
(a) Comparison of full- and half-roof models
(b) Comparison of 1/100 and 1/21 scale roof models
Figure 5: Effect of model scale on the measured roof pressure coefficients
0.0 1.0 2.0 3.0 4.0 5.0 X = Half-Roof Model (1:100) Cp' 0.0 1.0 2.0 3.0 4.0 5.0 Y = F u ll-R o o f M o d e l (1 :1 0 0 ) C p ' Y = 0.96 *X + 0.05 (All data) R-squared=0.88
Y= X + 0.04 (without corner data) R-squared = 0.95 Corner Data Reference Line s s 0.0 1.0 2.0 3.0 4.0 5.0 X = Half-Roof Model (1:21) Cp' 0.0 1.0 2.0 3.0 4.0 5.0 Y = F u ll-R o o f M o d e l (1 :1 0 0 ) C p ' Y = 0.34 *X - 0.05 R-squared=0.92 Corrected Data Corner Data Reference Line s s
4. Wind Induced Pressure Interaction with Building Stack Effect
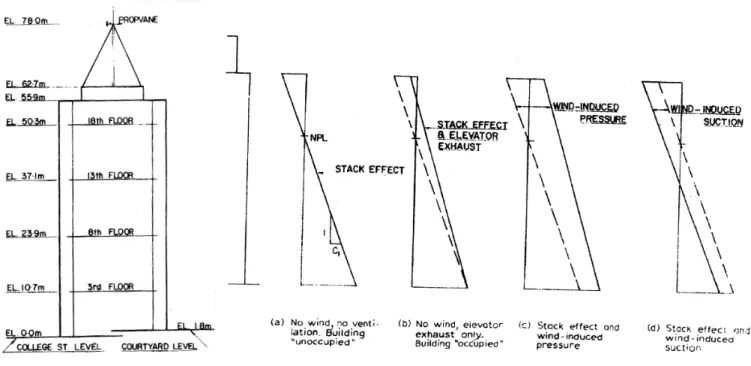
Very few researchers quantified the contribution of various pressure differences across a building envelope. In 1980’s, an extensive field measurements was completed by Tanaka’s research group (Lee et al 1982). The measurements were made continuously for 5 months from November 1980 to March 1981 on a building located in the Ottawa down town (figure 6). A difference between the internal and external pressures on a building can be caused by various factors. Three sources are considered here, namely: (i) Wind-induced external and internal pressures; ii) Natural ventilation caused by temperature differences, the so-called stack effect; and (iii) Forces or mechanical ventilation systems. The analysis of the data measured in this study is carried out on the assumption that the total pressure difference ∆p is
given by linear summation of the three kinds of pressure differences, i.e.:
[1] ∆p = (∆p)w + (∆p)s + (∆p)v
where ∆p is the total pressure difference across the wall, (∆p)w, s is the pressure difference caused by wind action (∆p)s is the pressure difference caused by the stack effect, and (∆p)v is the pressure difference caused by mechanical ventilation.
Figure 6. Various Pattern of pressure-difference profile across the building envelope.
The stack effect was found to be one of the major causative factors in the mean pressure difference across the building enclosure throughout the winter season. Its magnitude, in this particular set of measurements at the lower levels of the building was as high as 70-80Pa. This is comparable to the wind-induced positive pressure at a local mean wind-speed of ~12m s-1.
5. Concluding Remarks
This paper highlighted Tanaka’s major contributions to the building envelope design. These novel ideas exemplify how wind engineering principles can be fused with building science theories to provide a safer and economical building environment.
6. References
Baskaran, A. (1986). Wind loads on flat roofs with parapets. M.Eng.Thesis, Concordia University, Canada CSA Number A123.21-10 (2010). Standard test method for the dynamic wind uplift resistance of
membrane-roofing systems. Canadian Standards Association, Canada
Current, J. (2009). Development of a Uplift resistance Test Method for Adhesive Applied Roofing
Systems. M.A.Sc. Thesis, Department of Civil Engineering, University of Ottawa, Ottawa, Ontario
Dalgliesh, W.A., Taylor, D.A. (1990). The Strength and testing of window glass. Canadian Journal of Civil
Engineering 17:5 pp.752-762
Factory Mutual Research (2004). Approval standard: class I roof covers (FM-4474). FM, Norwood, Massachusetts
Ghariani, S. (1991). Experimental study of wind induced suction on flat roofs. M.A.Sc. Thesis, University of Ottawa, Canada
Irwin, Peter (2010). Wind Issues in the Design Building Facades. International Conference on Building
Envelope Systems and Technologies (ICBEST) 2010. National Research Council Canada, Ottawa,
Ontario, Canada, Volume 2:285
Kind, R.J. (1986). Worst suctions near edges of flat rooftops on low-rise buildings. Journal of Wind
Engineering & Industrial Aerodynamics, 25: 31-48
Kind, R.J., M.G. Savage & R.L. Wardlaw (1988). Prediction of wind-induced failure of loose laid roof cladding systems. Journal of Wind Engineering & Industrial Aerodynamics 29: 29-37.
Li, Weihong (2010). Adhesive Applied Roofing Systems – Resistance Evaluation and Quantification. M.A.Sc. Thesis, Department of Civil Engineering, University of Ottawa, Ottawa, Ontario, Canada Lee, Y.; Tanaka, H.; Shaw, C.Y. (1982), “Distribution of wind- and temperature-induced pressure
differences across the walls of a twenty-storey compartmentalised building”, Journal of Wind
Engineering and Industrial Aerodynamics, 10, (3), pp. 287-301. 1982-12
Murty B., (2010). Wind Uplift Performance Evaluation of Adhesive Applied Roofing Systems. Ph.D. Thesis, Department of Civil Engineering, University of Ottawa, Ottawa, Canada
NBCC (2010). National Building Code. Canadian Commission on Building and Fires Codes, National Research Council of Canada, Ottawa
NBCC (2010). National Building Code User’s Guide – Part 4 – Structural Commentaries. Canadian Commission on Building and Fires Codes, National Research Council of Canada, Ottawa
RICOWI, (2010). Hurricane IKE wind investigation report, powder springs, and Georgia. Roofing Industry Committee on Weather Issues, Inc., McDonough, Georgia, pp. 1-387
RICOWI, (2007). Hurricane Katrina wind investigation report, powder springs, and Georgia. Roofing Industry Committee on Weather Issues Inc., McDonough, Georgia, pp. 1-183
RICOWI, (2006). Hurricanes Charley and Ivan wind investigation report. Roofing Committee on Weather Issues Inc., McDonough, Georgia, p. 1-286
Savage, M.G, K.R. Cooper & A. Baskaran (1997). Wind tunnel investigation of the wind loads on a single
ply mechanically attached PVC roofing system. LTR-A-012, National Research Council Canada
Stathopoulos. T. (1995). Evaluation of Wind Loads on Low Buildings – a Brief Historical Review, A State-of-the-Art in Wind Engineering. International Association for Wind Engineering, Wiley Eastern Limited, New Delhi
Surry, D. (1999). Wind loads on low-rise buildings: past, present and future. Proceedings of the 10th
International Conference on wind Engineering, Copenhagen, Denmark, June 20-24
Tanaka, H., Ghariani, S., Baskaran, B.A., Savage, M.G. (1999). Wind pressure measurements on flat roofs using scaled models. 10th International Conference on Wind Engineering into the 21st Century,
Volume 2:195-1202
Underwriters Laboratories Inc. (2006). UL standard for safety tests for uplift resistance of roof assemblies (UL-580). Underwriter Laboratory of Canada, Toronto,
Wu, J, (2008). Development of a Peel Test Procedure for Adhesive Applied Roofing Systems. M.A.Sc. Thesis, Department of Civil Engineering, University of Ottawa, Ottawa, Ontario