HAL Id: insu-02892082
https://hal-insu.archives-ouvertes.fr/insu-02892082
Submitted on 11 Mar 2021HAL is a multi-disciplinary open access L’archive ouverte pluridisciplinaire HAL, est
Single-cell determination of iron content in
magnetotactic bacteria: implications for the iron
biogeochemical cycle
Matthieu Amor, Mickaël Tharaud, Alexandre Gélabert, Arash Komeili
To cite this version:
Matthieu Amor, Mickaël Tharaud, Alexandre Gélabert, Arash Komeili. Single-cell determination of iron content in magnetotactic bacteria: implications for the iron biogeochemical cycle. Environmen-tal Microbiology, Society for Applied Microbiology and Wiley-Blackwell, 2019, 22 (3), pp.823-831. �10.1111/1462-2920.14708�. �insu-02892082�
Komeili Arash (Orcid ID: 0000-0003-1554-4935)
Single-cell determination of iron content in magnetotactic bacteria:
implications for the iron biogeochemical cycle
Matthieu Amora*, Mickaël Tharaudb, Alexandre Gélabertb, Arash Komeilia,c
a
Department of Plant and Microbial Biology, University of California, Berkeley, CA 94720-3102
b
Institut de Physique du Globe de Paris, Sorbonne Paris Cité, Univ. Paris Diderot, UMR 7154 CNRS, 1 rue Jussieu, 75238 Paris, France
c
Department of Molecular and Cell Biology, University of California, Berkeley, CA 94720-3200
*Corresponding author: Matthieu Amor
261A Koshland Hall, Berkeley CA 94720, USA phone: +1 510 332 1730
email: amor@berkeley.edu
Running title: Magnetotactic bacteria are important players of iron cycling
Keywords:
Magnetotactic bacteria; single-cell – inductively coupled plasma – mass spectrometry; iron biogeochemical cycleOriginality – Significance statement
Magnetotactic bacteria (MTB) are the only known bacterial species that form intracellular iron crystals in a genetically controlled manner and are observed in all aquatic environments. When the bacteria die, their crystals can be trapped into sediments and the iron they contain is, at least temporally, lost from the environment. MTB could thus prevent other organisms from accessing iron, which is an essential nutrient. To determine whether MTB significantly impact iron in the environment, we developed a mass spectrometry methodology to quantify the iron content in individual bacterial cells cultivated in the laboratory. We then show that MTB populations in the environment may incorporate a mass of iron that is of the same order of magnitude as the amount of bioavailable iron delivered to the ocean.
Summary
Magnetotactic bacteria (MTB) are ubiquitous aquatic microorganisms that mineralize dissolved iron into intracellular magnetic crystals. After cell death, these crystals are trapped into sediments which removes iron from the soluble pool. MTB may significantly impact the iron biogeochemical cycle, especially in the ocean where dissolved iron limits nitrogen fixation and primary productivity. A thorough assessment of their impact has been hampered by a lack of methodology to measure the amount of, and variability in, their intracellular iron content. We quantified the iron mass contained in single MTB cells of Magnetospirillum magneticum strain AMB-1 using a time-resolved inductively coupled plasma – mass spectrometry methodology. Bacterial iron content depends on the external iron concentration, and reaches a maximum value of ~10-6 ng of iron per cell. From these results, we
calculated the flux of dissolved iron incorporation into natural MTB populations and conclude that MTB may mineralize a significant fraction of environmental dissolved iron into crystals.
Introduction
Iron is one of Earth’s most abundant element and an essential constituent for all living organisms. Before the Great Oxidation Event ~2.5 Ga ago, the atmosphere and hydrosphere redox state was such that iron could accumulate in the hydrosphere as soluble reduced Fe(II) species, thus available to living organisms for metabolic purposes (Lyons et al, 2014). Later, oxygen accumulation at the Earth surface led to Fe(II) oxidation into insoluble Fe(III) and a dramatic decrease in the concentration of bioavailable iron (Knoll and Nowak, 2017). Biological organisms adapted to these changing environmental conditions by developing new strategies for accessing iron to sustain their metabolic activity, e.g. secreting soluble organic compounds binding iron. Indeed, although nitrogen and phosphorus are usually considered to be the nutrients limiting biomass production, iron has been demonstrated to limit nitrogen fixation and primary production in large open “High Nutrient, Low Chlorophyll” ocean surfaces (Coale et al, 2004; Martínez-García et al, 2014). Iron fertilization in these regions, as well as in laboratory experiments, leads to higher primary production and chlorophyll content (e.g. Coale et al, 2004; Jacq et al, 2014; Martínez-García et al, 2014). Dissolved iron concentration in the ocean may thus control carbon and nitrogen fixation into the biomass, even though negative feedbacks canceling out enhanced primary productivity have been discussed (Aumont and Bopp, 2006).
Magnetotactic bacteria (MTB) are ubiquitous microorganisms observed in all types of modern aquatic environments (oceans, rivers, lakes, lagoons…). MTB, which can represent up to 30% of the total microbial biomass in some microhabitats (Lin et al, 2014), take up dissolved iron from their environment and precipitate it as intracellular nanoparticles of magnetite [Fe(II)Fe(III)2O4] or greigite
[Fe(II)Fe(III)2S4] via a genetically controlled pathway (Uebe and Schüler, 2016). Magnetite or greigite
crystals are arranged as chains inside the cell, and provide the bacteria with a magnetic dipole for navigation purposes (Uebe and Schüler, 2016). In sediments or water column, MTB are markers of oxic/anoxic transition zones (OATZ) where the concentration of dissolved iron is at its maximum (Kopp and Kirschvink, 2008; Lefèvre et al, 2013). MTB have been proposed to represent some of the most ancient organisms capable of biomineralization, with an origin dating back to at least 3 Ga (Lin et
al, 2017). Although MTB are ubiquitous on Earth, their impact on the past and modern biogeochemical
cycling of metallic elements is still poorly constrained. The significance of MTB rises from their capacity to sequester dissolved iron in crystals. When the cells die, the magnetite and greigite crystals are trapped into sediments (Chen et al, 2014a). Therefore, MTB potentially lower the concentration of dissolved iron in aquatic environments such as oceans and prevent other organisms from accessing an available pool of iron.
Previous works proposed to quantify the total mass of iron contained in natural MTB populations to assess their impact on the iron biogeochemical cycle (Simmons and Edwards, 2006; Lin et al, 2014) but some parameters required for such estimations are still unknown. The critical step for quantifying the role of MTB on the iron biogeochemical cycle is to determine their iron content. To date, no analytical methodology can achieve the measurement of bacterial iron mass at the cellular level. The mass of iron in a single magnetotactic cell has mainly been estimated from measurement of the volume of magnetite observed with electron microscopy (e.g. Simmons et al, 2007; Lin et al, 2014). Iron isotope studies of MTB suggested that a large fraction (~50%) of the total cellular iron could be located in a reservoir distinct from magnetite (Amor et al, 2016, 2018), such that the mass of magnetite in
MTB cells is not an accurate estimate of the total mass of iron they contain. Iron levels in MTB populations have been previously estimated (Schüler and Baeuerlein, 1998). However, these measurements at the population level may be prone to biases. Furthermore, they do not provide any information on the cell-to-cell variations in iron content across a given population. Recently, time-resolved Inductively Coupled Plasma – Mass Spectrometry has drawn interest for single-cell characterization of biological samples. Instead of a measurement of bulk cellular iron dissolved in acid solutions, this technique allows for the introduction of whole intact cells to the plasma for the detection of their corresponding ionized iron clouds, each corresponding to the content of an individual cell. Such mass spectrometry technique enables the analysis of a large number of cells corresponding to a given population (e.g. 104 cells per milliliter of solution in the present study), thus providing strong statistical insights. It has been used for analyses of large eukaryotic cells, but only a handful of bacterial characterizations have been carried out in which iron was not detected (Miyashita et al, 2014). In the present study, we performed Single-Cell – Inductively Coupled Plasma – Mass Spectrometry (SC-ICP-MS) measurements to determine the mass of iron contained in cells of the magnetotactic bacterium Magnetospirillum magneticum strain AMB-1 cultivated at different initial iron concentrations. Bacterial iron content ranged between ~0.5 and 1 10-9 ng/cell. The length of magnetite crystals produced by AMB-1 strongly correlated with both external iron concentration and bacterial iron content. Using these experimental findings, we estimate that environmental MTB populations incorporate a significant amount of iron which may be equivalent in magnitude to iron inputs into oceans (Fante and DePaolo, 2004).
Results
Iron content in single AMB-1 cells
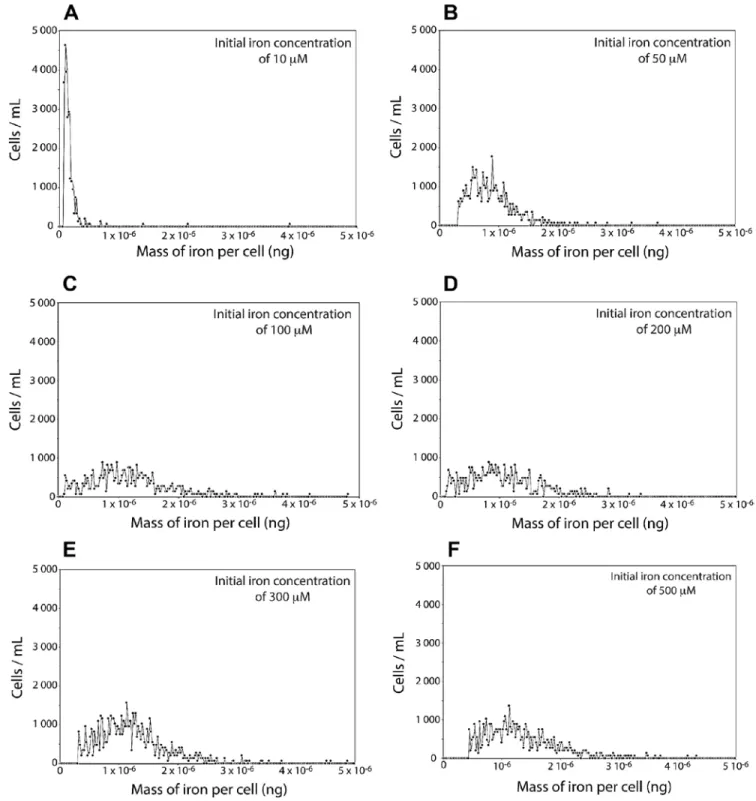
AMB-1 was cultivated at initial iron concentrations ranging between 10 and 500 µM for two or four days (see supplementary materials). After cultures, cells were recovered and washed three times using a phosphate buffer (PBS) to remove iron potentially adsorbed on the cell surfaces. We ensured that no iron leaked outside of the cells before analyses, and the iron mass balance of the experiments was checked to demonstrate that all iron fractions were recovered. Bacteria were then analyzed for their iron content. All experiments were carried out in triplicates. The distributions of iron content in the different AMB-1 populations showed contrasting patterns depending on the initial iron concentration conditions (Fig. 1). Data were consistent after 2 and 4 days of culture for a given initial iron concentration in the external solution. At 10 µM of iron in the external medium, bacterial iron content showed low variability between the different cells (Fig. 1A). The mass of iron per cell ranged from ~0.07 × 10⁻⁶ to 0.7 × 10⁻⁶
ng/cell (table S1). The variability between cells increased at higher initial iron concentration in the growth medium, with cellular iron content ranging from ~0.2 × 10⁻⁶ to 2 × 10⁻⁶ ng/cell at 50 µM, and ~0.1 × 10⁻⁶ to 2 × 10⁻⁶ ng/cell at 100 µM. For higher initial iron concentrations in
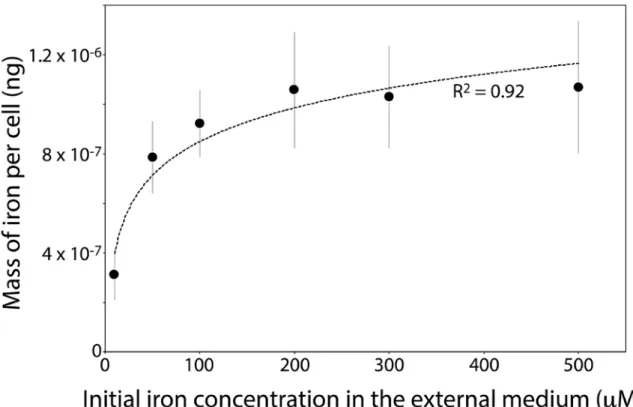
the external medium, distribution and variability patterns of bacterial iron contents were similar to the 100 µM condition. From the distributions shown in figure 1, we calculated a mean bacterial iron content in AMB-1 populations corresponding to each experimental condition. The mass of iron incorporated into AMB-1 cells showed a logarithmic increase with increasing external iron concentration (Figs. 1, 2 and table S1). Mean values ranged between ~0.35 × 10⁻⁶ and 1.20 × 10⁻⁶
ng/cell when bacteria were cultivated for two days. Cellular iron content was similar after four days of culture, although consistent lower values were observed (Fig. S1 and table S1). This observation indicates that some bacterial iron could be lost during growth in culture, a finding in good agreement with previous studies that proposed Fe(II) diffusion between the bacterial internal medium and the external solution (Amor et al, 2018). The maximum bacterial iron content was reached at 100 µM of iron in the initial external medium, with a mass of iron per cell of ~1 ×10⁻⁶ ng/cell, and no increase in intracellular iron was observed for higher initial iron concentrations (Fig. 2).
Iron content in mutant AMB-1 cells unable to form magnetosomes
We next wanted to determine whether iron uptake is strictly linked to magnetite biomineralization, or if a potential additional iron pool, distinct from magnetite, exists in AMB-1. Magnetosome formation and magnetite precipitation in AMB-1 require ~30 genes that are necessary and sufficient for biomineralization, and are contained in a specific portion of the genome called the magnetosome gene island (MAI) (Uebe and Schüler, 2016). We used a mutant AMB-1 strain lacking MAI (∆MAI strain), which is unable to form magnetosomes and shows no magnetic-sensitive behavior (Murat et al, 2010) (see supplementary materials). This mutant AMB-1 strain was cultivated in the same experimental conditions as the wild-type strain, and analyzed for its iron content. Iron content distributions in ∆MAI bacteria were similar in all experimental conditions, although the number of cells detected by the spectrometer was lower compared to wild-type AMB-1 (Fig. S4, table S3). This could be explained by two hypotheses: (i) the iron content in some of the ∆MAI cells was below the detection limit (i.e. 1.75 × 10⁻⁸ ng/cell, see supplementary materials), or (ii) a more efficient growth for non-mutant cells
compared to the ∆MAI AMB-1. Growth curves for the two strains indicated consistently higher optical densities (OD) for the non-mutant bacteria (table S4). Direct cell counting using a hemocytometer showed that, for a similar optical density (OD) of 0.2, the cell densities were 3.90x10⁸ ± 7.76x10⁷ and 3.25x10⁸ ± 8.40x10⁷ cells/mL for the wild-type and ∆MAI strains, respectively. This demonstrates that nearly wild-type cells were detected by the SC-ICP-MS, as almost identical values were measured by the mass spectrometer (table S3). It also indicates that similar cell densities for the two strains should give similar OD values. Therefore, the discrepancy in OD between the wild-type and mutant AMB-1 cultures should account for the difference in cell number we measured using the mass spectrometer. The mutant AMB-1 showed up to ~10 fold lower cell numbers compared to the wild-type, whereas OD values were only 15 to 30% lower than wild-type for the mutant strain. This demonstrates that some mutant cells were not detected by the mass spectrometer, likely because of their low iron content (below the detection limit of 1.75x10⁻⁸ ng/cell). Nevertheless, the mean mass of iron in ∆MAI cells ranged between 1.73 × 10⁻⁷ and 5.08 × 10⁻⁷ ng/cell (table S3), corresponding to 20-40% of the mass of iron contained in non-mutant cells (Fig. S4). This shows that AMB-1 cells unable of forming magnetosomes can still incorporate a significant mass of iron.
The low number of cells detected in the ∆MAI cultures compared to the wild-type raises the question of applicability of the SC-ICP-MS methodology to non-magnetotactic strains. The number of iron atoms in Escherichia coli was estimated to range between 105 and 106 atoms per cell (Andrews et al, 2003). This corresponds to a mass of iron ranging between of 9x10⁻⁹ and 9x10⁻⁸ ng/cell, which is ~5 to 10-fold lower than the mass we measured in the ∆MAI cells. This methodology is thus likely not appropriate for analysis of wild-type E. coli cells, but could be able to measure the iron content in
mutant strains that has been engineered to accumulate iron. Iron-metabolizing bacteria [i.e. Fe(III)-reducing and Fe(II)-oxidizing bacteria] that mineralize iron into crystals, as well as bacteria forming iron-storing organelles called ferrosomes (Byrne et al, 2010), also accumulate intracellular iron and are of interest for single-cell analyses. The development of more sensitive detectors will broaden the application of SC-ICP-MS.
Magnetite length as a proxy for external iron concentration and bacterial iron content
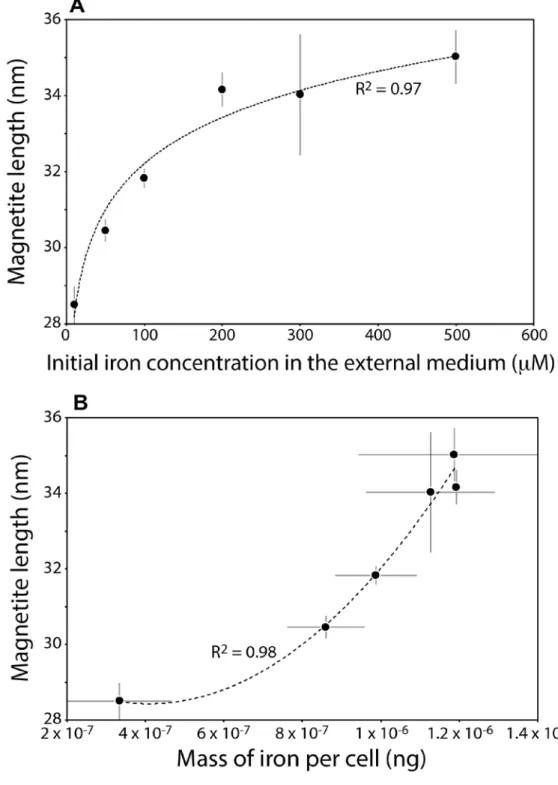
Magnetite length strongly correlated with both external iron concentration and the mass of iron in bacteria (Fig. 3). The mean size of magnetite nanoparticles measured with transmission electron microscopy (see supplementary materials) increased from 28.5 ± 0.5 nm in AMB-1 cells cultivated at an initial iron concentration of 10 µM to 35 ± 0.7 nm when bacteria were cultivated at 500 µM (table S2), corresponding to an average intracellular iron content of ~0.35 × 10⁻⁶ and 1.20 × 10⁻⁶ ng/cell, respectively. The magnetite length was logarithmically correlated with the external initial iron concentration, whereas it showed an exponential-like increase with increasing bacterial iron content (Fig. 3). The general picture of iron cycling in AMB-1 suggests that iron is first transported to the additional iron pool, distinct from magnetite, before its precipitation in magnetosomes (Amor et al, 2018). Our results are in good agreement with this model, as they indicate a delay in magnetite precipitation as iron incorporation in AMB-1 increases.
Discussion
environmental MTB populations (MMTB) by utilizing the MTB concentration in various aqueous
environments (CMTB), the global volume of water hosting MTB (VMTB) and the mass of iron in MTB
cells (MFe):
𝑀𝑀𝑇𝐵 = 𝑀𝐹𝑒 𝐶𝑀𝑇𝐵 𝑉𝑀𝑇𝐵 (Eq. 1)
The concentration of MTB is different between freshwater (105 ≤ CMTB ≤ 107 cells/cm3), seawater (103
≤ CMTB≤ 105 cells/cm3), and estuaries (104≤ CMTB≤ 107 cells/cm3) (e.g. Blakemore, 1982; Spring et al,
1993; Bazylinski et al, 1995; Simmons et al, 2004; Flies et al, 2005; Simmons et al, 2007). The volume of water containing MTB (VMTB) can be expressed as the sum of the surfaces of freshwater (4.16 × 10¹⁶
cm2), seawater (3.63 × 1018 cm2) or estuaries (1.1 × 1016 cm2) (Downing et al, 2006; Regnier et al, 2013; Cogley, 2012), multiplied by the thickness of OATZ. For a 1-cm thick OATZ, VMTB
corresponding to the freshwater, seawater and estuaries is of 4.6 × 10¹⁶, 3.6 × 10¹⁸
and 1 × 1016 cm3, respectively.In order to calculate the most conservative estimates of MMTB, we considered the lowest
mass of iron per cell we measured in AMB-1 (i.e. ~0.5 × 10⁻⁶ ng/cell, corresponding to an initial iron concentration of 10 µM). Analyses of AMB-1 cells cultivated with no iron added to the growth medium showed similar values to the 10 µM condition (see supplementary materials, table S5), showing that 0.5 × 10⁻⁶
ng/cell is an appropriate conservative estimate of bacterial iron content. The dissolved iron concentration in the ocean is also low, but MTB observed in marine environments show chains of magnetite containing 10-20 crystals as in AMB-1 (Liu et al, 2017). MMTB can thus be
estimated for MTB populations in freshwater (2.5 × 10³ ≤ M
MMTB ≤ 2 × 10⁵ kg), and estuaries (6 × 101 ≤ MMTB ≤ 3 × 10⁴ kg).To convert this mass estimate into a
flux, we use a turnover time of MTB populations of 2 days measured in environmental bacteria (i.e. corresponding to the time needed for doubling the total mass of iron incorporated by MTB populations) (Simmons and Edwards, 2006), leading to a flux of iron processed by MTB of 4 × 10⁵ ≤ MMTB ≤ 4 ×
107 kg per year for freshwater, 3.3 × 10⁵ ≤ MMTB ≤ 3.3 × 10⁷ kg per year for the ocean, and 104 ≤ MMTB
≤ 5 × 10⁶ kg per year for estuaries. Shorter turnover times were proposed for natural MTB populations (i.e. one division every twelve hours for each cell), but they may correspond to an exponential phase of growth that is probably not representative of natural environments (Moench and Konetzka, 1978). Longer turnover times (i.e. ~7 days) have been observed for sulfate-reducing MTB (Lefèvre et al, 2011). Considering a 7-day turnover time would lead to a 3.5-fold decrease of the lower limit in our estimations: 1.15 x 10⁵, 1 x 10⁵ and 0.3 x 10³ kg per year for freshwater, the ocean and estuaries, respectively. Finally, the OATZ thickness in which MTB thrive has to be taken into account. In various environmental settings, MTB populations were observed to span over a few-meter thick OATZ (Simmons et al, 2004; Simmons et al, 2007; Chen et al, 2014a; Rivas-Lamelo et al, 2017). Therefore, our estimate of the flux of iron processed each year by MTB is most likely conservative. Using thicker estimates for the OATZ in estuaries in which MTB thrive (i.e. up to a few meters) (Simmons et al, 2004, 2007; Chen et al, 2014a), the flux of dissolved iron incorporated by MTB increases up to 1.5 × 10⁵≤ MMTB≤ 2.5 × 10⁸ kg per year (50-cm thick OATZ) and 0.3 x 10⁵≤ MMTB≤ 5 × 10⁸ kg per year
(1-m thick OATZ) kg/yr. We also note that AMB-1 produces less nanoparticles (~15 per cell) than MTB observed in natural environmental settings which can produce up to five hundred nanocrystals per cells, including greigite-forming MTB (Simmons et al, 2007). This reinforces the conservative
character of our estimate, and shows that AMB-1 is appropriate to model natural samples. Lin and collaborators proposed a conservative estimate of iron uptake by lacustrine and world MTB of 2 × 10⁶ and 1 × 10⁸ kg per year, respectively, which falls within our estimates (Lin et al, 2014).
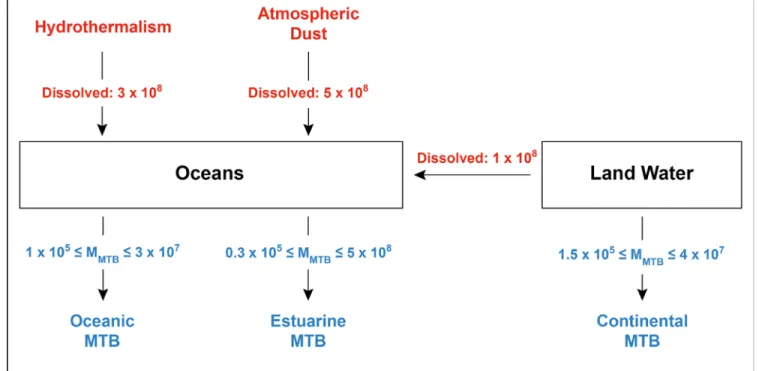
Finally, to assess the impact of MTB populations on the iron biogeochemical cycle, we compared our results with the main three inputs of dissolved iron to the oceans (Fig. 4): rivers (~ 1.5 × 10⁸ kg/yr), hydrothermalism (~3 × 10⁸ kg/yr), and atmospheric dust (~5 × 10⁸
kg/yr) (Fantle and DePaolo, 2004). Given that we consider only the most conservative estimations, this shows that MTB can incorporate a significant fraction of the mass of dissolved iron transported to the ocean. In estuarine environments, the estimated mass of dissolved iron incorporated by bacteria corresponds to ~1-500 % of the mass of dissolved iron transported by the rivers. MTB could thus act as a sink of iron in these environments and prevent accumulation of riverine dissolved iron in the ocean (Chen et al, 2014a). We note that dissolved iron corresponds to a small fraction of the total iron transported by rivers (less than 1%; see Fantle and DePaolo, 2004). Iron mineral phases could thus dilute MTB nanoparticles in sediments, although magnetite and greigite crystals likely produced by MTB have been magnetically identified in estuarine samples (Chen et al, 2014a; Ouyang et al, 2017).
Conclusion
In sum, chemical and microbial data show that MTB may play an important role by transferring a significant fraction of dissolved, bioavailable iron to stable solid phases in sediments (Fig. 4). This precipitation flux could limit primary production in oceanic regions. Given that a significant fraction of iron is not precipitated as magnetite or greigite in MTB, it remains to be determined whether some of
the iron assimilated by bacteria can be released to the environment after the cell death. This fraction could correspond to iron associated with organic compounds that include proteins. Iron isotope work on MTB showed a specific enrichment in heavy isotopes of the iron fraction associated with these proteins (Amor et al, 2016, 2018), in good agreement with iron isotope data obtained from environments in which MTB populations were observed (Ilina et al, 2013; Chen et al, 2014b) 32). This suggests that MTB could control partly the dissolved iron isotope budget in the environment, and that iron isotopes could be used as a tool for probing iron released and/or precipitated by MTB. In the future, direct measurements of the division times of environmental MTB populations and a more accurate picture of the biogeography of their distribution will yield a more accurate estimate of the impact of MTB on environmental fate and cycling of iron.
Material and methods
Magnetospirillum magneticum AMB-1 cultures
Magnetospirillum magneticum AMB-1 (ATCC700264) was cultivated in 10 mL tubes following
ATCC recommendations at 30°C under a controlled atmosphere (10% 02, 90% N2) for two or four
days. The sole iron source used in our experiments was Fe(III)-citrate added to the growth medium at 10, 50, 100, 200, 300 or 500 μM. In all experiments, the growth medium volume and citrate concentration were kept constant. After cultures, AMB-1 cells were recovered by centrifugation (8 000
g, 10 min). The cells were then washed three times in phosphate buffer (PBS) to remove iron from the growth media and Fe sorbed on the cell surfaces.
Transmission Electron Microscopy
Cells were deposited on copper grids coated with a Formvar film, and characterized with a FEI Tecnai 12 transmission electron microscope operating at 120 kV. Magnetite length was measured using the ImageJ software. Images in Fig. S1 were acquired at a magnification of ~4 500, but magnetite length was measured at a magnification of ~6 500 or ~9 500.
Mass spectrometry analyses
Using the rapidity, selectivity and sensitivity of ICP-MS, single particle ICP-MS is becoming a powerful technique for the simultaneous determination of the concentration, the size and the composition of nanoparticles (NPs) (Tharaud et al, 2017). Succinctly, a solution containing NPs is nebulized into the plasma. Each NP forms an ion cloud sampled by the mass spectrometer and finally collected by the detector. At millisecond dwell times, the ion cloud produces a signal pulse, whose intensity is directly related to the number of ions in the cloud and therefore to the mass of the NP. Also, assuming constant nebulization efficiency, the number of detected pulses is directly related to the number of particles in the sample. In practice, with an external calibration (intensity vs mass) using corresponding dissolved metal standards of known concentration, the intensity of the pulse is converted to mass using the slope, the y-intercept and the nebulization efficiency. Note that the nebulization efficiency is calculated as followed (Pace et al, 2011) using AuNPs as reference:
𝜂𝑛𝑒𝑏𝑢𝑙𝑖𝑧𝑎𝑡𝑖𝑜𝑛= 𝑑𝐴𝑢𝑁𝑃𝑠
3𝑆 𝐴𝑢𝑓𝑎𝜋𝜌
where dAuNPs is the AuNPs mean diameter, SAu is the slope of the external calibration for gold, fa is the
mass fraction of the targeted element in the NPs (fAuNPs = 1), ρis the density of the NPs (ρAuNPs = 19.3
kg/cm3), IAuNPs is the average signal of the NPs, IAu is the dissolved signal of gold, td is the dwell time
and qliq is the flow rate.
Based on this concept, the Single-Cell-ICP-MS (Mueller et al, 2014) allows the determination of the content of each cell one at a time. Indeed, assuming that the cell is sufficiently concentrated in analyte and remains intact during the nebulisation process, the cell content also produces an ion cloud that is detected at the end of the mass spectrometer. In our case, dissolved Fe added to multiple iron oxide NPs are contained in the cells, so the signal produced is sufficiently high to be distinguished from the background. As for the NPs, using an external calibration and the nebulization efficiency, the signal and the number of pulses produced are related to the mass of analyte contained in the cell and the number of cells, respectively.
The procedure for the SC-ICP-MS data treatment was manually computed on Matlab and could be summarized as follows: i) count intensities were classified as a function of their frequency (the lowest intensities represented the dissolved ions and higher intensities corresponded to iron-containing cells); ii) each ith bin frequency of the blank was subtracted to the ith bin frequency of the unknown sample in order to only extract the signal from the internalized iron (in our study, the blank was determined experimentally by measuring PBS used for bacteria storage); iii) using the established spICPMS theory (Pace et al, 2011), mass per cell distributions were calculated from the different signal distributions. The mass of the ith bin can be calculated as:
𝑚𝑖−𝑐𝑒𝑙𝑙𝑠= (𝐼𝑖−𝑐𝑒𝑙𝑙𝑠 − 𝐼𝐹𝑒)𝑡𝑆𝑑𝐹𝑒𝑞𝑙𝑖𝑞𝜂𝑛𝑒𝑏𝑢𝑙𝑖𝑧𝑎𝑡𝑖𝑜𝑛 (Eq. S2)
and the number concentration for each ith can be expressed as:
𝑁𝑖−𝑁𝑃𝑠 = 𝜂 𝑓(𝐼𝑖−𝑐𝑒𝑙𝑙𝑠)𝑖
𝑛𝑒𝑏𝑢𝑙𝑖𝑧𝑎𝑡𝑖𝑜𝑛𝑞𝑙𝑖𝑞𝑡𝑑 (Eq. S3)
where SFe is the slope of the external calibration for iron, Ii-cells is the average iron signal of the ith bin,
f(Ii-cells)i is the frequency of the ith bin, IFe is the dissolved signal of iron, td is the dwell time and qliq is
the flow rate.
To convert signals obtained during Single-Cell – Inductively Coupled Plasma – Mass Spectrometry (SC-ICP-MS) measurements for samples into a mass of iron, the nebulization efficiency of the instrumental setup has to be estimated. To do so, we used a nanoparticle (NP) suspension of citrate-capped AuNPs obtained from British Biocell International (Cardiff, UK), with a mean diameter of 59.9 nm (with a coefficient of variation of 8%) and a concentration of 2.60 1010 particles per mL. After dilution (final NP concentration of 2.60 105 particles per mL) the AuNPs solution was introduced into the mass spectrometer and the nebulization efficiency was calculated using the size method (Pace et al, 2011) based on the media size provided by the supplier (i.e. 59.9 nm). At millisecond dwell times the probability of coincidence (i.e. measuring more than one NP or cell during one dwell-time) declines by decreasing the particle or cell number concentration. Thus, several AuNP and cell concentrations have
been studied and at the end, the highest concentration without particle coincidence was selected. AuNPs and cells were diluted in ultrapure water and in a 4-fold diluted phosphate buffered saline solution (PBS; prepared from Sigma-Aldrich powders), respectively.
Analyses were performed on an HR-ICP-MS Element II (ThermoScientific, Germany) located in an ISO 4 cleanroom at the Institut de Physique du Globe de Paris (France). 56Fe was monitored in medium resolution (MR; R > 4000) as the separation power of the Element II in MR is high enough to resolve the main interference (c.a. 40Ar16O at m/z = 56). Externalized iron concentrations were determined averaging 9 data acquired with a 50 ms dwell time using the uFREASI software (Tharaud et al, 2015) for the intensity-concentration conversion.
SC-ICP-MS measurements were performed acquiring 10,000 data with a 3 ms dwell time. For nebulization efficiency calculation steps, 197Au was monitored using the same resolution, dwell time and flow rate as for iron. Also, before each SC-ICP-MS sequence, the flow rate was measured in triplicate (c.a. 0.2 mL/min). Note that the HR-ICP-MS was daily optimized in order to have the best stability, sensibility and the lowest uranium oxide ratio (UO/U < 8%). Iron dissolved LOQ, massmin
(per cell) were 25 ng/L, 1.75x10⁻⁸ ng and 18 nm, respectively.
Ultrapure water (resistivity 18.2 MΩ/cm) from a Millipore Integral 5 (Millipore, Milford, MA, USA) was used at all steps of our study. Mono-elemental standards of iron (Fe) and gold (Au) at 1 mg/mL were obtained from SCP Science (Quebec, Canada). Normapure nitric acid (VWR, Radnor, PA, USA)
was purified in a sub-boiler DST 1000 (Savillex, Eden Prairie, MN, USA). For external calibrations, all standards were diluted in ultrapure water containing 1% distilled HNO3.
Prior to the externalized iron determination, cells containing samples were filtered using polyethersulfone single-use filter units (Minisart, Sartorius stedium biotech, France) with 0.22-µm pore size. Then, the filtrate was acidified at 1% with HNO3 and analyzed.
ACKNOWLEDGMENTS
AK and MA are supported by grants through the National Science Foundation (1504681) and National Institutes of Health (R01GM084122 and R35GM127114). Part of this work was supported by IPGP multidisciplinary program PARI and by Region Île-de-France SESAME Grant no. 12015908.
References
Amor, M., Busigny, V., Louvat, P., Gélabert, A., Cartigny, P., Durand-Dubief, M., Ona-Nguema, G., Alphandéry, E., Chebbi, I., Guyot, F. (2016) Mass-dependent and -independent signature of Fe isotopes in magnetotactic bacteria. Science 352: 705-708.
Amor, M., Louvat, P., Tharaud, M., Gélabert, A., Cartigny, P., Carlut, J., Isambert, A., Durand-Dubief, M., Ona-Nguema, G., Alphandéry, E., Chebbi, I., Guyot, F. (2018) Iron uptake and magnetite biomineralization in the magnetotactic bacterium Magnetospirillum magneticum strain AMB-1: an iron isotope study. Geochem. Cosmochem. Acta 232: 225-243.
Andrews, S.C., Robinson A.K., Rodríguez-Quiñones F. (2003) Bacterial iron homeostasis. FEMS
Microbiol. Rev. 27: 215-237.
Aumont, O., Bopp, L. (2006) Globalizing results from ocean in situ iron fertilization studies. Global
Biogeochem. Cy. 20: GB2017. doi: 10.1029/2005GB002591.
Bazylinski, D.A., Frankel, R.B., Heywood, B.R., Mann, S., King, J.W., Donaghay, P.L., Hanson, A.K. (1995) Controlled biomineralization of magnetite (Fe3O4) and greigite (Fe3S4) in a magnetotactic
bacterium. Appl. Environ. Microbiol. 61: 3232-3239.
Blakemore, R.P. (1982) Magnetotactic bacteria. Ann. Rev. Microbiol. 36: 217-238.
Byrne, M.E., Ball, D.A., Guerquin-Kern, J.-L., Rouiller, I., Wu, T.-D., Downing, K.H., Vali, H., Komeili, A. (2010) Desulfovibrio magneticus RS-1 contains an iron- and phosphorus-rich organelle distinct from its bullet-shaped magnetosomes. Proc. Natl. Acad. Sci. U. S. A. 107: 12263-12268. Calugay, R.J., Miyashita, H., Okamura, Y., Matsunaga, T. (2003) Siderophore production by the
magnetic bacterium Magnetospirillum magneticum AMB-1. FEMS Microbiol. Lett. 218: 371-375. Chen, A.P., Berounsky, V.M., Chan, M.K., Blackford, M.G., Cady, C., Moskowitz, B.M., Kraal, P.,
Lima, E.A., Kopp, R.E., Lumpkin, G.R., Weiss, B.P., Hesse, P., Vella, N.G.F. (2014a) Magnetic properties of uncultivated magnetotactic bacteria and their contribution to a stratified estuary cycle.
Nat. Commun. 5: 10.138/ncomms5797.
Chen, J.-B., Busigny, V., Gaillardet, J., Louvat, P., Wang, Y.-N. (2014b) Iron isotopes in the Seine River (France): natural versus anthropogenic sources. Geochem. Cosmochem. Acta 128: 128-143. Coale, K.H. et al (2004) Southern Ocean iron enrichment experiment: carbon cycling in high- and
low-Si waters. Science 304: 408-414.
Cogley, J.G. (2012) Area of the ocean. Mar. Geod. 35: 379-388.
Downing, J.A., Prairie, Y.T., Cole, J.J., Duarte, C.M., Tranvik, L.J., Striegl, R.G., McDowell, W.H., Kortelainen, P., Caraco, N.F., Melack, J.M., Middelburg, J.J. (2006) The global abundance and size distribution of lakes, ponds, and impoundments. Limnol. Oceanogr. 51: 2388-2397.
Fantle, M.S., DePaolo, D.J. (2004) Iron isotopic fractionation during continental weathering. Earth
Flies, C.B., Jonkers, H.M., de Beer, D., Bosselmann, K., Böttcher, M.E., Schüler, D. (2005) Diversity and vertical distribution of magnetotactic bacteria along chemical gradients in freshwater microcosms. FEMS Microbiol. Ecol. 52: 185-195.
Hunter, R.C., Asfour, F., Dingemans, J., Osuna, B.L., Samad, T., Malfroot, A., Cornelis, P., Newman, D.K. (2013) Ferrous iron is a significant component of bioavailable iron in cystic fibrosis airways.
mBio 4: 10.1128/mBio.00557-13.
Ilina, S.M., Poitrasson, F., Lapitskiy, S.A., Alekhin, Y.V., Viers, J., Pokrovsky, O.S. (2013) Extreme iron isotope fractionation between colloids and particles of boreal and temperate organic-rich waters. Geochem. Cosmochem. Acta 101: 96-111.
Jacq, V., Ridame, C., L'Helguen, S., Kaczmar, F., Saliot, A. (2014) Response of the unicellular diazotrophic cyanobacterium Crocosphaera watsonii to iron limitation. PLoS One 9: 10.1371/journal.pone.0086749.
Knoll, A.H., Nowak, M.A. (2017) The timetable of evolution. Sci. Adv. 3: e1603076.
Kopp, R.E., Kirschvink, J.L. (2008) The identification and biogeochemical interpretation of fossil magnetotactic bacteria. Earth Sci. Rev. 86: 42-61.
Lefèvre, C.T., Menguy, N., Abreu, F., Lins, U., Pósfai, M., Prozorov, T., Pignol, D., Frankel, R.B., Bazylinski, D.A. (2011) A cultured greigite-producing magnetotactic bacterium in a novel group of sulfate-reducing bacteria. Science. 334: 1720-1723.
Lefèvre, C.T., Bazylinski, D.A. (2013) Ecology, diversity, and evolution of magnetotactic bacteria.
Microbiol Mol. Biol. Rev. 77: 497-526.
Lin, W., Bazylinski, D.A., Xiao, T., Wu, L.-F., Pan, Y. (2014) Life with compass: diversity and biogeography of magnetotactic bacteria. Environ. Microbiol. 16: 2646-2658.
Lin, W., Paterson, G.A., Zhu, Q., Wang, Y., Kopylova, E., Li, Y., Knight, R., Bazylinski, D.A., Zhu, R., Kirschvink, J.L., Pan, Y. (2017) Proc. Natl. Acad. Sci. U.S.A. 114: 2171-2176.
Liu, J. et al (2017) Bacterial community structure and novel species of magnetotactic bacteria in sediments from a seamount in the Mariana volcanic arc. Sci. Rep. 7: 10.1038/s41598-017-17445-4. Lyons, T.W., Reinhard, C.T., Planavsky, N.J. (2014) The rise of oxygen in Earth's early ocean and
atmosphere. Nature 506: 307-315.
Martínez-García, A., Sigman, D.M., Ren, H., Anderson, R.F., Straub, M.S., Hodell, D.A., Jaccard, S.L., Eglinton, T.I., Haug, G.H. (2014) Iron fertilization of the subantartic ocean during the last ice age. Science 343: 1347-1350.
Miyashita, S.-i., Groombridge, A.S., Fujii, S.-i., Minoda, A., Takatsu, A., Hioki, A., Chiba, K., Inagaki, K. (2014) Highly efficient single-cell analysis of microbial cells by time-resolved inductively coupled plasma mass spectrometry. J. Anal. At. Spectrom. 29: 1598-1606.
Moench, T.T., Konetzka, W.A. (1978) A novel method for the isolation and study of a magnetotactic bacterium. Arch. Microbiol. 119: 203-212.
Mueller, L., Traub, H., Jakubowski, N., Drescher, D., Baranov, V.I., Kneipp, J. (2014) Trends in single-cell analysis by use of ICP-MS. Anal. Bioanal. Chem. 406: 6963-6977.
Murat, D., Quinlan, A., Vali, H., Komeili, A. (2010) Comprehensive genetic dissection of the magnetosome gene island reveals the step-wise assembly of a prokaryotic organelle. Proc. Natl.
Acad. U.S.A. 107: 5593-5598.
Ouyang, T., Li, M., Appel, E., Fu, S., Jia, G., Li, W., Zhu, Z. (2017) Magnetic properties of surface sediments from the Pearl River Estuary and its adjacent waters: implication for provenance. Mar.
Geol. 390: 80-88.
Pace, H.E., Rogers, N.J., Jarolimek, C., Coleman, V.A., Higgins, C.P., Ranville, J.F. (2011) Determining transport efficiency for the purpose of counting and sizing nanoparticles via single particle inductively coupled plasma mass spectrometry. Anal. Chem. 83: 9361-9369.
Regnier, P. et al (2013) Anthropogenic perturbation of the carbon fluxes from land to ocean. Nat.
Geosci. 6: 10.1038/NGEO1830.
Rivas-Lamelo, S., Benzerara, K., Lefèvre, C.T., Monteil, C.L., Jézéquel, D., Menguy, N., Viollier, E., Guyot, F., Férard, C., Poinsot, M., Skouri-Panet, F., Trcera, N., Miot, J., Duprat, E. (2017) Magnetotactic bacteria as a new model for P sequestration in the ferruginous Lake Pavin. Geochem.
Persp. Let. 5: 35-41.
Schüler, D., Baeuerlein, E. (1998) Dynamics of iron uptake and Fe3O4 biomineralization during aerobic
and microaerobic growth of Magnetospirillum gryphiswaldense. J. Bacteriol. 180: 159-162.
Simmons, S.L., Sievert, S.M., Frankel, R.B., Bazylinski, D.A., Edwards, K.J. (2004) Spatiotemporal distribution of marine magnetotactic bacteria in a seasonally stratified coastal salt pond. Appl.
Environ. Microbiol. 70: 6230-6239.
Simmons, S.L., Edwards, K.J. (2006) Geobiology of magnetotactic bacteria. Microbiol. Monogr. 3: 10.1007/7171_039.
Simmons, S.L., Bazylinski, D.A., Edwards, K.J. (2007) Population dynamics of marine magnetotactic bacteria in a meromictic salt pond described with qPCR. Environm. Microbiol. 9: 2162-2174.
Spring, S., Amann, R., Ludwig, W., Schleifer, K.H., van Gemerden, H., Petersen, N. (1993) Dominating role of an unusual magnetotactic bacterium in the microaerobic zone of a freshwater sediment. Appl. Environ. Microbiol. 59: 2397-2403.
Tharaud. M., Gardoll, S., Khelifi, O., Benedetti, M.F., Sivry, Y. (2015) uFREASI: user-FRiendly Elemental dAta procesSing. A free and easy-to-use tool for elemental data treatment. Microchem. J. 121: 32-40.
Tharaud, M., Gondikas, A.P., Benedetti, M.F., von der Kammer, F., Hofmann, T., Cornelis, G. (2017) TiO2 nanomaterial detection in calcium rich matrices by spICPMS. A matter of resolution and
treatment. J. Anal. At. Spectrom. DOI: 10.1039/c7ja00060j.
Uebe, R., Schüler, D. (2016) Magnetosome biogenesis in magnetotactic bacteria. Nat. Rev. Microbiol. 14: 621-637.
Fig. 1. Mass of iron per cell measured in AMB-1 populations cultivated at (A) 10, (B) 50, (C) 100, (D) 200, (E) 300 or (F) 500 µM of Fe(III).
Fig. 2. Mass of iron per AMB-1 cell cultivated for two days versus initial Fe(III) concentration in the external medium. Each symbol represents the mean value of three replicates ± 1SD. The mass of iron per cell shows a logarithmic increase with higher iron concentration in AMB-1 growth medium (correlation coefficient of 0.92).
Fig. 3. Magnetite length in AMB-1 versus (A) Initial Fe(III) concentration in the external medium and (B) mass of iron per cell. Each point corresponds to the mean value of two replicates ± 1SD. At least 300 magnetite nanoparticles corresponding to a given population were measured. Magnetite length
shows logarithmic and exponential increase with Fe(III) concentration in the external medium (correlation coefficient of 0.97) and mass of iron per cell (correlation coefficient of 0.98), respectively.
Fig. 4. Model indicating the main inputs of dissolved iron to the oceans (in red, data from ref. 29) and the fluxes of iron incorporation by magnetotactic bacteria (in blue, data from this study). All flux numbers are given in kg of iron pear year.