HAL Id: hal-03148440
https://hal.archives-ouvertes.fr/hal-03148440
Submitted on 28 Feb 2021
HAL is a multi-disciplinary open access
archive for the deposit and dissemination of
sci-entific research documents, whether they are
pub-lished or not. The documents may come from
teaching and research institutions in France or
abroad, or from public or private research centers.
L’archive ouverte pluridisciplinaire HAL, est
destinée au dépôt et à la diffusion de documents
scientifiques de niveau recherche, publiés ou non,
émanant des établissements d’enseignement et de
recherche français ou étrangers, des laboratoires
publics ou privés.
A new compact young moving group around V1062
Scorpii
Siegfried Röser, Elena Schilbach, Bertrand Goldman, Thomas Henning, Attila
Moor, Aliz Derekas
To cite this version:
Siegfried Röser, Elena Schilbach, Bertrand Goldman, Thomas Henning, Attila Moor, et al.. A new
compact young moving group around V1062 Scorpii. Astronomy and Astrophysics - A&A, EDP
Sciences, 2018, 614, pp.A81. �10.1051/0004-6361/201732213�. �hal-03148440�
Astronomy
&
Astrophysics
https://doi.org/10.1051/0004-6361/201732213© ESO 2018
A new compact young moving group around V1062 Scorpii
Siegfried Röser
1,2, Elena Schilbach
1,2, Bertrand Goldman
3,4,
Thomas Henning
3, Attila Moor
5, and Aliz Derekas
5,61Zentrum für Astronomie der Universität Heidelberg, Landessternwarte, Königstuhl 12, 69117 Heidelberg, Germany 2Zentrum für Astronomie der Universität Heidelberg, Astronomisches Rechen-Institut, Mönchhofstraße 12–14,
69120 Heidelberg, Germany
e-mail: roeser@ari.uni-heidelberg.de, elena@ari.uni-heidelberg.de
3Max-Planck-Institut für Astronomie, Königstuhl 17, 69117 Heidelberg, Germany
e-mail: goldman@mpia.de
4Observatoire astronomique de Strasbourg, Université de Strasbourg – CNRS UMR 7550, 11 rue de l’Université,
67000 Strasbourg, France
5Konkoly Observatory, Research Centre for Astronomy and Earth Sciences, Hungarian Academy of Sciences, 1121 Budapest,
Konkoly Thege Miklós út 15–17, Hungary
6ELTE Eötvös Loránd University, Gothard Astrophysical Observatory, Szombathely, Hungary
Received 31 October 2017 / Accepted 27 December 2017
ABSTRACT
Aims. We are searching for new open clusters or moving groups in the solar neighbourhood.
Methods. We used the Gaia-TGAS catalogue, cut it into narrow proper motion and parallax slices and searched for significant spatial over-densities of stars in each slice. We then examined stars forming over-densities in optical and near-infrared colour-magnitude diagrams to determine if they are compatible with isochrones of a cluster.
Results. We detected a hitherto unknown moving group or cluster in the Upper Centaurus Lupus (UCL) section of the Scorpius-Centaurus OB association (Sco-Cen) at a distance of 175 pc from the Sun. It is a group of 63 comoving stars of less than 10 to about 25 Myr in age. For the brightest stars that are present in the Gaia-TGAS catalogue, the mean difference between kinematic and trigonometric distance moduli is −0.01 mag with a standard deviation of 0.11 mag. Fainter cluster candidates are found in the HSOY catalogue, where no trigonometric parallaxes are available. For a subset of our candidate stars, we obtained radial velocity measurements at the MPG/ESO 2.2 m telescope in La Silla. Altogether we found 12 members with confirmed radial velocities and parallaxes, 31 with parallaxes or radial velocities, and 20 candidates from the convergent point method. The isochrone masses of our 63 members range from 2.6 to 0.7 M .
Key words. parallaxes – proper motions – stars: formation – open clusters and associations: general – open clusters and associations: individual: Upper Centaurus Lupus
1. Introduction
For more than a century, the Scorpius-Centaurus OB associa-tion (Sco-Cen) has been studied as a moving group of early-type stars. Blaauw(1964) divided the huge nearby association into the following three subgroups: Upper Scorpius; Upper Centaurus Lupus (UCL), also known as Sco OB2_3; and Lower Centau-rus Crux. After the ESA HIPPARCOSmission, accurate proper motions and trigonometric parallaxes became available for many early-type stars in Sco-Cen. This material was used byde Zeeuw et al.(1999) for their fundamental paper on OB associations.
Among the HIPPARCOSobjects in the UCL subgroup of Sco-Cen,de Zeeuw et al.(1999) identified 221 members in this field, which have a mean distance of 140 ± 2 pc, 66 B, 68 A, 55 F, 25 G, six K, and one M-type star. They also noted that the star-forming regions (SFRs) associated with the Lupus clouds contained several tens of low-mass pre-main-sequence stars with estimated ages of ≈3 Myr (see the references inde Zeeuw et al. 1999). These SFRs cover most of UCL, except a small area in the south-eastern corner of UCL. We found a compact, young mov-ing group of stars in this area while searchmov-ing for open clusters in the TGAS catalogue (Michalik et al. 2015;Lindegren et al. 2016).
The first Gaia data release (Gaia-DR1; Gaia Collaboration 2016), and especially the publication of TGAS with its high-precision proper motions and trigonometric parallaxes fostered work on open clusters and moving groups by a number of authors. Without aiming for completeness we mention here the work performed by Gaia Collaboration (2017) on nearby open clusters and ofRandich et al.(2018) who, combining information from Gaia-DR1 and the Gaia-ESO Survey (Gilmore et al. 2012) data, derive new distances and ages of eight nearby open clusters.
Oh et al.(2017) used the TGAS catalogue to search for high-confidence comoving pairs of stars. In doing so these authors found some ten thousand comoving star pairs with separations as large as 10 pc. They also found larger groups correspond-ing to known open clusters and OB associations and several new comoving groups.
Studying the structure and behaviour of moving groups may shed light on the process of star formation in associations. We are guided by the statement byLarson (2002) in his summary during the conference “Modes of Star Formation and the Origin of Field Populations”: “When associations disperse, they retain some kinematic coherence because their internal motions are rel-atively small, and they then become moving groups or streams.
Fig. 1.Sky map (in Galactic coordinates) showing the stars from the TGAS catalogue with parallaxes between 5 and 10 mas and in the proper motion slice around (µαcos δ, µδ)= (−12, −22) mas yr−1. For further
information on the selection see text.
The weak-lined T Tauri stars found by X-ray observations that were discussed at this meeting probably represent some of the remnants of associations that are just now dissolving into the field and becoming moving groups”. So, it was worthwhile to study our new moving group in more detail as all ingredients discussed by Larson are in place; these include an association, a good number of T Tauri and weak-line T Tauri stars, and a moving group.
In this paper we describe in Sect. 2 how we detected this group, as well as the spectroscopic follow-up measure-ments we carried out with the FEROS instrument at the MPG/ESO 2.2 m telescope in La Silla to obtain radial velocities (RVs) and stellar parameters. In Sect.3we provide a discussion of the properties of the newly found group. Then, in Sect.4we compare our new group with the star-forming areas in the other parts of UCL, and a short summary concludes the paper.
2. Detection of the V1062 Sco moving group 2.1. Astrometric detection
After the first Gaia data release in September 2016, we per-formed a cluster search programme similar to that described in
Röser et al. (2016), but with TGAS replacing the Tycurat cat-alogue that we used originally. In brief the method consists in cutting the TGAS catalogue into slices as follows: In proper motion space we place a grid with grid points (i, k) at each inte-ger value (in mas yr−1) from −50 to +50 mas yr−1in both proper
motion components. A slice at (i, k) contains all stars for which (µαcos δ − i)2+(µδ− k)2≤ 1.52(mas yr−1)2holds. For each slice,
we then check the distribution of its stars over the sky and search for possible over-densities that can be considered as candidates of clusters or moving groups.
The availability of the TGAS parallaxes allows us to improve the effectivity of the method by cutting the catalogue into paral-lax slices as well. Since we are especially interested in finding unknown clusters in the vicinity of the Sun, we consider a parallax slice between 5 and 10 mas that contains the stars between 100 and 200 pc from the Sun. Compared to the full TGAS sky with some 2 million stars this parallax slice only includes 160 000 stars. The latter is then cut into proper motion slices. In Fig. 1 we show a sky map in Galactic coordinates of the proper motion slice (i, k) = (−12, −22) mas yr−1 that only contains 159 stars. We found a hitherto unknown over-density containing 25 stars (of 159) in a radius of 2.5◦ around (l, b) = (343.◦6,+4.◦3) in UCL. The fainter filamentary
struc-ture north of the over-density may also be a substrucstruc-ture in Sco-Cen, but we have not investigated this structure yet. Our
Fig. 2.Location of the V1062 Sco moving group (red circle) overlaid on the CO map fromTachihara et al.(2001). The radius of the circle is 2.75deg; or 8.4 pc at a distance of 175 pc and roughly corresponds to the extent of the group.
newly found over-density in the south-eastern corner of UCL occupies an area that is void on the12CO map fromTachihara
et al. (2001). We show its location in detail in Fig. 2. Also, the trigonometric parallaxes of these 25 stars show a narrow range between 5.3 and 6.3 mas in TGAS (cf. Fig.7), we hence-forth refer to this over-density of comoving stars as the V1062 Sco moving group (V1062 Sco MG) according to its promi-nent member V1062 Sco, postponing the discussion if V1062 Sco is a true member or not to Sect.3.4. Parallel to our finding of this new moving group this object has been detected in the above-mentioned paper byOh et al.(2017) as their “Group 11”, but without further discussion.
2.2. Radial velocities and stellar parameters
In order to get additional confirmation for the existence of the V1062 Sco MG, we carried out FEROS observations at the MPG/ESO 2.2 m telescope in July 2017 and determined RVs for a subset of possible moving group candidates. The fibre-fed, high-resolution (48 000) cross-dispersed optical spectrograph, FEROS, is mounted on the MPG/ESO 2.2 m telescope in La Silla (Kaufer et al. 1999). FEROS has two set-ups: one of its two fibres points to the science target, and the second points either to a cal-ibration lamp for better wavelength calcal-ibration, or to the sky. For brighter targets, we used both set-ups and for fainter targets we only used the sky set-up. We found that for our observations, the wavelength calibration errors are a minor contributor to the error budget. The observing log is given in TableA.4.
To reduce the spectra we used the CERES pipeline (Brahm et al. 2018), a reduction and extraction pipeline dedicated to échelle spectrographs. In a nutshell, for each of our three observ-ing nights, CERES identifies the calibration files and obtains a master bias and dark frames through median filtering. The flat field is not removed at this stage but instead the blaze function obtained from continuum lamp frames is divided after extrac-tion, which also corrects the column-averaged pixel-to-pixel variations of the CCD. The pipeline then identifies the order traces and fits them with a high-order polynomial; it measures the scattered light in the inter-order zones, interpolating over the spectra and performs a 2D median filtering of the resulting map. After subtraction of the scattered light, the spectra are optimally extracted. The spectra are wavelength-calibrated using the ThAr
lamp spectra, observed either simultaneously with the target or during the afternoon.
The CERES pipeline measures RVs by cross-correlating the spectra with binary masks indicating the narrow absorption lines, following Mayor et al. (2003). As CERES is optimized for late-type stars in its standard configuration, it provides masks corresponding to G2, K5, and M2 spectral types. Measurements of early-type stars is notoriously difficult as their spectra exhibit few absorption lines that are considerably broadened by stellar rotation. In the following we deal only with spectra of candidates with effective temperatures smaller than 7000 K. The uncertain-ties on the RV is determined as a function of the signal-to-noise ratio (S/N) at the Mg-triplet wavelength and the width of the cross-correlation function (CCF); the parameters are determined from a Monte Carlo simulation using degraded high S/N spec-tra. The measurements are reported in Table A.4. For targets with multiple observations we report the weighted average and the error on the mean of all the available measurements and list these stars in TableA.5. The dispersion of these individual observations roughly confirms the uncertainties derived from the S/Ns.
To obtain the stellar parameters, we applied the ZASPE (Brahm et al. 2016) pipeline. The pipeline is optimized to use the spectral library ofBrahm et al.(2016), created in order to reduce the biases in the stellar parameters with respect to the measure-ments of SWEET–Cat (Santos et al. 2013). This library covers a range of stellar temperatures up to 7000 K. The precision of the parameters can be estimated from the repeated observations of some targets, typically a few 0.1 dex in log g, 0.1 dex in [Fe/H], 200 m s−1 in v sin i, a few dozen Kelvin in T
eff. Average values
of these parameters are given in TableA.5. Our cluster members or candidates (m(4d) to m(6d); see Sect.3.1) have a mean metal-licity of 0.04 dex and have a spread of 0.1 dex. Their rotational velocity ranges from 5 to 80 km s−1. Only one cluster candidate member shows Hαemission, namely star 25, which also displays
(stronger) absorption. This general lack of emission, indicating no accretion, is consistent with the age range determined from the isochrones (see Sect.3.2).
2.3. Phase space coordinates
For 11 out of the 25 kinematic candidate stars mentioned in Sect. 2.1we obtained well-determined RVs with formal errors less than 1 km s−1. Their RVs pile up between 1.0 to +3.6 km s−1 and give RVmean= +2.24 ± 0.85 km s−1. Moreover, their
paral-laxes turned out to be within a narrow range between 5.4 and 6.2 mas, corresponding to a mean distance from the Sun of 175 ± 7 pc. For these stars we now have the complete set of 6D phase space coordinates based on direct observations. Hence we compute the mean space coordinates and velocities of the group in barycentric Galactic coordinates to be
(X, Y, Z, U, V, W)= (167.20, −49.14, 13.44, −3.80, −19.96, −4.06). (1) Here the X-axis points to the Galactic centre, the Y-axis to the direction of Galactic rotation, and the Z-axis points to the Galac-tic North Pole. The corresponding components of the space velocity are U, V, W. The standard deviation in the three com-ponents of the space velocity is rather small (σU, σV, σW) =
(0.7, 0.9, 0.3) km s−1. The individual residuals in velocity space
do not show systematic effects such as rotation or expan-sion. The standard deviation sets an upper limit of 1 km s−1
for the 1D velocity dispersion of the group, and we show in the discussion in Sect. 3.1 that this is large compared to the
formal error at least for that component of the tangential veloc-ity, which is perpendicular to the direction to the convergent point.
3. Properties of the V1062 Sco moving group We can use the phase space coordinates (1) of the V1062 Sco MG to perform a search of its members. This can be car-ried out on the basis of the convergent point (CP) method we applied to find members in the Hyades cluster (Röser et al. 2011;Goldman et al. 2013). In case of the V1062 Sco MG, we extended the search to a distance of 10 pc around the centre (X, Y, Z) = (167.20, −49.14, 13.44) from (1). Using the proper motions given in TGAS, the method predicts kinematic paral-laxes $kin, and the velocity components in the tangential plane
parallel and perpendicular to the direction of the convergent point. In the ideal case of an exactly parallel space motion the perpendicular component has to be zero. Taking into account a possible internal velocity dispersion and the accuracy of the input data, we allowed a maximum of 3 km s−1 for the per-pendicular velocity component. With these restrictions we found 35 TGAS stars as kinematic candidates of the moving group. Further we required that the difference between the predicted kinematic parallaxes $kinand the observed trigonometric
paral-laxes $trigfrom TGAS to be smaller than the mean error of this
difference, i.e.
|$kin−$trig|< (σ2$kin+ σ
2
$trig + 0.3
2)1/2, (2)
where 0.3 mas was taken as a possible systematic error of TGAS trigonometric parallaxes (Lindegren et al. 2016). The applica-tion of the restricapplica-tion (2) deletes two candidates, so we finally retained 33 kinematic members in our group confirmed by their trigonometric parallaxes. We publish them in TableA.1.
In order to find fainter candidates of the V1062 Sco MG, we also used the HSOY catalogue (Altmann et al. 2017). This catalogue was constructed using Gaia-DR1 positions as an addi-tional epoch together with PPMXL positions and proper motions to obtain formally improved proper motions. Although HSOY may have significant systematic proper motion errors over the sky, these should be unimportant for work in small areas of some tens of square degrees. We restricted our search within HSOY to G ≤ 14 mag that yielded 17 million stars; this subset is called HSOY14 in the following. This restriction was driven by the fact that the moving group is located south of declina-tion −30◦ and the quality of the proper motions in HSOY for
fainter stars deteriorates in this quarter of the sky. Using the convergent point method with the phase space coordinates (1) we derived kinematic parallaxes, which, however, cannot yet be verified by the trigonometric parallax observations. So, as in the case of the TGAS stars, the distance moduli and absolute mag-nitudes are derived from kinematic parallaxes. The CP method yielded 149 candidates. We then usually discard background stars that appear below the ZAMS and only retain stars that fulfil MG≤ 3 × (G − J)+2 in the MG, G − J colour-magnitude-diagram
(CMD). Forty stars are discarded by this criterium; these are all redder than (G − J) = 1.0. Since HSOY14 contains TGAS as a subset, we had to discard the above-mentioned 35 TGAS stars from the remaining 109 stars. It turns out, however, that from the remaining 74 HSOY14 stars 9 were also in the TGAS catalogue. Their proper motions differ slightly in the HSOY14 and TGAS catalogues, and this was a reason why they were not selected as TGAS candidates. Since the formal precision of the proper motions was a factor of almost two better for these stars in
HSOY14 compared to TGAS, we kept them as kinematic candi-dates. Moreover, 7 out of 9 stars fulfilled the condition (2). These 9 stars are given in TableA.2.
As the remaining 65 faint HSOY14 candidates were only selected on the basis of their HSOY14 proper motions, we checked the data quality by cross-matching the stars with UCAC5 (Zacharias et al. 2017) for consistency. We adopted this approach for the following reasons: The parent catalogue of HSOY is PPMXL, which itself descends from USNO-B1.0 (Monet et al. 2003). South of −30◦ declination USNO-B1.0 is
of poor quality, as the epoch difference between the first and second epoch is low in the south, and a possible mismatch leads to grossly erroneous proper motions that may be handed over to HSOY. A comparison with a completely independent source such as UCAC5 removes this problem. So, we only retain those stars whose difference in proper motions between HSOY and UCAC5 is within 1σ of the formal error of this differ-ence. Thirty-two stars of 65 survived this check and are given in TableA.3.
3.1. Membership
Because of the selection procedure applied, our sample of kinematic candidates includes stars of different membership probability. The quality of membership is based mainly on the observations available for candidates that are consistent with the phase-space coordinates of the V1062 Sco MG defined by (1). If, as in the case of HSOY, only four parameters (α, δ, µα,
µδ) are available and consistent with (1), we call these candi-dates m(4d) members. The CP method predicts the parallax and RV of candidate members. Both predictions have to be verified by observations. If no trigonometric parallaxes are available we can only make a negative selection by testing if the predicted absolute magnitudes are compatible with allowed stellar loci in CMDs. By doing this, we indeed classified a few m(4d) candi-dates as non-members because of their location in CMDs (see Sect.3.2)
However, the majority of our candidates had measurements of trigonometric parallaxes ($trig) or/and RVs. If one of the
quantities RV, or $trigis measured and consistent with (1), we
called the star a m(5d) member since its five coordinates of the 6D phase space coincide with the assumption of their member-ship in the V1062 Sco MG. If RV and $trigwere measured and
fulfil (1), we call them m(6d) members. On the other hand, if one of the measurements was inconsistent with (1), we rejected this star as a member and call it a non-member (nm).
In our total sample of 76 kinematic candidates of the V1062 Sco MG, we found 12 m(6d) members. These are fully confirmed members and their existence proves the authenticity of the moving group. Also the 31 m(5d) members are very probable candidates, as their measured $trigconfirms the predicted $kin
from the CP method, or, in four cases, the measured RV confirm the predicted RV. The other 20 m(4d) candidates await confirma-tion by RV and $trigmeasurements. Finally, in three cases the
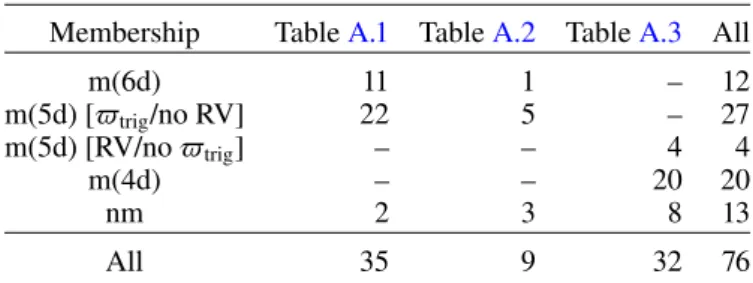
predicted parallaxes were not confirmed by the observed paral-laxes, in one case RV was inconsistent, and one star was rejected owing to both inconsistent parallax and RV. At this point we want to emphasize that, using the photometric criteria, we also identi-fied 8 m(4d) candidates as non-members (see the Sect.3.2). An overview of the membership quality in the V1062 Sco MG is given in Table1.
The stars in our V1062 Sco MG are remarkably comoving. Although we allowed the component of the tangential veloc-ity perpendicular to the direction to the convergent point to
Table 1. Overview of the membership quality in the V1062 Sco MG.
Membership TableA.1 TableA.2 TableA.3 All
m(6d) 11 1 – 12 m(5d) [$trig/no RV] 22 5 – 27 m(5d) [RV/no $trig] – – 4 4 m(4d) – – 20 20 nm 2 3 8 13 All 35 9 32 76
Notes. In Col. 1 we show various membership qualities as explained in the text, Col. 2 refers to TGAS stars from TableA.1, Col. 3 to HSOY stars with TGAS parallaxes (Table A.2), and Col. 4 to HSOY stars (TableA.3). Finally, in Col. 5 we give the total number of stars with the respective membership quality.
±3 km s−1, we find an overall standard deviation as small as
1 km s−1 around the expectation value of zero. At 175 pc this
corresponds to 0.83 mas yr−1, which is comparable to the accu-racy of the TGAS proper motions. The corresponding scatter of the 12 m(6d) members amounts to only 0.3 km s−1or less than 0.3 mas yr−1comparable to the accuracy of the best TGAS stars.
As the perpendicular component of the tangential velocity is a measure of the actual 1D velocity dispersion in a cluster (mov-ing group), we may safely conclude that it should be less than 1 km s−1.
3.2. Colour-magnitude diagrams
All stars of the V1062 Sco MG as selected above have 2MASS (Skrutskie et al. 2006) photometry and Gaia DR1 (Gaia Collaboration 2016) G magnitudes. We present them in the colour-magnitude diagrams (CMDs) MGversus G − J in Fig.3
and MKS versus J − KSin Fig.4. The magnitudes on the ordi-nate are absolute magnitudes and the colours on the abscissae are intrinsic colours in both diagrams. For the distance moduli we used the $kin, first because they are available for all the stars
in the 3 tables, and second because, within the TGAS precision budget, they are formally more precise than the $trig. In any case
the mean difference between the distance moduli from $trigand
$kin is −0.01 mag with a standard deviation of 0.11 mag, and
therefore hardly visible on the plots. We also do not show error bars for the absolute magnitudes. For TGAS stars the median of the uncertainties in distance modulus is 0.1 mag based on kinematic and 0.17 mag based on trigonometric parallaxes. For HSOY stars the median is 0.26 mag. All these quantities give error bars that are smaller than the size of the symbols. The reddening E(B − V) was determined from photometric data on TGAS members since their actual distances are sufficiently well known from the trigonometric parallaxes. We obtained a value of 0.065 mag for E(B − V) from the loci of the star in the three CMDs, i.e. MGversus G − J, MKSversus J − KS, and MV versus B − V.
Padova-2.8 solar metallicity isochrones (Bressan et al. 2012) for log t = 6.6, 7.4 and 8.0 are also shown in Figs.3and4. From the distribution of the stars in both CMDs we estimate that the masses of our members range between 2.6 to 0.7 M .
It is conspicuous in both CMDs that the stars do not follow a unique isochrone, but are mainly located between isochrones of 4 and 25 Myr, especially those with spectral types later than about F0 (J − KS> 0.2). This spread cannot be compensated by
Fig. 3.Colour-magnitude diagram MGvs. (G − J)0of stars in the V1062
Sco MG. The symbols for the members of different membership quality are shown in the legend. Crosses indicate stars that were observed by the ROSAT satellite (2RXS, see text). Also plotted are three Padova-2.8 solar metallicity isochrones for log t = 6.6, 7.4 and 8.0.
0.025 mag for J, KS, and 0.01 mag for G magnitudes. Also,
bina-rity can alleviate the age discrepancy, but not completely remove it. A possible explanation can be that the stars have formed over a period of 20 Myr, but are still moving together with the same space velocity. We note that the V1062 Sco MG is embedded in the Sco-Cen OB association, where many small SFRs are present (see the discussion in the next section), but, to our knowledge, not one such region is found that is as nicely comoving and well populated as the V1062 Sco MG.
We also tried to recover our stars in other sky surveys to get further indication on their youth. We found that eight TGAS stars (3 m(6d), 5 m(5d)) and nine HSOY14 stars (1 m(5d), 8 m(4d)) have ROSAT-2RXS (Boller et al. 2016) counterparts, but none of these is measured by Galex (Morrissey et al. 2007) as our moving group is outside the area that Galex observed.
As we mentioned above, the convergent point method pre-dicts the parallaxes of the kinematic members. In contrast to TGAS candidates, we cannot yet verify the predictions for HSOY stars by measurements. Therefore, some few HSOY kinematic candidates may happen to be non-members of the V1062 Sco MG. We can decrease a possible contamination by checking the consistency of predicted parallaxes and photomet-ric distances of m(4d) candidates. To be on a safe side, we marked a candidate as a non-member when it is located outside the area bordered by the isochrones log t = 6.6, 7.4 in at least one of the CMDs (MGversus G − J, MKSversus J − KS). Five of eight rejected candidates indeed seemed to be background or fore-ground stars, whereas three others were probably main-sequence stars at the distance of the V1062 Sco MG. In this case they may be comoving field stars older than 100 Myr, which are likely not connected to the young V1062 Sco MG , i.e. contaminants.
3.3. Estimate of the contamination
To estimate the number of field star contaminants that may enter our sample, we ran a Besançon simulation of the area around the cluster centre, obtaining a mock catalogue of field objects with 6D parameters. The Besançon simulation was performed over 40 sq. deg. with default parameters. The area was centred at l = 343.◦7, b = +4.◦3 and a constant extinction of A
V =
1.2 mag kpc−1 was added. This agrees with AV = 0.2 mag at
175 pc, i.e. at the mean distance of the V1062 Sco MG, where
¡ 0:2 0 0:2 0:4 0:6 0:8 1:0 (J ¡ Ks)0[mag] ¡ 4 ¡ 2 0 2 4 6 8 MK s [m ag ] logt = 6:6 logt = 7:4 logt = 8:0 m(6d) m(5d) m(4d) nm 2RXS
Fig. 4. Colour-magnitude diagram MKS vs. (J − KS)0 of stars in the
V1062 Sco MG. The symbols for the members of different member-ship quality are shown in the legend. Crosses indicate stars that were observed by the ROSAT satellite (2RXS, see text). Also plotted are three Padova-2.8 solar metallicity isochrones for log t = 6.6, 7.4 and 8.0.
we estimated E(B − V) to be 0.065 mag. We spread the mock positions over the whole area of 40 sq. deg. assuming a uniform distribution on the sky; the line-of-sight distance was determined by the Besançon simulator. The simulated cartesian parameters were converted into the observables, and we added Gaussian noise of 0.3 mas yr−1(RMS) and 0.3 mas (RMS) on each proper
motion component and the parallax, respectively. We also con-verted the Besançon Cousins photometry into the Gaia G system using the Jordi et al.(2010) colour transformation. Finally, to improve the statistics, we repeated the simulation ten times.
As for the real TGAS and HSOY14 stars, we ran the CP method around the phase-space coordinates (1) for this sim-ulation catalogue enlarged ten times. In Fig. 5 we show the simulated stars that came out from the CP method as kinematic candidates, i.e. m(4d) members. In total, there are 64 stars in the area between the isochrones for log t = 6.6 and log t = 7.4. So, in fact, we expect a number of 7 (6.4) stars from the Besançon model to fall into the CMD area occupied by the stars from the V1062 Sco MG. In the following we give a worst case (max-imum) estimate of the contamination: From our 68 kinematic candidates from Table 1 in the CMD area we had to discard already 5 as non-members based on discordant parallaxes or radial velocities. So, the maximum contamination among the remaining 63 is two, or 3%. In reality the contamination is much smaller for the m(5d) or m(6d) members. For instance, if we take into account the simulated parallaxes of the 6.4 contaminants, we find only 0.7 that should fall into the CMD area in Fig.5.
3.4. Individual stars
The star V* V1062 Sco (star 7 of our sample) is a variable of α2CVn type. Its TGAS parallax makes it an m(5d) member in
our terminology. In the literature we found a RV measurement of 13.00 ± 5.80 km s−1fromLevato et al.(1996). This RV is almost 2σ off the predicted RV. However, in case of a rotationally vari-able stars it is hard to extract its line-of-sight velocity. Therefore we keep this star as an m(5d) member.
Star 5 (HD 149551) and star 18 (HD 150372) are found in
Mamajek et al.(2002). Depending on different pMS isochrones the authors estimate an age between 4 and 11 Myr and a mass between 1.5 and 1.7 M for star 5, and an age between 4 and
Fig. 5. Colour-magnitude diagram MKS vs. (J − KS)0 of stars in the
area of the V1062 Sco MG obtained from a simulation based on the Besançon model (10 times enhanced). Again three Padova-2.8 solar metallicity isochrones for log t = 6.6, 7.4 and 8.0 are also given. Also plotted are the 13 non-members from Figs.3and4and Table1. (HD 149777) was rated an “active subgiant” byMamajek et al.
(2002) and hence rejected as a young member in the Sco-Cen association. However we keep it as a m(5d) member because of its measured trigonometric parallax. The preliminary veloc-ity measurement (RV= +0.6 ± 7.8 km s−1) for this very rapidly rotation star (vrot ≈ 200 km s−1) confirms its membership.
Nevertheless the uncertainty of this measurement is rather large. Star 30 of our sample (HD 152407) is mentioned in SIMBAD as a member in the cluster Trumpler 24 (Tr 24). It has number 160 in the catalogue of U, B, V measurements in Tr 24 byHeske & Wendker(1984). According to Heske & Wendker, TR 24 has a distance of 2300 pc, and they rate (HD 152407) as a post-MS member from their photometry and give its spectral type of B5Ib. However, its trigonometric parallax of 5.48 mas clearly rules it out as a member in Tr 24, and sets doubts on its luminosity class Ib.
Star 141 of our sample is 2MASS J16394731-3920404, also known as [SZB2012] 86 fromSong et al.(2012). These authors quote a distance of 99 pc, photometrically estimated from an empirical 10 Myr isochrone on an MKS versus V − KS CMD. They give a typical uncertainty of about 30% for their determi-nation. This star is also found inFuhrmeister & Schmitt(2003) in their catalogue of X-ray variable stars as No. 844. They deter-mine its spectral type to be M0Ve and rate it as a flare star. We keep this star as an m(4d) candidate because of its kinematic distance of 175 pc.
Star 35 (HD 151738) is a spectroscopic binary with a dif-ference in RV of about 100 km s−1. Because we do not know the mass ratio, we cannot use the measurement to constrain its membership.
Given the age range in V1062 Sco MG, we expect no detec-tion of protoplanetary disks and very few detecdetec-tions of warm debris disks (Cieza et al. 2010). However, using VOSA (Bayo et al. 2008) we reveal a significant infrared excess in the WISE (Cutri & et al. 2012) bands for six targets: star 107 in W1 (3.4 µm) redwards, stars 22, 124, and 143 in W3 (12 µm) and W4 (22 µm), and stars 26 and 59 in W4 only.
– Visual inspection of the relevant WISE images showed that stars 22 (HD 150532), 124 (2MASS 16375854-3933221), and 143 are associated with nebulosity both in W3 and W4 bands. Such complex backgrounds can lead to spurious detections (e.g.Cruz-Saenz de Miera et al. 2014). Actually we found no sources at the position of the stars in the W4
Fig. 6.Area of UCL in Galactic coordinates. The extent of UCL is out-lined by the distribution of the stars fromHoogerwerf(2000; grey dots). Our 63 members of the V1062 Sco MG are shown as black squares. Young stars from other authors in the UCL area are shown with the symbols indicated on the map.
band images. The W3 band excess detections should also be taken carefully given the nebulosity.
– Star 107 (2MASS 16425498-4233057) was observed with the Spitzer Space Telescope using the IRAC instrument in the 3.6, 4.5, 5.8, and 8.0 µm bands. These photometric data were taken from the Spitzer Enhanced Imaging Products catalogue (SEIP1). In contrast to WISE observations, the analysis of IRAC data shows no evidence for excess between 3.6 and 8.0 µm. The reasons of these discrepancies are not yet clear.
– The IR excess of star 26 (HD 151109) was also detected by Rizzuto et al.(2012) and Chen et al. (2012). Based on photometric and spectroscopic observations with Spitzer,
Chen et al.(2014) fitted the observed spectral shape of the excess using two blackbody components with temperatures of 237 and 91 K. This two-component debris disk has a total fractional luminosity of 1.1 × 10⁻⁴.
– The W4 band excess detection at star 59 (HD 152369) also seems to be solid.
None of those stars shows signs of accretion in our FEROS spec-tra. We ran a similar analysis on 221 random TGAS stars located at the same distance. None of those random stars showed consis-tent infrared excess as significant as our cluster members, giving a good hint that those disk detections may be real.
4. V1062 Sco MG and its relation to the Upper Centaurus Lupus association
The newly detected object is a comoving group of young stars at the edge of the huge (845 deg2) UCL association. The ages of
the V1062 Sco MG members range from less than 10 to about 25 Myr. Some of the younger stars were observed by the ROSAT satellite and show X-ray activity. The distance of the group from the Sun is 175 ± 7 pc. Within the UCL complex there are a num-ber of areas where star formation has recently taken place or is still going on. These areas are related to dense molecular clouds in UCL and have been studied by a number of authors in recent decades. However, no evidence has been obtained for a compact moving group around the variable star V1062 Sco.
1 http://irsa.ipac.caltech.edu/data/SPITZER/Enhanced/
0 2 4 6 8 10 12 parallax=mas 0 10 20 30 40 50 Hoogerwerf V1062Sco deZeeuw
Fig. 7.Parallax distribution of stars in the UCL association. Grey bars show the TGAS parallaxes of the stars from Hoogerwerf(2000) and green bars show the HIPPARCOSstars fromde Zeeuw et al.(1999). The black bars show the TGAS parallaxes of the 39 stars from Table1, which are at least m(5d) members.
In his study of the Sco OB2_3 (UCL) area, Hoogerwerf
(2000) searched for stars in the TRC catalogue (Hog et al. 1998), which was a predecessor of Tycho-2 and had proper motions con-sistent with the spatial velocity of the HIPPARCOSmembers of UCL from de Zeeuw et al. (1999). Using a convergent-point method, with further constraints on the proper motion distri-bution, magnitude and colour, Hoogerwerf found some 1200 candidate stars. Based on Monte Carlo simulations of the field star population, he expected a contamination of between 400 and 800 field stars in this sample. He thus concluded that, among the 1200 stars, a considerable number of association members should be present that are fainter than the about 150 HIPPARCOS
stars fromde Zeeuw et al.(1999).
In Fig.6, we show Hoogerwerf stars as small grey dots in the background. These stars outline the extent of the UCL area. From the 35 stars in Table A.1 27 are listed in Hoogerwerf
(2000), but only 6 are also contained inde Zeeuw et al.(1999). Also 6 stars in Table A.2 and 4 in Table A.3 are included in
Hoogerwerf(2000). We crossmatched the UCL association can-didates with TGAS, and show in Fig.7their distribution versus the trigonometric parallaxes. These candidates demonstrate a broad distribution with parallaxes between 1 and 10 mas. There is indicative of a bi-modal distribution with one part between 1 and 5 mas, probably the background field-star contaminants mentioned above, and between 5 and 8 mas of the UCL asso-ciation proper. Also in Fig. 7 we show the distribution of the HIPPARCOS stars (but with TGAS parallaxes) fromde Zeeuw et al.(1999). Their parallaxes are concentrated between 6 and 8 mas, showing a lower number of background contaminants. On top the parallax distributions in the UCL area in Fig.7, we plot the distribution of TGAS parallaxes of our 39 stars from Table1, which are at least m5d members. The V1062 Sco MG members show a narrow parallax distribution clearly indicating a sub-condensation at the periphery of the UCL complex.
Based on X-ray data from the ROSAT All-Sky-Survey,
Krautter et al. (1997) discovered 136 new T Tauri stars in the Lupus SFR (their Tables 5, 6, and 11). The positions of these stars in UCL are also shown in Fig. 6. For 31 T Tauri stars inKrautter et al. (1997), we identified TGAS counterparts. In comparison to our V1062 Sco MV members, they show a much wider parallax spread of between 5 and 11 mas with a peak at 7.5 mas (ca. 133 pc).
Song et al.(2012) have spectroscopically identified 100 G-, K-, and M-type members of the Scorpius-Centaurus complex. Sixteen of these are found in the UCL complex and are also plot-ted in Fig.6. As already mentioned, their star SZB86 is an m(4d) kinematic member of our group (star 141). Song et al. (2012) derived ages of about 10 Myr for stars in the Upper Centaurus Lupus region.
Galli et al.(2013) identified a comoving group with 109 pre-main-sequence stars and candidates in the Lupus SFR. Assuming that all stars share the same space motion, these authors derived individual parallaxes for stars with known RV and tentative par-allaxes for the remaining group members. In their Fig.3 they show the location of their UCL stars overplotted to the 12CO intensity map fromTachihara et al. (2001).Galli et al. (2013) studied four subgroups called Lupus 1 to Lupus 4, which are all associated with strong12CO emission. The average kinematic distances of these subgroups range from 140 to 200 pc. Lupus 3, the most populated group at (l, b)= (339.◦5,+9.◦5) in Fig.6has an average kinematic distance of 180 pc, but shows a consider-able depth, i.e. the stars in Lupus 3 are located between 160 and 260 pc. Also the proper motions of this sample scatter between −5 and −35 mas yr−1in both components. In a later paper,Galli
et al.(2015) derived masses and ages of the T Tauri star popu-lation in this SFR. The ages of their stars peak between 6 and 7 Myr, and are, on average, younger than ours.
Unlike the other SFRs in Lupus, which are embedded in molecular clouds and show considerable scatter in their proper motions, the V1062 Sco MG is concentrated in a distance range between 165 and 185 pc; the scatter of its proper motions is com-parable to the uncertainties of the proper motions in TGAS, resp. HSOY, and, finally, it is not embedded in a molecular cloud on the Tachihara et al.(2001)12CO map. In Sect. 3.2we found a moderate value for E(B − V), i.e. an AV of about 0.2 mag in the
direction of our group.
We additionally studied the interstellar-medium gas absorp-tion in the NaI lines at 589.0 and 589.6 nm (Pascucci et al. 2015). Many of our targets show narrow-line absorption on top of the broad stellar absorption. These lines have a mean barycentric RV of+0.5 km s−1(in the LSR: +6 km s−1) and have an rms-spread of 2 km s−1. Over most of the cluster, the stellar and gas RVs are
very similar. While the RV spread is random on the sky, the depth of the absorption line is noticeably strong (mean of 71%) west of a great circle passing through l, b= (343◦, +4◦), an orientation of −10◦(N to E), and small mean of 31% east of that line. This drop
can be seen on the Hαmap of this velocity (HI4PI Collaboration et al. 2016). With these data, it is not possible to place the gas relative to the cluster and claim that the cluster still holds some of its original gas. We can however describe HI emis-sion seen at other RV (>+10 or <−2 km s−1in the LSR) by the
HI4PI Collaboration et al.(2016) as background gas. 5. Summary
The Upper Centaurus Lupus (UCL) subgroup of the Sco-Cen OB-association contains a large number of some 130 B and A stars at a mean distance of 140 pc from the Sun. Also it comprises a few subgroups, embedded in molecular clouds, where recent stars formation is going on. The new group around the variable star V1062 Sco is situated outside of these molecular clouds at a mean distance of 175 ± 7 pc from the Sun and contains 63 stars within a radius of 10 pc around the centre. The stars in our mov-ing group are not coeval, but show an age spread between 4 and 25 Myr for which we have no explanation. This group is strongly comoving, as the 1D velocity dispersion is less than 1 km s−1.
The 33 members from the TGAS catalogue are selected such that the difference between their kinematic and trigonometric parallaxes is smaller than the 1σ error of this difference. For a subset of 12 stars, we could confirm a full 3D coincidence of their space motion with the mean space motion of the group. These definitely form a moving group or possibly an open clus-ter. For another subset of 27 stars the kinematically predicted parallaxes are confirmed by the trigonometric parallaxes from TGAS; they fulfil this necessary condition of being cluster mem-bers. Also 4 stars from HSOY have RVs confirmed. A last subset of 20 stars have predicted parallaxes consistent with the condi-tion of co-movement. In total there are 63 stars belonging to this V1062 Sco MG. A possible contamination by field stars is about 3% estimated on the basis of the Besançon model of our Galaxy. In summary, we have clearly shown that the V1062 Sco MG is a new compact, young moving group within 200 pc from the Sun. The masses of our 63 members range from 2.6 to 0.7 M .
With Gaia data release 2, announced for April 2018 we expect to reveal new and fainter members of the group.
Acknowledgements.This study was supported by Sonderforschungsbereich SFB 881 “The Milky Way System” (subprojects B5 and B7) of the German Research Foundation (DFG). This research has made use of the SIMBAD database and the VizieR catalogue access tool, operated at CDS, Strasbourg, France. This work has made use of data from the European Space Agency (ESA) mission Gaia (https://www.cosmos.esa.int/gaia), processed by the Gaia Data Process-ing and Analysis Consortium (DPAC,https://www.cosmos.esa.int/web/ gaia/dpac/consortium). Funding for the DPAC has been provided by national institutions, in particular the institutions participating in the Gaia Multilateral Agreement. This publication makes use of VOSA, developed under the Spanish Virtual Observatory project supported from the Spanish MICINN through grant AyA2011-24052. This project has been supported by the Hungarian NKFI Grants K-115709 and K-119517 of the Hungarian National Research, Development and Innovation Office. A.D. was supported by the ÚNKP-17-4 New National Excel-lence Program of the Ministry of Human Capacities. AD would like to thank the City of Szombathely for support under Agreement No. 67.177-21/2016. B.G. thanks Andres Jordan and Rafael Brahm for useful discussions and their help in reducing the FEROS data, as well as Caroline Bot and Jeroen Bouwman for their insights. The authors thank Ilaria Pascucci for her precious suggestions regarding IR excess and gas absorption. We would like to thank the anonymous referee for her/his very constructive and helpful comments.
References
Altmann, M., Roeser, S., Demleitner, M., Bastian, U., & Schilbach, E. 2017,
A&A, 600, L4
Bayo, A., Rodrigo, C., Barrado Y Navascués, D., et al. 2008,A&A, 492, 277
Blaauw, A. 1964,ARA&A, 2, 213
Boller, T., Freyberg, M. J., Trümper, J., et al. 2016,A&A, 588, A103
Brahm, R., Jordan, A., Hartman, J., & Bakos, G. 2016,Astrophysics Source Code Library, [record ascl:1607.012]
Brahm, R., Hartman, J. D., Jordan, A., et al. 2018,AJ, 155, 112
Bressan, A., Marigo, P., Girardi, L., et al. 2012,MNRAS, 427, 127
Chen, C. H., Pecaut, M., Mamajek, E. E., Su, K. Y. L., & Bitner, M. 2012,ApJ, 756, 133
Chen, C. H., Mittal, T., Kuchner, M., et al. 2014,ApJS, 211, 25
Cieza, L. A., Schreiber, M. R., Romero, G. A., et al. 2010,ApJ, 712, 925
Cruz-Saenz de Miera, F., Chavez, M., Bertone, E., & Vega, O. 2014,MNRAS, 437, 391
Cutri, R. M., Wright, E. L., Conrow, T. & et al. 2012,VizieR Online Data Catalog: II/311
de Zeeuw, P. T., Hoogerwerf, R., de Bruijne, J. H. J., Brown, A. G. A., & Blaauw, A. 1999,AJ, 117, 354
Fuhrmeister, B., & Schmitt, J. H. M. M. 2003,A&A, 403, 247
Gaia Collaboration (Brown, A. G. A., et al.) 2016,A&A, 595, A2
Gaia Collaboration (van Leeuwen, F., et al.) 2017,A&A, 601, A19
Galli, P. A. B., Bertout, C., Teixeira, R., & Ducourant, C. 2013,A&A, 558, A77
Galli, P. A. B., Bertout, C., Teixeira, R., & Ducourant, C. 2015,A&A, 580, A26
Gilmore, G., Randich, S., Asplund, M., et al. 2012,The Messenger, 147, 25
Goldman, B., Röser, S., Schilbach, E., et al. 2013,A&A, 559, A43
Heske, A., & Wendker, H. J. 1984,A&AS, 57, 205
HI4PI Collaboration, Ben Bekhti, N., Flöer, L., et al. 2016,A&A, 594, A116
Hog, E., Kuzmin, A., Bastian, U., et al. 1998,A&A, 335, L65
Hoogerwerf, R. 2000,MNRAS, 313, 43
Jordi, C., Gebran, M., Carrasco, J. M., et al. 2010,A&A, 523, A48
Kaufer, A., Stahl, O., Tubbesing, S., et al. 1999,The Messenger, 95, 8
Krautter, J., Wichmann, R., Schmitt, J. H. M. M., et al. 1997,A&AS, 123, 329
Larson, R. B. 2002, in Modes of Star Formation and the Origin of Field Populations, eds. E. K. Grebel, & W. Brandner,ASP Conf. Ser., 285, 442
Levato, H., Malaroda, S., Morrell, N., Solivella, G., & Grosso, M. 1996,A&AS, 118, 231
Lindegren, L., Lammers, U., Bastian, U., et al. 2016,A&A, 595, A4
Mamajek, E. E., Meyer, M. R., & Liebert, J. 2002,AJ, 124, 1670
Mayor, M., Pepe, F., Queloz, D., et al. 2003,The Messenger, 114, 20
Michalik, D., Lindegren, L., & Hobbs, D. 2015,A&A, 574, A115
Monet, D. G., Levine, S. E., Canzian, B., et al. 2003,AJ, 125, 984
Morrissey, P., Conrow, T., Barlow, T. A., et al. 2007,ApJS, 173, 682
Oh, S., Price-Whelan, A. M., Hogg, D. W., Morton, T. D., & Spergel, D. N. 2017,
AJ, 153, 257
Pascucci, I., Edwards, S., Heyer, M., et al. 2015,ApJ, 814, 14
Randich, S., Tognelli, E., Jackson, R., et al. 2018,A&A, 612, A99
Rizzuto, A. C., Ireland, M. J., & Zucker, D. B. 2012,MNRAS, 421, L97
Röser, S., Schilbach, E., Piskunov, A. E., Kharchenko, N. V., & Scholz, R.-D. 2011,A&A, 531, A92
Röser, S., Schilbach, E., & Goldman, B. 2016,A&A, 595, A22
Santos, N. C., Sousa, S. G., Mortier, A., et al. 2013,A&A, 556, A150
Skrutskie, M. F., Cutri, R. M., Stiening, R., et al. 2006,AJ, 131, 1163
Song, I., Zuckerman, B., & Bessell, M. S. 2012,AJ, 144, 8
Tachihara, K., Toyoda, S., Onishi, T., et al. 2001,PASJ, 53, 1081
Appendix A: A dditional tables T able A. 1 . T G AS st ars in the V1 062 Sco mo ving g roup. N o. N ame RA (J2000) Dec (J2000) µα µδ $kin $TGAS J H KS G Membership Z H X (deg) (deg) (mas yr − 1) (mas yr − 1) (mas) (m as) (mag) (mag) (mag) (m ag) 1 HD 14935 4 248.980605 − 40.333009 − 14. 11 − 20.4 1 5.69 ± 0.29 5.53 ± 0.4 4 8.5 42 8.266 8. 17 8 9.589 m(5d) – H – 2 HD 149 425 249. 11 9 405 − 40.303 1 20 − 11 .92 − 20.84 5.52 ± 0.0 1 5.7 1 ± 0.5 1 6.7 4 4 6.7 81 6.7 14 7.0 75 m(5d) Z H – 3 HD 149 46 7 249. 182939 − 39.332 7 63 − 1 2.79 − 20.90 5.62 ± 0.32 5.50 ± 0.25 8.7 38 8.5 17 8.426 9.685 m(5d) – H – 4 HD 149533 249.26095 4 − 38.6 7 630 7 − 1 2.53 − 20.98 5.6 1 ± 0.0 1 6.30 ± 0.42 7.268 7.2 7 3 7.233 7.3 7 2 m(5d) – H – 5 HD 14955 1 249.30355 7 − 39.0 10658 − 11 .62 − 21 .03 5.5 1 ± 0.02 5.7 6 ± 0.39 8.453 8. 103 8.0 10 9.553 m(5d) Z H – 6 T Y C 7 858-585-1 249.4253 7 2 − 40. 17 149 4 − 11 .55 − 21 .0 4 5.5 1 ± 0.50 6.0 1 ± 0.92 9.2 7 3 8.9 43 8.826 10.426 m(6d) – – – 7 V* V1 062 Sco 249.62885 4 − 39. 1 524 19 − 1 2.58 − 21 .2 1 5.66 ± 0.0 1 5.82 ± 0.4 4 6.883 6.92 7 6.926 6.9 41 m(5d) – H – 8 HD 149 7 26 249.6300 42 − 41 .635380 − 1 3.6 7 − 21 .1 9 5.80 ± 0.03 6.24 ± 0.28 8.488 8.325 8.2 70 9.302 m(5d) – H – 9 HD 149 7 7 7 249.660225 − 39.55 10 7 8 − 11 .83 − 21 .02 5.5 4 ± 0.02 5.69 ± 0.39 7.56 1 7.280 7. 16 1 8.6 70 m(5d) – H X 10 HD 149 793 249.68 143 4 − 39.6 7956 4 − 1 3.0 7 − 22.60 6.00 ± 0.35 5.55 ± 0.22 8.6 18 8.420 8.3 45 9.625 m(6d) – H – 11 HD 149938 249.888 793 − 39.60928 1 − 1 2. 16 − 21 .1 4 5.60 ± 0. 1 2 5.49 ± 0.36 7.939 7.89 1 7.898 8.260 m(5d) – H – 1 2 HD 1 5000 4 249.99 1 238 − 39.7 89033 − 1 2. 11 − 20.68 5.50 ± 0.09 5.5 4 ± 0.3 4 7.499 7.49 4 7.45 1 7.7 85 m(5d) – H – 1 3 HD 1 50 10 7 250. 1 3 70 7 8 − 38.2268 7 2 − 11 .95 − 22.55 5.85 ± 0.2 7 5.63 ± 0.3 1 8.7 85 8.603 8.5 48 9.598 m(6d) – H – 14 HD 1 50092 250.2 17 7 8 7 − 40.43329 4 − 1 3.0 4 − 22.30 5.9 4 ± 0.60 6. 19 ± 0.89 9.099 8.824 8.7 16 10. 169 m(6d) – H – 1 5 HD 1 50 196 250.284884 − 40.225852 − 1 2.56 − 21 .3 1 5.68 ± 0.29 5.59 ± 0.26 8.9 70 8.7 3 7 8.686 9.809 m(6d) – H – 16 HD 1 5028 7 250.4666 14 − 40.466324 − 11 .7 6 − 21 .4 1 5.6 1 ± 0.02 5.79 ± 0.28 8.58 1 8.388 8.35 7 9.338 m(6d) Z H – 17 T Y C 7 8 71-69 4-1 250.50056 7 − 40.0 49 4 7 8 − 11 .7 1 − 21 .39 5.60 ± 0.63 5.6 7 ± 0.29 9.8 1 2 9.3 1 2 9. 1 59 11 .3 18 m(6d) – – X 18 HD 1 503 7 2 250.599928 − 40.058326 − 10.59 − 22.63 5.7 2 ± 0.2 7 5.30 ± 0.48 8.0 4 7 7.6 14 7.46 4 9.3 10 m(5d) – – X 19 HD 32 1892 250.6 1 3520 − 38.460 1 59 − 1 2.9 1 − 21 .52 5.7 5 ± 0.42 5.84 ± 0.23 8.6 42 8.245 8. 1 56 9.660 m(5d) – H X 20 HD 1 50398 250.62 70 49 − 38.930 180 − 11 .28 − 21 .8 7 5.6 4 ± 0.23 5.80 ± 0.25 8.522 8.433 8.40 4 9.092 m(6d) – H – 21 HD 32590 7 250.63 1 35 1 − 41 .7 59 400 − 1 2.43 − 22.55 5.93 ± 0.45 5.53 ± 0.25 9.4 16 9.090 9.03 4 10.40 1 m(6d) – – – 22 HD 1 50532 250.8 7 21 92 − 41 .986 1 5 4 − 9.5 4 − 24. 10 5.92 ± 0.3 1 5.70 ± 0.24 8.802 8.6 79 8.56 1 9.7 25 m(5d) – H – 23 HD 1 50989 25 1.55 4962 − 39.7 45820 − 11 .99 − 22.9 1 5.93 ± 0. 17 5.9 1 ± 0.30 8. 182 8. 1 28 8.0 40 8.680 m(5d) – H – 24 HD 1 50988 25 1.5 705 70 − 39.2 7 2 7 26 − 11 .43 − 22.03 5.69 ± 0. 10 5.6 7 ± 0.35 7.98 7 7.9 71 7.9 46 8.2 1 5 m(5d) – H – 25 HD 32 1958 25 1.66 7 832 − 38. 14 75 18 − 11 .83 − 21 .7 4 5.6 7 ± 0.62 5.9 1 ± 0.25 9.452 9.030 8.9 42 10.62 1 m(6d) – – X 26 HD 1 51 109 25 1.7 56929 − 39.53396 4 − 11 .59 − 21 .9 7 5.70 ± 0.0 1 4.96 ± 0.9 1 6.998 7.038 7.039 6.963 m(5d) Z H – 2 7 HD 1 51 68 1 252.6026 17 − 38.0 485 45 − 1 2.45 − 22.22 5.83 ± 0. 1 3 5.82 ± 0.30 7.982 7.968 7.838 8.295 m(5d) – H – 28 HD 1 51 7 26 252.689598 − 38.2565 1 3 − 11 .79 − 22.70 5.86 ± 0.0 1 5.69 ± 0.39 7.2 18 7.26 1 7.26 1 7.25 7 m(5d) Z – – 29 HD 1 520 41 253. 17 3 750 − 38.7 60 4 43 − 11 .32 − 22.02 5.6 7 ± 0.02 5.38 ± 0.3 7 7.9 1 3 7.7 2 7 7.558 8.706 m(6d) Z H X 30 HD 1 5240 7 253.7 435 19 − 41 .0929 1 3 − 1 2.90 − 21 .79 5.80 ± 0.20 5.48 ± 0.3 7 8.2 1 3 8. 1 55 8.089 8.7 35 m(5d) – H – 31 HD 32 1803 248.5 4846 4 − 39.626 71 1 − 9.30 − 22.7 8 5.60 ± 1.28 6.32 ± 0.23 9.2 71 8.965 8.809 10.4 42 m(5d) – H – 32 HD 149230 248.82 7 830 − 42.239950 − 1 2.99 − 21 .23 5.7 4 ± 0.2 7 5.42 ± 0.39 8.495 8.383 8.265 9.29 4 m(5d) – H – 33 T Y C 7 358-330-1 249.9 48 7 82 − 36.609805 − 11 .92 − 22.38 5.80 ± 0.80 2. 1 5 ± 0.2 7 9.909 9.59 4 9.42 7 11 .3 11 nm (kin) – – – 3 4 HD 325890 250.20 18 16 − 41 .2 71 889 − 9.7 8 − 24.05 5.92 ± 0.35 3. 1 3 ± 0.26 9.450 9.222 9. 1 29 10.48 7 nm (kin), binar y – – – 35 HD 1 51 7 38 252.7 42 709 − 38.928093 − 11 .1 3 − 21 .1 3 5.4 7 ± 0.32 5.48 ± 0.2 7 8.935 8.7 17 8.656 9.7 81 m(5d), binar y – H X N o tes. Columns of the table ar e lis ted as follo w s: Col. 1 giv es the inter nal st ar number in the V1 062Sco MG and Col. 2 lis ts the main identifier of the st ar in SIMB AD; Cols. 3 and 4 lis t the right ascension and declination and Cols. 5 and 6 lis t the pr oper mo tions in right ascension and declination in the T G AS cat alogue; Col. 7 giv es the kinematic par allax and its mean er ror fr om the CP me thod, and Col. 8 lis ts the tr igonome tr ic par allax and its mean er ror fr om T G AS; Cols. 9 to 11 lis t the J, H ,KS magnitudes fr om 2MASS; Col. 1 2 giv es the mean G magnitude fr om Gaia DR1; Col. 1 3 giv es the membership inf or mation (and comments), and Cols. 14 to 16 lis t the cr ossmatc h wit h de Zeeuw et al. ( 1999 ), Hoog er w er f ( 2000 ), and R OS A T -2RXS ( B oller et al. 20 16 ).
T able A.2. T G AS st ars wit h HSO Y pr oper mo tions in the V1 062 Sco mo ving g roup. N o. N ame RA (J2000) Dec (J2000) µα µδ $kin $TGAS J H KS G Membership H X (deg) (deg) (mas yr − 1) (mas yr − 1) (m as) (mas) (mag) (mag) (mag) (mag) 51 HD 149638 249.4299 70 − 39.70862 7 − 1 3.2 1 − 20.9 7 5.69 ± 0.23 5.7 1 ± 0.22 8.862 8.539 8.425 10.09 7 m(5d) H – 52 HD 1 50 165 250.23 4 74 7 − 40. 18 7 21 8 − 11 .2 7 − 22.49 5.7 7 ± 0. 1 5 5.83 ± 0.28 8.30 4 8.0 49 7.950 9.280 nm (kin) H – 53 HD 149 7 38 249.6 1 23 16 − 39.65 18 11 − 11 .7 3 − 20.80 5.48 ± 0.06 6.0 7 ± 0.32 7.683 7.658 7.60 7 7.955 m(5d) H – 5 4 HD 322024 25 1.0 71 98 7 − 40.2529 7 6 − 14. 11 − 20.20 5.63 ± 0.25 0.7 1 ± 0.8 7 6.533 5.68 7 5.4 10 8.96 7 nm (kin) – – 55 HD 149336 248.8950 70 -3 7. 11 0095 − 11 .4 4 − 22.6 1 5.80 ± 0. 1 5 6. 17 ± 0.25 8.486 8 .249 8.23 7 9.399 nm (R V) H – 56 HD 149984 249.9 46029 − 38.7 69026 − 1 3.02 − 21 .86 5.83 ± 0.22 5.79 ± 0.22 9.232 8.95 1 8.8 7 2 10.05 1 m(6d) H – 5 7 HD 32 198 1 25 1.3 7 6202 − 39. 16 184 4 − 11 .63 − 21 .4 4 5.59 ± 0.24 5.00 ± 0.38 9.300 8.7 8 7 8.690 10.7 41 m(5d) – X 58 HD 1 51 868 252.9 400 40 − 38.0524 7 6 − 1 2.32 − 21 .3 1 5.63 ± 0. 18 5.90 ± 0.22 8.593 8.42 7 8.3 45 9.28 1 m(5d) – – 59 HD 1 52369 253.6 420 4 4 − 38. 1056 40 − 1 2.05 − 22.56 5.85 ± 0.09 6.24 ± 0.92 8.262 8.20 4 8. 1 59 8.7 10 m(5d) H – N o tes. The columns of the table ar e lis ted as follo w s: Col. 1 lis ts the inter nal st ar number in the V1 062Sco MG and Col. 2 lis ts the main identifier of the st ar in SIMB AD; C ols. 3 and 4 giv e the right ascension and declination, and Cols. 5 and 6 giv e the pr oper mo tions in right ascension and declination in the HSO Y cat alogue; Col. 7 lis ts the kinematic par allax and its mean er ror fr om the CP me thod, and Col. 8 giv es the tr igonome tr ic par allax and its mean er ror fr om T G AS; Cols. 9 to 11 lis t the J, H ,KS magnitudes fr om 2MASS; Col. 1 2 giv es the mean G magnitude fr om Gaia DR1 , Col. 1 3 giv es the membership inf or mation (and comments), and Cols. 14 and 1 5 lis t the cr ossmatc h wit h Hoog er w er f ( 2000 ) and R OS A T -2RXS ( Boller et al. 20 16 ).
T able A.3. HSO Y st ars in the V1 062 Sco mo ving g roup. N o. N ame RA (J2000) Dec (J2000) µα µδ $kin J H KS G Membership H X (deg) (deg) (mas yr − 1) (mas yr − 1) (m as) (mag) (mag) (mag) (mag) 10 1 1636595 7-4 1 3 7069 249.24820 4 − 41 .6 1865 1 − 1 2.05 − 21 .7 2 5.7 2 ± 0.68 11 .292 10.796 10.6 7 6 1 3.093 nm – – 103 16302 7 31-39 1 523 7 24 7.6 1 38 1 5 − 39.2566 19 − 11 .9 1 − 21 .48 5.6 4 ± 0.68 11 .624 11 .235 11 .0 70 1 3.463 nm – – 105 163 42 105-3922 198 248.58 7 70 7 − 39.3 7 21 74 − 1 2. 1 5 − 22.25 5.82 ± 0.8 1 10.0 49 9.4 48 9.29 7 11 .7 5 4 m(4d) – X 10 7 16 425 498-423305 7 250.7 29 102 − 42.55 1605 − 10.65 − 22.7 6 5.7 8 ± 0.69 11 .1 59 10.556 10.303 1 3.6 46 m(4d) – – 11 2 16 4 426 1 5-42 1838 7 25 1. 108983 − 42.3 10 795 − 11 .00 − 21 .5 7 5.5 7 ± 0.26 10.849 10.503 10.4 18 1 2.2 1 2 nm – – 11 6 HD 32 1880 249.950060 − 40.3 11 165 − 1 3.85 − 22. 1 2 5.99 ± 0.25 8.7 33 8.089 7.9 11 10.70 4 nm (pho t,R V) – – 11 9 16 41 0838-40 160 7 8 250.28490 7 − 40.2688 74 − 1 2.03 − 20.8 7 5.53 ± 0.2 7 9.924 9.43 1 9.248 11 .5 4 7 m(4d) – X 1 22 163836 16-393 74 7 8 249.650689 − 39.629952 − 1 2.38 − 20.7 6 5.55 ± 0.25 9.932 9.33 1 9. 198 11 .46 7 m(4d) – – 1 23 163806 7 2-3935 17 8 249.5280 17 − 39.58830 1 − 1 3.7 2 − 21 .53 5.86 ± 0.29 10. 1 52 9.6 19 9.40 7 11 .933 m(4d) – – 1 24 163 7585 4-393322 1 249.493986 − 39.556 1 55 − 14.82 − 21 .7 7 6.03 ± 0.35 10.7 69 10.069 9.902 1 2.929 m(4d) – – 1 25 T Y C 7 858-3 10-1 249.5 71 28 1 − 39.4 7060 7 − 1 2. 16 − 21 .26 5.62 ± 0.2 1 9. 1 25 8.790 8.7 11 10. 105 m(5d) w/R V – – 1 26 HD 32 1933 250.560323 − 39.863 465 − 1 3.4 1 − 21 .38 5.79 ± 0.24 9.5 7 7 9. 105 8.9 74 10.809 m(5d) w/R V – X 1 2 7 T Y C 7 8 71-1 7 6-1 250.7 7 61 95 − 39.8 1 249 7 − 1 3.02 − 21 .30 5.7 2 ± 0.25 9.880 9.355 9.25 4 11 .35 1 m(4d) – X 1 3 4 16532843-405 7025 2 53.36848 1 − 40.950 71 7 − 9.8 1 − 22.20 5.56 ± 0.25 9.796 9.59 7 9.520 10.7 30 nm – – 1 3 7 16325 4 43-3843525 248.22680 1 − 38.7 31 28 1 − 11 .2 1 − 21 .98 5.65 ± 0.69 10.6 79 10.240 10.0 7 3 1 2.490 nm – – 1 38 1636390 4-39022 7 7 249. 162655 − 39.0 41 05 4 − 1 3.5 7 − 20.8 7 5.7 1 ± 0.2 7 9.680 9. 11 6 8.98 7 11 .582 m(4d) – – 1 39 HD 149 49 1 249.2 1 59 49 − 38.862 7 75 − 1 2.6 1 − 21 .59 5.7 4 ± 0.2 1 8.9 46 8.7 61 8.63 4 9.82 7 m(5d) w/R V H – 140 HD 32 1858 249.8 1 3 745 − 39.385 7 83 − 1 2.30 − 21 .90 5.7 7 ± 0.25 9.333 8.852 8.668 10.805 m(4d) – – 14 1 [SZB20 1 2] 86 249.9 4 71 4 7 − 39.3 4 456 1 − 11 .46 − 22.0 4 5.70 ± 0.8 1 10.490 9.7 53 9.60 4 1 2.7 5 4 m(4d) – X 142 T Y C 7 86 7-1 825-1 250.2053 41 − 39. 17 4 49 4 − 9.2 7 − 23.79 5.80 ± 0.2 7 10.3 1 3 9.9 42 9.803 11 .7 80 nm – – 143 16 403359-390 7 21 7 250 .1 40032 − 39. 1 22 7 20 − 1 3.63 − 20.9 7 5.7 3 ± 0.69 11 .402 10.7 36 10.50 7 1 3.8 14 m(4d) – – 14 4 163928 1 3-382423 1 249.86 7 256 − 38.406 428 − 11 .83 − 21 .33 5.59 ± 0.26 9.824 9.352 9.220 11 .233 m(4d) – X 148 16 485929-3935 423 252.24 7050 − 39.5950 75 − 9.65 − 22.39 5.5 7 ± 0.29 10.092 9.509 9.3 11 11 .82 7 m(4d) – X 149 16 4 7 2452-39 1848 1 25 1.852 162 − 39.3 1 336 4 − 10.33 − 21 .6 7 5.50 ± 0.26 9.9 19 9.439 9.28 1 11 .3 75 m(4d) – X 1 51 16382553-38 1 359 1 249.606386 − 38.23309 1 − 1 2.90 − 22. 16 5.88 ± 0.2 7 10.2 19 9.656 9.46 1 1 2.256 m(4d) – – 1 52 HD 1 506 41 250.985 4 42 − 38.333 792 − 1 3. 10 − 21 .7 6 5.82 ± 0.08 7.80 4 7.826 7.7 68 7.898 m(4d) H – 1 5 4 16 41 3 7 60-3 753 488 250.40668 1 − 3 7.896899 − 1 3.62 − 21 .25 5.7 7 ± 0.26 10. 100 9.520 9.380 11 .6 48 m(4d) – X 1 58 T Y C 7 868-1 00-1 252.50 7 688 − 3 7.839328 − 10.43 − 23. 17 5.80 ± 0.25 10.09 7 9.7 7 7 9.68 1 11 .1 79 nm – – 1 59 16522966-3928 195 253. 1 23626 − 39.4 7 21 0 7 − 1 2.02 − 20.84 5.5 1 ± 0.7 2 11 .069 10.46 0 10.323 1 3.098 m(4d) – – 16 1 T Y C 7 868-489-1 253.8 1 263 4 − 38.099953 − 11 .95 − 21 .80 5.69 ± 0.24 9. 1 36 8.522 8.4 11 10.906 m(4d) – X 16 4 HD 1 5200 1 253. 10389 1 − 3 7.60 7453 − 11 .90 − 22.40 5.80 ± 0.08 8.395 8.250 8.238 8.926 m(4d) H n 165 HD 1 50 439 250.6853 74 − 38.955 71 2 − 1 5.06 − 21 .99 6.09 ± 0. 14 8.036 7.829 7.7 45 8.89 1 m(5d) w/R V H N o tes. Columns of the table ar e lis ted as follo w s: Col. 1 lis ts the inter nal st ar number in the V1 062Sco MG and Col. 2 giv es the main identifier of the st ar in SIMB AD, resp. the 2MASS identifier ; Cols. 3 and 4 lis t the right ascension and declination, Cols. 5 and 6 giv e the pr oper mo tions right ascension and declination in the HSO Y cat alogue; Col. 7 lis ts the kinematic par allax and its mean er ror fr om the CP me thod; Cols. 8 to 10 giv e the J, H ,KS magnitudes fr om 2MASS; Col. 11 lis ts the mean G magnitude fr om Gaia DR1; Cols. 1 2 and 1 3 giv e the membership inf or mation and comments, and Cols. 14 and 1 5 lis ts the cr ossmatc h wit h Hoog er w er f ( 2000 ) and R OS A T -2RXS ( Boller et al. 20 16 ).
Table A.4. FEROS observation log.
No. MBJD Exp. time S/N RV Bisector CCF width
(s) (at 515 nm) (km s−1) (Å) 6 57 952.08029 300 71 +3.61 ± 0.21 −1.755 ± 0.011 29.5 10 57 952.13738 300 130 +2.40 ± 0.10 – 23.4 13 57 952.17475 300 127 +1.53 ± 0.07 – 19.1 14 57 952.18116 300 89 +1.79 ± 0.02 0.052 ± 0.010 8.1 15 57 952.19783 300 108 +1.95 ± 0.10 – 20.6 16 57 952.20420 300 138 +3.64 ± 0.31 1.542 ± 0.008 28.8 17 57 952.21987 300 39 +2.41 ± 0.04 – 11.2 17 57 952.22880 600 50 +2.42 ± 0.03 −0.032 ± 0.015 11.2 20 57 953.11131 300 159 +2.49 ± 0.10 – 24.8 21 57 953.13064 300 79 +2.97 ± 0.06 – 14.8 25 57 953.17448 600 91 +1.03 ± 0.02 −0.115 ± 0.010 10.6 25 57 953.16868 300 62 +1.11 ± 0.03 −0.113 ± 0.013 10.7 29 57 953.21403 300 165 +2.07 ± 0.36 −0.118 ± 0.007 29.1 34 57 954.14386 300 82 −79.66 ± 0.04 0.047 ± 0.011 6.1 34 57 954.13572 300 79 −79.19 ± 0.04 0.158 ± 0.011 6.1 34 57 954.14792 300 79 −79.79 ± 0.04 0.142 ± 0.011 6.1 34 57 954.13980 300 82 −79.35 ± 0.04 0.106 ± 0.011 6.1 35 57 954.25678 300 73 +7.02 ± 6.91 – 46.6 35 57 954.26084 300 74 −0.77 ± 6.78 0.122 ± 0.011 46.9 35 57 954.25272 300 96 +7.60 ± 5.56 0.352 ± 0.010 47.5 55 57 954.04746 300 152 −33.30 ± 0.02 0.939 ± 0.008 10.4 55 57 954.04341 300 149 −33.23 ± 0.02 – 10.5 55 57 954.03935 300 143 −33.24 ± 0.02 – 10.5 56 57 954.09113 300 102 +1.74 ± 0.05 – 14.3 56 57 954.09521 300 105 +1.83 ± 0.05 – 14.3 56 57 954.09925 300 97 +1.73 ± 0.05 −0.202 ± 0.010 14.3 116 57 954.12032 300 52 −66.09 ± 0.01 0.003 ± 0.014 4.5 116 57 954.11217 300 53 −65.97 ± 0.01 −0.148 ± 0.014 4.6 116 57 954.11625 300 53 −66.06 ± 0.01 0.054 ± 0.014 4.5 116 57 954.10811 300 53 −66.08 ± 0.01 0.093 ± 0.014 4.5 120 57 954.22716 300 171 −46.60 ± 0.01 0.055 ± 0.007 5.2 120 57 954.22292 300 176 −46.60 ± 0.01 0.042 ± 0.007 5.2 125 57 954.08564 300 102 −3.18 ± 0.01 0.025 ± 0.009 4.4 125 57 954.08159 300 102 −3.15 ± 0.01 0.070 ± 0.009 4.4 125 57 954.07754 300 102 −3.14 ± 0.01 0.077 ± 0.009 4.4 126 57 954.18753 300 32 +6.43 ± 0.02 0.102 ± 0.020 5.9 126 57 954.17533 300 64 +6.21 ± 0.01 0.135 ± 0.012 6.0 126 57 954.17940 300 62 +6.29 ± 0.01 0.129 ± 0.013 6.1 126 57 954.18347 300 56 +6.22 ± 0.01 0.069 ± 0.013 6.1 139 57 954.06148 300 124 +5.13 ± 0.06 0.126 ± 0.009 16.6 139 57 954.05741 300 127 +5.10 ± 0.06 – 16.5 139 57 954.05336 300 127 +5.06 ± 0.06 – 16.5 165 57 954.20870 300 89 +1.62 ± 0.11 – 20.7 165 57 954.21700 300 118 +1.46 ± 0.08 – 20.8 165 57 954.21293 300 97 +1.51 ± 0.10 – 20.7 165 57 954.20464 300 79 +1.14 ± 0.11 – 20.6
Notes. For each spectrum, we list the modified barycentric Julian Day, the integration time, S/N at 515 nm, RV, bisector value if it could be measured, and width of the CCF peak.
Table A.5. Astrophysical parameters of member stars in the V1062 Sco moving group, followed by 4 rejected candidates.
No. RV Teff log g v sin i [Fe/H]
(km s−1) (K) (km s−1) 6 +3.61 ± 0.21 6026 3.8 51.8 +0.22 10 +2.40 ± 0.10 6295 3.8 38.8 −0.02 13 +1.53 ± 0.07 6406 3.9 31.5 +0.08 14 +1.79 ± 0.02 5772 4.1 12.3 +0.04 15 +1.95 ± 0.10 6387 3.8 33.8 +0.04 16 +3.64 ± 0.31 6702 3.8 66.8 +0.10 17 +2.41 ± 0.02 5032 4.0 17.0 +0.16 20 +2.49 ± 0.10 5882 2.5 37.1 −0.52 21 +2.97 ± 0.06 – – – – 25 +1.06 ± 0.02 5332 4.2 16.7 +0.05 29 +2.07 ± 0.36 6197 4.0 79.2 −0.04 56 +1.77 ± 0.03 6144 4.0 23.5 +0.04 125 −3.16 ± 0.01 6254 4.3 4.9 +0.03 126 +6.26 ± 0.01 5336 4.2 8.1 +0.03 139 +5.10 ± 0.03 6383 3.9 27.5 +0.01 165 +1.45 ± 0.05 6204 3.9 33.2 +0.08 35 – 6020 3.5 119.9 +0.15 34 −79.50 ± 0.02 6790 3.6 8.8 −0.52 55 −33.26 ± 0.01 6508 4.3 17.0 +0.17 116 −66.05 ± 0.01 5022 2.7 5.0 −0.37 120 −46.60 ± 0.00 – – – –
Notes. The measurements are weighted averages when multiple spectra were observed. In this case the uncertainties are the error on the mean. Radial velocities are from the CERES pipeline; stellar parameters are from ZASPE.