19
F NMR In Vivo Spectroscopy Reflects the Effectiveness
of Perfusion-Enhancing Vascular Modifiers for Improving
Gemcitabine Chemotherapy
Greg O. Cron,
1Nelson Beghein,
1Re´ginald Ansiaux,
1Philippe Martinive,
2Olivier Feron,
2and Bernard Gallez
1*
Nuclear magnetic resonance spectroscopy of fluorine-19 (19F
NMR) has proven useful for evaluating kinetics of fluorinated chemotherapy drugs in tumors in vivo. This work investigated how three perfusion-enhancing vascular modifiers (BQ123, tha-lidomide, and Botulinum neurotoxin type A [BoNT-A]) would affect the chemotherapeutic efficacy of gemcitabine, a fluori-nated drug widely used in human cancer treatment. Murine tumor growth experiments demonstrated that only BoNT-A showed a strong trend to enhance tumor growth inhibition by gemcitabine (1.7 days growth delay, Pⴝ 0.052, Student t-test). In accord with these results,19F NMR experiments showed that
only BoNT-A increased significantly the uptake of gemcitabine in tumors (50% increase, Pⴝ 0.0008, Student t-test). Further experiments on gemcitabine kinetics (NMR vs time) and distri-bution (19F MRI) confirmed the uptake-enhancing properties of
BoNT-A. The results of this study demonstrate that19F NMR can
monitor modulation of the pharmacokinetics of fluorinated che-motherapy drugs in tumors. The results also show that19F NMR
data can give a strong indication of the effectiveness of perfu-sion-enhancing vascular modifiers for improving gemcitabine chemotherapy in murine tumors.19F NMR is a promising tool for
preclinical evaluation of such vascular modifiers and may ulti-mately be used in the clinic to monitor how these modifiers affect chemotherapy. Magn Reson Med 59:19 –27, 2008. © 2007 Wiley-Liss, Inc.
Key words: fluorine NMR; cancer; BQ123; thalidomide; Botox
Nuclear magnetic resonance spectroscopy of fluorine-19 nuclei (19F NMR) has proven to be a useful tool for
inves-tigating noninvasively the pharmacokinetics of fluorinated chemotherapy drugs in tumors in vivo (1– 4). 19F NMR
experiments performed on humans (5–7) and animals (8 –
23) have found significant correlations between cancer treatment success, normal tissue toxicity, the presence or absence of externally administered biological modifiers (e.g., carbogen), and the uptake and elimination of fluori-nated chemotherapy drugs in tumors and normal tissues. Until now, most such19F NMR studies have focused on
the chemotherapy drug 5-fluorouracil. Only a small num-ber of studies have dealt with the newer fluorinated che-motherapy drug gemcitabine (21,22). Moreover, to our knowledge, no19F NMR study has been performed using a
biological modifier that acts directly on tumor vasculature to enhance the perfusion (delivery) of the chemotherapy drug. In the context of cancer treatment, this approach is being pursued actively in preclinical models (24) and in the clinic (25) to enhance the delivery of chemotherapeu-tic agents and increase the efficacy of the treatment. In our laboratory, we have been experimenting with three such perfusion-enhancing vascular modifiers (BQ123, thalido-mide, and Botulinum neurotoxin type A [BoNT-A]), with the goal of increasing tumor perfusion transiently to boost the effectiveness of radiotherapy and chemotherapy (26 – 30). BQ123 is an endothelin receptor antagonist that in-duces tumor vessel dilation by blocking the effect of en-dothelin-1 (ET-1), a very active vasoconstrictor released by tumor cells (26). Thalidomide, an antiangiogenic agent, has recently been shown to increase tumor blood flow transiently by means of a phenomenon referred to as “nor-malization” of the tumor vasculature (pruning away of less functional vessels) (27–29). BoNT-A has been demon-strated to open up tumor vasculature (i.e., open previously constricted or closed vessels) by decreasing vascular tone (30). These three compounds are possible candidates for clinical use in combination with cytotoxic therapies. Agents that inhibit endothelin-1 receptors have already been used in clinical trials for prostate cancer (31,32). Thalidomide is one of the most studied antiangiogenic agents in clinical trials, including usage in combination with chemotherapeutic agents (33). Finally, BoNT-A has been widely used in the clinic with a long-term estab-lished absence of toxicity (absence of systemic effects) when used appropriately (34). Thus, it is certainly valid to envision clinical trials with local administration of BoNT-A in easily accessible tumors.
The original purpose of this work was to test how those three vascular modifiers would affect gemcitabine chemo-therapy. After some murine tumor growth experiments (described below), we found that only BoNT-A enhanced
1Laboratory of Biomedical Magnetic Resonance and Laboratory of Medicinal
Chemistry and Radiopharmacy, Universite´ Catholique de Louvain, UCL, Brus-sels, Belgium.
2Unit of Pharmacology and Therapeutics, Universite´ Catholique de Louvain,
UCL, Brussels, Belgium.
Grant sponsor: the Belgian National Fund for Scientific Research (FNRS); Grant sponsor: the Fonds Joseph Maisin; Grant sponsor: the Saint-Luc Foundation; Grant sponsor: the “Actions de Recherches Concerte´es-Com-munaute´ Franc¸aise de Belgique-ARC”; Grant number: 04/09-317; Grant sponsor: the “Poˆle d⬘attraction Interuniversitaire PAI VI”; Grant number: P6/ 38.
Dr. Cron’s present address is Magnetic Resonance Imaging, Ottawa Health Research Institute, 501 Smyth Road, Ottawa, ON, K1H 8L6 Canada. *Correspondence to: Bernard Gallez, CMFA/REMA, Avenue Mounier 73.40, B-1200 Brussels, Belgium. E-mail: [email protected]
Received 27 April 2007; revised 5 October 2007; accepted 7 October 2007. DOI 10.1002/mrm.21469
Published online 29 November 2007 in Wiley InterScience (www.interscience. wiley.com).
19
© 2007 Wiley-Liss, Inc.
significantly gemcitabine chemotherapy. To gain some un-derstanding of these results, we then used19F NMR in vivo
to measure the effect of the modifiers on the uptake of gemcitabine in the tumors. For the modifier that had the most spectacular effect (BoNT-A), we performed further
19F NMR experiments to study gemcitabine elimination
and distribution (the latter through19F MR imaging).
MATERIALS AND METHODS
All experiments were performed according to national an-imal care regulations. Intramuscular hepatomas were im-planted in the gastrocnemius muscle of the right hind limb of male NMRI (Naval Marine Research Institute) mice (⬃30–35 g, Janvier) (35). These tumors are hypoxic (oxy-gen partial pressure⬍ 5 mmHg) and poorly perfused (typ-ically less than half of tumor volume with measurable perfusion), thus mimicking cancers in the clinic that are highly resistant to radiation therapy and chemotherapy. Five different groups of these tumors were grown (on different dates), for a total of 124 tumors (Table 1). Tumor diameters (anterior–posterior axis) were measured manu-ally using calipers (26 –28,30). To maximize consistency, the same experimenter (G.O.C.) performed all diameter measurements. Treatments for a given tumor were begun on “day 0,” when the tumor had reached a diameter of ⬃6 mm. The diameter of the tumors on day 2 was 8.0 ⫾ 0.1 mm (numbers given as mean⫾ SEM unless otherwise stated). Based on T2-weighted imaging of the mice used for
NMR/MRI (groups 2 through 5 in Table 1), the three-dimensional volume of the tumors on day 2 was 0.85⫾
0.03 cm3. Previously acquired (unpublished) MRI data in
our laboratory relating the volume of these tumors to man-ually measured anterior–posterior diameter indicate that a diameter of 6 mm corresponds to a tumor volume of ap-proximately 0.55 cm3(15 mm corresponds to⬃2.7 cm3). In
Table 1, “DMSO” refers to an intraperitoneal (i.p.) injec-tion of 100L dimethyl sulfoxide (DMSO); “BQ123” refers to an i.p. injection of 1 mg/kg BQ123 (Sigma, Bornem, Belgium); “thal.” refers to an i.p. injection of 200 mg/kg racemic thalidomide (Sigma-Aldrich, Bornem, Belgium) dissolved in a volume of 100 L of DMSO; “BoNT-A” refers to an intratumoral injection of Botulinum neuro-toxin type A (BoNT-A; Botox威, Allergan, Antwerp, Bel-gium; 2 injections of 20l at different sites, corresponding to a total dose of 29 U kg⫺1); and “gemci.” refers to an i.p. injection of gemcitabine (Gemzar威, Eli Lilly) at 5 mg/kg for group 1, 800 mg/kg for groups 2– 4, and 1600 mg/kg for group 5. “BQ123⫹gemci.” indicates that BQ123 was ad-ministered at the same time as gemcitabine (separation⬍ 2 min). A dash “-” indicates no treatment or a sham treat-ment with saline solution. It should be noted that, when a treatment was performed on a mouse, the treatment was only administered once on the given day. The scheduling, doses, and routes of administration of BQ123, thalido-mide, and BoNT-A followed those of previously published work and have been shown to increase tumor perfusion significantly (26 –28,30).
For NMR and MR imaging experiments, animals were anesthetized by inhalation of isoflurane mixed with air in a continuous flow (1.8 l/h), delivered by a nose cone. Anesthesia was initiated with 3% isoflurane, then stabi-lized at⬃1.5% isoflurane for 10 min before any manipu-lation. Animals were maintained at 37°C in the MRI scan-ner by flushing warm air inside the bore.
Tumor Growth Experiments
A group of 70 tumors was prepared for growth experi-ments (group 1 in Table 1). This group was subdivided into eight subgroups of tumors, each subgroup receiving a different treatment regimen shown by the table. The gem-citabine dose of 5 mg/kg used for this group was chosen after performing separate tumor growth experiments (data not shown) to investigate the efficacy of different doses of gemcitabine varying from 0 to 100 mg/kg. Those experi-ments showed that 5 mg/kg was below the efficacy thresh-old for this product, which ensured that any improve-ments in efficacy conferred by the biological modifiers (BQ123, thalidomide, BoNT-A) would be reflected in the growth curves. After treatments were performed on days 0 –2, each tumor was allowed to grow until it reached a diameter of 15 mm (volume⬃2.7 cm3), at which point the
mouse was killed. The time to grow from 8 mm (volume ⬃0.85 cm3) (on day 2) to 15 mm (volume⬃2.7 cm3) was
recorded for each tumor. Differences in this growth time between the different subgroups were assessed by means of the Student t-test.
19F and1H NMR Spectroscopy of Gemcitabine
Implementation of Spectroscopy and Phantom Validation
MR imaging and spectroscopy experiments were performed with a Bruker Biospec 4.7T MRI scanner (Karlsruhe,
Ger-Table 1
Tumor Groups and Corresponding Treatments Tumor growth experiments (n⫽ 70 total)
n day 0 day 1 day 2
group 1 9 – – – 7 DMSO DMSO – 9 thal. thal. – 10 BoNT-A – – 10 – – gemci. 5 – – BQ123⫹ gemci.
11 thal. thal. gemci.
9 BoNT-A – gemci.
Initial uptake experiments (n⫽ 45 total)
n day0 day 1 day 2
group 2 9 – – gemci.
9 – – BQ123⫹ gemci.
group 3 5 DMSO DMSO gemci.
6 thal. thal. gemci.
group 4 8 – – gemci.
8 BoNT-A – gemci.
Kinetics experiments (n⫽ 6 total)
n day 0 day 1 day 2
subset of group 4
3 – – gemci.
3 BoNT-A – gemci.
19F imaging experiments (n⫽ 9 total)
n day 0 day 1 day 2
group 5
4 – – gemci.
many) and a 25-mm diameter surface coil that could be tuned separately to either1H (200.1 MHz) or19F (188.3 MHz).
Pre-liminary experience showed that the tumor 19F signal of
gemcitabine (administered i.p. to the mouse) was very small (gemcitabine spectrum height divided by standard deviation of noise was less than 5 for a gemcitabine dose of 100 mg/kg, 150 averages, repetition time⫽ 6 s). Thus, every possible effort was made to maximize the 19F signal-to-noise ratio
(SNR). NMR spectroscopy was performed in a nonlocalized manner (simple excite–acquire pulse sequence) to sample the earliest possible time points of the free induction decay (FID) and thereby increase spectra SNR. For mouse tumor experiments, the surface coil was placed directly on the tumor in such a way as to maximize the NMR signal received from the tumor and minimize the signal from the upper leg and paw. The tail and non–tumor-bearing left hind limb were positioned completely outside the sensitive volume of the coil. A small, sealed glass capillary tube containing a small sample of hexafluorobenzene was permanently affixed to the underside of the coil. This procedure provided a consistent
19F signal easily distinguishable from gemcitabine (⬃51 ppm
downfield from gemcitabine) which was used for quality assurance purposes (more details given at the end of this section). As has been the case in previous work, the gemcit-abine parent compound and metabolites were not distin-guishable in the19F spectra (21,22). Thus, gemcitabine was
treated as a single peak.1H and19F spectroscopy were
per-formed with the following parameters: excitation angle⫽ 90°, spectral width⫽ 25 kHz, acquisition size ⫽ 8k, repeti-tion time⫽ 6 s (to ensure complete relaxation). For1H
spec-troscopy, an 80-s-long block radio frequency (RF) excitation pulse was used, whereas for19F spectroscopy a 20-s-long
block pulse was used. Four averages were acquired for1H
spectroscopy, whereas 150 averages were acquired for 19F
spectroscopy (total19F acquisition time⫽ 15 min). The
fre-quency of the RF excitation pulse was centered directly on the water peak for1H spectroscopy and⬃7 ppm downfield of
the gemcitabine peak for19F spectroscopy. FIDs were Fourier
transformed (exponential line broadening 25 Hz for19F
spec-tra), phased, and baseline corrected. The real part of each spectrum was integrated over the water peak for1H
spectros-copy (integration width⫽ 20 ppm) and over the gemcitabine peak for19F spectroscopy (integration width⫽ 12 ppm). Each
integral was divided by the receiver gain number used for that acquisition. (The receiver gain for19F spectroscopy was
always set to the same value, which was the maximum pos-sible for the scanner.) A relative measure of the concentration of gemcitabine measured by spectroscopy ([gem]rel) was then
obtained by dividing the gemcitabine integral by the water integral.
Ten aqueous ⬃1-ml plastic centrifuge tubes were pre-pared with known concentrations of gemcitabine (range, 0 –3 mM). These phantoms were used to test the reproduc-ibility and linearity of [gem]relas a function of gemcitabine
concentration. [gem]rel measurements with these
phan-toms were found to be linear with gemcitabine concentra-tion (R⫽ 0.99) with a slope of 0.135 mM⫺1. [gem]rel
mea-surements were henceforth multiplied by the inverse of that slope, 7.41 mM, so that the numerical values of [gem]relwould be approximately equal to the absolute
con-centrations of gemcitabine in mM. The equality between [gem]rel and absolute concentration is only approximate,
because it assumes uniform distribution of gemcitabine, homogeneous unit density of tissue, and no NMR-invisible
1H or19F nuclei. [gem]
relmeasurements were found to be
reproducible to within⬍ 10% (⬃0.16 mM), even when the phantoms were completely removed from the scanner and put back in with different geometrical orientations (neces-sitating new shimming). For repeat measurements on the same phantom (not removed from the scanner), the repro-ducibility improved to⬍ 7% (⬃0.11 mM).
For the in vivo19F spectroscopy data, the integral of the
real part of the spectrum peak corresponding to the hexafluorobenzene reference tube (integration width ⫽ 18 ppm) was very stable from experiment to experiment, varying by less than 7.5% of the mean for all studies (standard deviation⫽ 3.7% of the mean). The positions (in frequency) of the gemcitabine and hexafluorobenzene peaks were very stable as well (7.3⫾ 0.2 ppm for gem-citabine, ⫺43.5 ⫾ 0.6 ppm for hexafluorobenzene, mean ⫾ standard deviation, transmitter frequency ⫽ 188.2805 MHz). Thus, from a quality assurance viewpoint, we considered that all our spectroscopy data were valid.
Initial Uptake in Tumors In Vivo
Three separate groups of tumors were prepared for NMR experiments investigating the initial uptake of gemcitabine in tumors (groups 2, 3, and 4 in Table 1). Each of these groups was divided into a control subgroup (gemcitabine only) and a treatment subgroup (gemcitabine⫹ modifier). On day 2, gemcitabine (800 mg/kg) was injected i.p. into the awake mouse in a fume hood facility approved for the handling of chemotherapeutic agents. The dose of 800 mg/kg provided gemcitabine concentrations in the tumor of⬃1–2 mM. This dose was chosen to ensure ade-quate SNR and reproducibility for19F spectroscopy.
Pre-liminary in vivo19F spectroscopy tumor experiments with
gemcitabine doses of 100, 200, 400, and 800 mg/kg had given SNRs (gemcitabine spectrum height divided by stan-dard deviation of baseline noise) of approximately 4, 6, 13, and 25, respectively (same 15-min acquisition described above). Our technical goal was an SNR of at least 20 for a 15-min acquisition (repetition time⫽ 6 s), leading to our choice of the 800 mg/kg dose. This dose is within the range of single-dose chemotherapy experiments which have been performed safely by other investigators (i.e., no acute [⬃hours] toxicity) (36).
After gemcitabine administration, the mouse (under isoflurane anesthesia) was transported to the MRI facility and installed in the MRI scanner. The surface coil was initially set to1H mode for shimming, preliminary imaging
(to check positioning), and1H spectroscopy. Immediately
afterward, the coil was set to19F mode and one
spectros-copy acquisition was begun. This acquisition commenced 37.5 min after the i.p. injection of gemcitabine and fin-ished 52.5 min after the injection (15-min acquisition). Thus, the mean acquisition time post-i.p. was considered to be 45 min (⫽ the mean of 37.5 and 52.5 min). After the end of the19F acquisition, the coil was switched back to1H
mode for multislice proton-density and T2-weighted
imag-ing of the tumor. For proton density-weighted imagimag-ing, a gradient echo pulse sequence was used with field of view (FOV)⫽ 40 mm, matrix ⫽ 64 ⫻ 64, 20 transverse (axial)
slices, slice thickness⫽ 2 mm, repetition time ⫽ 5 s, echo time ⫽ 4.5 ms, and flip angle ⫽ 90°. For T2-weighted
imaging, a fast spin echo pulse sequence was used with FOV⫽ 40 mm, matrix ⫽ 128 ⫻ 128, 20 transverse (axial) slices, slice thickness⫽ 2 mm, repetition time ⫽ 4 s, and effective echo time⫽ 50 ms.
For each tumor, the1H and19F spectroscopy data were
used to compute the value of [gem]rel 45 min post-i.p.
injection of gemcitabine. For each tumor group (i.e., groups 2, 3, and 4 in Table 1), all [gem]rel values were
normalized to the average value found for the control subgroup. This was done to facilitate comparisons be-tween groups. For each tumor group, [gem]relvalues for the
control subgroup were compared with values for the treat-ment subgroup by means of the Student t-test.
Nonlocalized spectroscopy measurements gather NMR signals not only from the tumor, but also from adjacent muscle, fat, skin, and any other structure that is within the sensitive volume of the surface coil. The proton-density and T2-weighted images were used to estimate the
percent-age of total NMR signal produced by the tumor alone, to rule out any biases in the data that could be caused by variations in tissue composition. Regions of interest (ROIs) were drawn around the tumor on the T2-weighted images.
These ROIs were then used to compute the percentage of total MRI signal in the proton-density–weighted images contributed by the tumor.
For five mice in each subgroup of group 4 (BoNT-A experiments),⬃1 ml of blood was withdrawn by means of cardiac puncture at the end of the experiment (60 min post-i.p. injection of gemcitabine). The blood was placed in a plastic heparinized centrifuge tube, and a [gem]rel
measurement was performed in the scanner to obtain an estimate of the concentration of gemcitabine in the blood. This procedure was to verify that any differences in tumor [gem]relbetween the control and treatment subgroups were
not due simply to differences in gemcitabine blood con-centration.
Kinetics in Tumors In Vivo (BoNT-A Experiments)
Six tumors (three controls, three treated with BoNT-A) from group 4 were used to investigate [gem]relas a function
of time. The protocol and analysis were similar to the initial uptake experiments, except that 16 sequential19F
acquisitions were performed instead of 1. Additionally, a maximum possible effort was made to perform the initial steps of the protocol quickly (transportation of the mouse, installation in the scanner, and so on), which allowed the mean acquisition time post-i.p. of the first19F spectrum to
be 30 min (start of acquisition⫽ 22.5 min, end of acqui-sition⫽ 37.5 min) instead of the usual mean acquisition time of 45 min. For each tumor, the1H and19F
spectros-copy data were used to compute the value of [gem]relas a
function of time post-i.p. injection of gemcitabine. Here, [gem]rel values were not normalized to the control
sub-group. These [gem]relvs time data were then used to
com-pute the area under the curve (AUC, for all time points) and the slope of the elimination phase of the curve (linear regression performed on time points⬎ 120 min).
19F MR Imaging of Gemcitabine in Tumors In Vivo
19F MR imaging of gemcitabine was performed on a group
of nine tumors (four control, five treated with BoNT-A, group 5 in Table 1). The protocol was similar to that used for the spectroscopy experiments. The gemcitabine dose used for19F imaging was 1600 mg/kg instead of 800 mg/kg.
This doubling of the dose used for spectroscopy was deemed necessary after preliminary experiments showed that the 19F image SNR would not be adequate with
800 mg/kg. To our knowledge, 1600 mg/kg administered to a mouse is greater than any single dose that has ever been used by other investigators. Thus, to ensure a lack of acute (⬃hours) toxicity, a separate group of five mice (not in-cluded in Table 1) was injected with that dose and ob-served for 24 hr. No deaths, weight loss, or adverse behav-ioral effects were observed for that time period.
For the 19F imaging experiments, after the mice were
installed in the MRI scanner, the1H mode of the surface
coil was used for shimming and preliminary imaging (to check positioning). The coil was then switched to 19F
mode. One19F spectrum was acquired to find the precise
center frequency of the gemcitabine peak. Using this as the center transmit frequency, a 19F gradient echo imaging
pulse sequence was then commenced. This pulse se-quence acquired a single projection image (i.e.,⬃infinite slice thickness) in the coronal plane. Other parameters were as follows: FOV⫽ 70 mm, matrix ⫽ 32 ⫻ 32, repe-tition time⫽ 6 s, echo time ⫽ 2.1 ms, flip angle ⫽ 90°, number of averages⫽ 16, total acquisition time ⫽ 51 min. A gaussian RF pulse shape with length 680s was used for excitation. This pulse had no significant spectral power at frequencies farther than⬃5 kHz from the center frequency. This ensured that the19F signals from the isoflurane
anes-thetic (⬃6.4 kHz upfield of the gemcitabine peak) and the hexafluorobenzene sample (⬃9.6 kHz downfield) would not contaminate the gemcitabine images. The time be-tween the i.p. injection of gemcitabine and the midpoint of the19F image acquisition was 62 min.
After 19F imaging, the coil was switched back to 1H
mode. A proton-density–weighted projection image was acquired, whose pulse sequence was nearly identical to the one used for19F imaging (except 2 averages and center
frequency set to the water peak). Finally, a T2-weighted
projection image was acquired (FOV⫽ 70 mm, matrix ⫽ 128⫻ 128, repetition time ⫽ 4 s, echo time ⫽ 50 ms).
The pixel values of the19F and proton density projection
images were divided by their respective receiver gain numbers. (The receiver gain for19F imaging was always set
to the same value, which was the maximum possible for the scanner.) An ROI was drawn around the empty space (air) surrounding the tumor mass in the19F image to
com-pute the mean and standard deviation of the image noise. Pixels whose 19F signal did not exceed the mean noise
level by at least 2 SDs were excluded from further analysis. It should be noted that the image noise in empty space (air) has a Rayleigh distribution with nonzero mean, which may differ from the noise distribution of the object in the image (37). Our simple calculations of the mean and stan-dard deviation of the noise were not used for any analyses, only for thresholding. Pixels whose proton density signal was less than 10% of the maximum signal in the tumor
mass were also excluded. An estimate of the [gem]rel
dis-tribution (i.e., a [gem]relimage) was then obtained by
di-viding the 19F image by the proton density image. The
[gem]relvalues for all images were then normalized to the
average of the [gem]rel values for the control group, to
facilitate comparisons.
RESULTS
Tumor Growth Experiments
The mice tolerated all treatments well, with no deaths and minimal weight loss (ⱕ 5%; drugs administered as in Table 1 group 1, then mice monitored daily with no further treatments up to 12 days postgemcitabine). Tumors in animals treated with gemcitabine grew more slowly than those in animals which were not treated with gemcitabine (8.1⫾ 0.3 days vs 5.8 ⫾ 0.3 days, n ⫽ 35 vs 35, P ⬍ 0.0001, all subgroups combined, where “days” refers to the num-ber of days required for the tumor to grow from 8 mm [volume⬃0.85 cm3] to 15 mm [volume⬃2.7 cm3]). Among
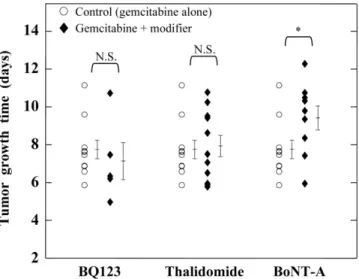
animals not treated with gemcitabine, there was no signif-icant difference in tumor growth observed between sub-groups. Among animals treated with gemcitabine, the re-sults of the different subgroups are shown in Figure 1. There was no significant difference in tumor growth be-tween the control subgroup (gemcitabine only) and the treatment (gemcitabine ⫹ modifier) subgroups, with the exception of BoNT-A. Tumors treated with gemcitabine plus BoNT-A grew more slowly than tumors treated with gemcitabine only (9.4⫾ 0.6 days vs 7.7 ⫾ 0.5 days, n ⫽ 9 vs 10, P⫽ 0.052).
19F and1H NMR Spectroscopy of Gemcitabine
Initial Uptake in Tumors In Vivo
Figure 2 shows example in vivo19F NMR spectra. Figure 3
shows the results of the 19F spectroscopy initial uptake
experiments. Similar to the tumor growth experiments, there was no significant difference in gemcitabine uptake between the control subgroups (gemcitabine only) and the treatment (gemcitabine ⫹ modifier) subgroups, with the exception of BoNT-A. Tumors treated with BoNT-A had a higher uptake of gemcitabine than controls (50% more,
P⫽ 0.0008). Additionally, there was no significant
differ-ence in [gem]rel between blood samples withdrawn from
BoNT-A–treated mice and blood samples withdrawn from controls (2.9⫾ 0.4 mM vs 3.2 ⫾ 0.3 mM, where relative concentrations of gemcitabine were converted to estimates of absolute concentration by means of the scaling factor described in the Materials and Methods section). Finally, the estimate of the fraction of total NMR signal attributable to the tumor did not vary significantly between subgroups (MRI signal intensity from tumor volume divided by total MRI signal intensity⫽ 0.63 on average).
Kinetics in Tumors In Vivo (BoNT-A Experiments)
Figure 4 shows the results of the gemcitabine kinetics experiments involving BoNT-A. For this figure, relative concentrations of gemcitabine were converted to absolute ones (mM) by means of the scaling factor described in the Materials and Methods section. The approximate symbol (⬃) has been placed in front of the mM symbol, however, because the conversion makes unverified assumptions of uniform distribution of gemcitabine, homogeneous unit density of tissue, and no NMR-invisible1H or19F nuclei.
Tumors treated with BoNT-A received more gemcitabine over time than controls: The average AUC for the former subgroup was 40% higher than for the latter (356⫾ 14 vs 252⫾ 22, units of mM min, P ⫽ 0.02, Student t-test). No statistically significant difference in elimination rate was observed between the two subgroups (0.0025 ⫾ 0.0005 mM/min for the control group vs 0.0038 ⫾ 0.0011 mM/min for the BoNT-A group).
19F MRI of Gemcitabine in Tumors In Vivo
Figure 5 shows example images from the19F imaging
ex-periments. Pooling all [gem]relvalues for all pixels of the
treatment group (141 total pixels for the 5 animals) and comparing them with those of the control group (120 total pixels for the 4 animals), the [gem]relvalues for the
treat-ment group were significantly higher than those of the control group (1.21 ⫾ 0.07 vs 1.00 ⫾ 0.05, P ⫽ 0.015, Student t-test). Taking the average [gem]relvalue for each
image and comparing the two groups (5 [gem]relvalues for
the treatment group vs 4 [gem]rel values for the control
group), the treatment group had higher [gem]relvalues but
the difference was not quite statistically significant (1.22⫾ 0.10 vs 1.00⫾ 0.05, P ⫽ 0.1).
DISCUSSION
The results of the initial uptake experiments closely matched those of the tumor growth experiments (compare
FIG. 1. Time for murine intramuscular hepatomas to grow to 15 mm diameter (volume⬃2.7 cm3; starting point⫽ 8.0 ⫾ 0.1 mm, volume
⬃0.85 cm3). Thirty-five tumors (grown using the same cell
suspen-sion and same batch of mice) were divided into four experimental subgroups. The control subgroup (n⫽ 10) was treated with gem-citabine 5 mg/kg alone. The other three subgroups were treated with gemcitabine plus a modifier (BQ123, n⫽ 5; thalidomide, n ⫽ 11; and BoNT-A, n⫽ 9). The results of the control group (circles) are shown next to the results of each modifier group for comparison. Vertical brackets to the right of each group show mean⫾ SEM for that group. N.S.⫽ no significant difference between groups. * ⫽ significant difference between groups, student t-test, P⫽ 0.052.
Figs. 1 and 3). Among the three modifiers, only BoNT-A showed a strong trend to enhance tumor growth inhibition by gemcitabine (P⫽ 0.052) and gemcitabine uptake (P ⫽ 0.0008). Considering the results qualitatively, there ap-pears to be the same trend in both figures whereby BQ123 is the least effective modifier, followed by thalidomide, followed by the most effective modifier BoNT-A. The re-sults of the kinetics experiments in Figure 4 confirm that BoNT-A does indeed increase significantly the exposure of the tumor to gemcitabine (greater AUC, P⫽ 0.02). Thus, it appears that the differences in gemcitabine chemosensiti-zation for the three modifiers can be explained by corre-sponding differences in gemcitabine tumor uptake en-hancement that they confer.
This study supports the assumption that 19F NMR
ex-periments can provide a reliable description of the phar-macokinetics of fluorinated chemotherapy drugs in tu-mors. In the context of the current work, these results suggest that19F NMR data can give a strong indication of
the effectiveness of perfusion-enhancing vascular modifi-ers for improving gemcitabine chemotherapy in murine tumors.
At this time, it is not fully understood why the three modifiers affect gemcitabine uptake in tumors differently (and thus, chemosensitize differently). The data presented in this work are the first systematic, direct, comparison of the perfusion-enhancing and chemosensitization abilities of the three modifiers. Considering previously published data, however, it is possible to make some approximate comparisons of the three modifiers based upon laser Dopp-ler imaging and Patent Blue staining (26 –28,30). In the same tumor model, BQ123 and thalidomide were each found to cause an increase in laser Doppler-measured tu-mor blood flow of ⬃25% (relative to controls) (26,27). Thalidomide was found to increase the amount of tumor exposed to Patent Blue staining by⬃70% (relative to con-trols) (27), whereas BoNT-A was found to increase the amount of tumor exposed to Patent Blue staining by
FIG. 2. Example in vivo19F NMR spectra for intramuscular hepatomas as a function of time after i.p. injection of gemcitabine 800 mg/kg.
Identical scales have been used for all spectra. Each spectrum shows isoflurane peaks (⬃ ⫹45 ppm), the gemcitabine peak (⬃ ⫹7 ppm), and the hexafluorobenzene reference peak (⬃ ⫺45 ppm). a: Spectra for a control tumor (no vascular modifiers administered). b: Spectra for a tumor pretreated with BoNT-A.
⬃105% (30). This comparison of the three modifiers, al-though not rigorous, is consistent with the current study, where it was found that BoNT-A provided superior perfu-sion enhancement compared with the other two modifiers. Of note, our study does not exclude that thalidomide and BQ123 administered according to a different scheme (e.g., repeated exposure or higher dosage) might lead to a sig-nificant gain in chemotherapy uptake.
The dose of gemcitabine that was used for the in vivo19F
spectroscopy tumor experiments (800 mg/kg) is higher than that used in similar work by previous investigators (e.g., 160 and 500 mg/kg for references 21 and 22). How-ever, these previous studies used tumor models different from ours, did not report spectra SNR, and did not report estimates of absolute gemcitabine concentration in tumor, making comparisons with our work difficult. Relative to our 19F spectroscopy acquisition parameters, the study
performed with 160 mg/kg used a smaller spectral width (20 kHz), wider line broadening (40 Hz), longer acquisition times (30 min), and a shorter repetition time (1.5 s, which provides more FIDs and thus more averaging), all of which boost SNR (21). We used a long repetition time (6 s) to ensure complete spin-lattice relaxation of the19F nuclei,
thus improving quantification. It should also be noted that the dose of 800 mg/kg used in our study is higher than that used for clinical human chemotherapy (⬃300–350 mg/kg equivalent for a 25-g mouse). It is expected that these clinical doses would still provide adequate SNR if 19F
NMR gemcitabine spectroscopy studies were performed on humans, especially given the typically large size of human tumors compared with murine tumors. We also note that, although a dose of 800 mg/kg caused no acute toxicity in our and other studies, we currently have no data on how such a high dose may affect tumor perfusion by means of either direct effects on tumor endothelium or nonspecific effects (36).
FIG. 3. Relative concentration of gemcitabine in tumor mass 45 min after i.p. injection of gemcitabine 800 mg/kg, as measured by in vivo NMR spectroscopy. Three different groups of murine intramuscular hepatomas, each subdivided into a control and modifier group, were investigated: BQ123 (n⫽ 9 controls, 9 treated with modifier); thalidomide (n⫽ 5 controls, 6 modifier); and BoNT-A (n ⫽ 8 con-trols, 8 modifier). For each of the three groups, relative gemcitabine concentrations (⬃mM) were normalized to the mean value found for the control group. Vertical brackets to the right of each group show mean⫾ SEM for that group. N.S. ⫽ no significant difference be-tween groups. ***⫽ highly significant difference between groups, student t-test, P⫽ 0.0008.
FIG. 4. Kinetics of the relative concentration of gemcitabine in the tumor mass after i.p. injection of gemcitabine 800 mg/kg, as mea-sured by in vivo NMR spectroscopy. Six murine intramuscular hep-atomas were subdivided into a control (n⫽ 3) and BoNT-A modifier (n⫽ 3) group. Data points (mean ⫾ SEM) were obtained by aver-aging the concentrations from the three tumors of that group. The units of the vertical axis are absolute gemcitabine concentrations in millimolar (mM). For this figure, relative concentrations of gemcit-abine were converted to absolute ones by means of the scaling factor described in the Materials and Methods section. The approx-imate symbol (⬃) has been placed in front of the mM symbol, however, because the conversion makes unverified assumptions of uniform distribution of gemcitabine, homogeneous unit density of tissue, and no NMR-invisible1H or19F nuclei.
FIG. 5. Results of two murine intramuscular hepatoma imaging experiments. All images are projections (single-slice,⬃infinite slice thickness) in the coronal plane (FOV⫽ 7 cm, images cropped). Top row: a control study. Bottom row: a BoNT-A modifier study. Shown are 128⫻ 128 T2-weighted1H images (leftmost column), 32⫻ 32
proton density-weighted 1H images (second column), 32x32 19F
images (third column), and 32⫻ 32 images of relative concentration of gemcitabine (rightmost column). Color scale shows relative con-centration of gemcitabine. (Relative concon-centrations of gemcitabine have been normalized to the average value for the control group, to facilitate comparisons.)
For the NMR spectroscopy experiments involving the initial uptake of gemcitabine, the relative concentration of gemcitabine was measured essentially at a single time point (45 min post-i.p.). From a pharmacokinetics view-point, it is better to measure the entire time course (e.g., from 0 to 250 min) and compute the AUC to obtain a measure of the exposure of the tumor to the drug. Com-pared with a single time point, the AUC is less affected by any potential animal-to-animal variations in the vascular input function and tumor pharmacokinetic parameters (e.g., tumor blood volume, capillary permeability, rates of cellular uptake and metabolism). AUC experiments are expensive, however, requiring large amounts of scanner time per animal. The strategy that we have envisioned is thus to use the single-time-point experiments as an initial “screening” test of the effectiveness of the vascular modi-fiers, followed up by AUC and19F imaging experiments if
the results are promising. It should be kept in mind that, according to pharmacokinetic theory, it is possible for the results of single-time-point experiments to contradict those of AUC experiments, depending upon when the single time point is acquired. For the long-acting vascular modifiers used in this study (constant or gradually increas-ing effects with time constants rangincreas-ing from hours to days), we believe that such a scenario is unlikely to have happened, especially considering the agreement with the tumor growth experiments.
We note that safety regulations prohibited us from han-dling chemotherapy drugs in the MRI laboratory, which prevented us from injecting gemcitabine while the animals were in the scanner (to obtain data starting at time 0). Collecting data from time 0 would not have changed the overall result of the BoNT-A AUC experiments (Fig. 4), however. This is because the control data (open circles) reached peak concentration at⬃90 min. Pharmacokinetic theory would predict a smooth connection for the control data (i.e., relatively straight line) between 0 and 30 min, making it impossible for the AUC of the control data to exceed that of the BoNT-A data (filled squares).
Until now, few studies have attempted to obtain19F MR
images of the distribution of fluorinated chemotherapy drugs, and none of these have demonstrated sufficient19F
sensitivity to image individual tumors in any appreciable detail (23). Figure 5 shows19F MR images that we obtained of
gemcitabine in tumors in vivo (spatial resolution⫽ 2.2 mm). To our knowledge, these are the most detailed such images that have been published to date. There was a strong trend of higher [gem]relvalues in the group treated with BoNT-A (P⫽
0.015 when all pixels are pooled into treatment vs control groups), which is consistent with the spectroscopy experi-ments. Moreover, we observed qualitatively a “ring” en-hancement pattern (more gemcitabine in the periphery of the tumor compared with the center, e.g., Fig. 5 BoNT-A) in at least five of the nine tumors, which is consistent with tumor perfusion patterns often found with Gadolinium-enhanced MRI (38). Although these19F MRI results are very
encourag-ing, the quality of the images still warrants improvement. It may be possible to increase the SNR of the images, for exam-ple, by acquiring the low-frequency components of the k-space lines (containing the most important image informa-tion) earlier in the free induction decay, thereby shortening the effective echo time.
CONCLUSIONS
The results of this study support the assumption that19F
NMR experiments can provide a reliable description of the pharmacokinetics of fluorinated chemotherapy drugs in tumors. The results also show that19F NMR data can give
a strong indication of the effectiveness of perfusion-en-hancing vascular modifiers for improving gemcitabine chemotherapy in murine tumors.19F NMR is a promising
tool for preclinical evaluation of such vascular modifiers and may ultimately be used in the clinic to monitor how these modifiers affect chemotherapy.
ACKNOWLEDGMENT
The authors thank Dr. Arturo Cardenas-Blanco for helpful discussions regarding statistical issues.
REFERENCES
1. van Laarhoven HW, Punt CJ, Kamm YJ, Heerschap A. Monitoring fluoropyrimidine metabolism in solid tumors with in vivo (19)F mag-netic resonance spectroscopy. Crit Rev Oncol Hematol 2005;56:321– 343.
2. Yu JX, Kodibagkar VD, Cui W, Mason RP. 19F: a versatile reporter for non-invasive physiology and pharmacology using magnetic resonance. Curr Med Chem 2005;12:819 – 848.
3. Martino R, Malet-Martino M, Gilard V. Fluorine nuclear magnetic res-onance, a privileged tool for metabolic studies of fluoropyrimidine drugs. Curr Drug Metab 2000;1:271–303.
4. Robinson SP, Barton SJ, McSheehy PM, Griffiths JR. Nuclear magnetic resonance spectroscopy of cancer. Br J Radiol 1997;70:60 – 69. 5. van Laarhoven HW, Klomp DW, Kamm YJ, Punt CJ, Heerschap A. In
vivo monitoring of capecitabine metabolism in human liver by 19flu-orine magnetic resonance spectroscopy at 1.5 and 3 Tesla field strength. Cancer Res 2003;63:7609 –7612.
6. Dzik-Jurasz AS, Collins DJ, Leach MO, Rowland IJ. Gallbladder local-ization of (19)F MRS catabolite signals in patients receiving bolus and protracted venous infusional 5-fluorouracil. Magn Reson Med 2000;44: 516 –520.
7. Wolf W, Presant CA, Waluch V. 19F-MRS studies of fluorinated drugs in humans. Adv Drug Deliv Rev 2000;41:55–74.
8. van Laarhoven HW, Gambarota G, Lok J, Lammens M, Kamm YL, Wagener T, Punt CJ, van der Kogel AJ, Heerschap A. Carbogen breath-ing differentially enhances blood plasma volume and 5-fluorouracil uptake in two murine colon tumor models with a distinct vascular structure. Neoplasia 2006;8:477– 487.
9. McSheehy PM, Port RE, Rodrigues LM, Robinson SP, Stubbs M, van der Borns K, Peters GJ, Judson IR, Leach MO, Griffiths JR. Investigations in vivo of the effects of carbogen breathing on 5-fluorouracil pharmacoki-netics and physiology of solid rodent tumours. Cancer Chemother Pharmacol 2005;55:117–128.
10. Kamm YJ, Peters GJ, Hull WE, Punt CJ, Heerschap A. Correlation between 5-fluorouracil metabolism and treatment response in two vari-ants of C26 murine colon carcinoma. Br J Cancer 2003;89:754 –762. 11. Kamm YJ, Heerschap A, Wagener DJ. Effect of carbogen breathing on
the pharmacodynamics of 5-fluorouracil in a murine colon carcinoma. Eur J Cancer 2000;36:1180 –1186.
12. Katzir I, Shani J, Wolf W, Chatterjee-Parti S, Berman E. Enhancement of 5-fluorouracil anabolism by methotrexate and trimetrexate in two rat solid tumor models, Walker 256 carcinosarcoma and Novikoff hepa-toma, as evaluated by 19F-magnetic resonance spectroscopy. Cancer Invest 2000;18:20 –27.
13. Lemaire LP, McSheehy PM, Griffiths JR. Pre-treatment energy status of primary rat tumours as the best predictor of response to 5-fluorouracil chemotherapy: a magnetic resonance spectroscopy study in vivo. Can-cer Chemother Pharmacol 1998;42:201–209.
14. McSheehy PM, Robinson SP, Ojugo AS, Aboagye EO, Cannell MB, Leach MO, Judson IR, Griffiths JR. Carbogen breathing increases 5-flu-orouracil uptake and cytotoxicity in hypoxic murine RIF-1 tumors: a magnetic resonance study in vivo. Cancer Res 1998;58:1185–1194.
15. McSheehy PM, Seymour MT, Ojugo AS, Rodrigues LM, Leach MO, Judson IR, Griffiths JR. A pharmacokinetic and pharmacodynamic study in vivo of human HT29 tumours using 19F and 31P magnetic resonance spectroscopy. Eur J Cancer 1997;33:2418 –2427.
16. Holland SK, Bergman AM, Zhao Y, Adams ER, Pizzorno G. 19F NMR monitoring of in vivo tumor metabolism after biochemical modulation of 5-fluorouracil by the uridine phosphorylase inhibitor 5-benzylacyc-louridine. Magn Reson Med 1997;38:907–916.
17. Blackstock AW, Kwock L, Branch C, Zeman EM, Tepper JE. Tumor retention of 5-fluorouracil following irradiation observed using 19F nuclear magnetic resonance spectroscopy. Int J Radiat Oncol Biol Phys 1996;36:641– 648.
18. Kamm VJ, Rietjens IM, Vervoort J, Heerschap A, Rosenbusch G, Hofs HP, Wagener DJ. Effect of modulators on 5-fluorouracil metabolite patterns in murine colon carcinoma determined by in vitro 19F nuclear magnetic resonance spectroscopy. Cancer Res 1994;54:4321– 4326. 19. Shungu DC, Bhujwalla ZM, Li SJ, Rose LM, Wehrle JP, Glickson JD.
Determination of absolute phosphate metabolite concentrations in RIF-1 tumors in vivo by 31P–1H-2H NMR spectroscopy using water as an internal intensity reference. Magn Reson Med 1992;28:105–121. 20. McSheehy PM, Prior MJ, Griffiths JR. Prediction of 5-fluorouracil
cyto-toxicity towards the Walker carcinosarcoma using peak integrals of fluoronucleotides measured by MRS in vivo. Br J Cancer 1989;60:303– 309.
21. Blackstock AW, Lightfoot H, Case LD, Tepper JE, Mukherji SK, Mitchell BS, Swarts SG, Hess SM. Tumor uptake and elimination of 2 ⬘,2⬘-difluoro-2⬘-deoxycytidine (gemcitabine) after deoxycytidine kinase gene transfer: correlation with in vivo tumor response. Clin Cancer Res 2001;7:3263–3268.
22. Kristjansen PE, Quistorff B, Spang-Thomsen M, Hansen HH. Intratu-moral pharmacokinetic analysis by 19F-magnetic resonance spectros-copy and cytostatic in vivo activity of gemcitabine (dFdC) in two small cell lung cancer xenografts. Ann Oncol 1993;4:157–160.
23. Brix G, Bellemann ME, Haberkorn U, Gerlach L, Bachert P, Lorenz WJ. Mapping the biodistribution and catabolism of 5-fluorouracil in tumor-bearing rats by chemical-shift selective 19F MR imaging. Magn Reson Med 1995;34:302–307.
24. Brunstein F, Eggermont AMM, Aan de Wiel-Ambagtsheer G, Van Tiel ST, Rens J, Ten Hagen TLM. Synergistic antitumor effects of histamine plus melphalan in isolated hepatic perfusion for liver metastases. Ann Surg Oncol 2007;14:795– 801.
25. Gupta N, Saleem A, Kotz B, Osman S, Aboagye EO, Phillips R, Vernon C, Wasan H, Jones T, Hoskin PJ, Price PM. Carbogen and nicotinamide increase blood flow and 5-fluorouracil delivery but not 5-fluorouracil retention in colorectal cancer metastases. Clin Cancer Res 2006;12: 3115–3123.
26. Sonveaux P, Dessy C, Martinive P, Havaux X, Jordan BF, Gallez B, Gregoire V, Balligand JL, Feron O. Endothelin-1 is a critical mediator of myogenic tone in tumor arterioles: implications for cancer treatment. Cancer Res 2004;64:3209 –3214.
27. Ansiaux R, Baudelet C, Jordan BF, Beghein N, Sonveaux P, De Wever J, Martinive P, Gregoire V, Feron O, Gallez B. Thalidomide radiosensi-tizes tumors through early changes in the tumor microenvironment. Clin Cancer Res 2005;11:743–750.
28. Segers J, Fazio VD, Ansiaux R, Martinive P, Feron O, Wallemacq P, Gallez B. Potentiation of cyclophosphamide chemotherapy using the anti-angiogenic drug thalidomide: importance of optimal scheduling to exploit the ’normalization’ window of the tumor vasculature. Cancer Lett 2006;244:129 –135.
29. Jain RK. Normalizing tumor vasculature with anti-angiogenic therapy: a new paradigm for combination therapy. Nat Med 2001;7:987–989. 30. Ansiaux R, Baudelet C, Cron GO, Segers J, Dessy C, Martinive P, De
Wever J, Verrax J, Wauthier V, Beghein N, Gregoire V, Buc Calderon P, Feron O, Gallez B. Botulinum toxin potentiates cancer radiotherapy and chemotherapy. Clin Cancer Res 2006;12:1276 –1283.
31. Carducci MA, Padley RJ, Breul J, Vogelzang NJ, Daliani DD, Schulman CC, Nabulsi AA, Humerickhouse RA, Weinberg MA, Schmitt JL, Nel-son JB. Effect of endothelin-A receptor blockade with atrasentan on tumor progression in men with hormone-refractory prostate cancer: a randomized, phase II, placebo-controlled trial. J Clin Oncol 2003;21: 679 – 689.
32. Michaelson MD, Kaufman DS, Kantoff P, Oh WK, Smith MR. Random-ized phase II study on Atrensentan alone or in combination with zoledronic acid in men with metastatic prostate cancer. Cancer 2006; 107:530 –535.
33. Figg WD, Li H, Sissung T, Retter A, Wu S, Gulley JL, Arlen P, Wright JJ, Parnes H, Fedenko K, Latham L, Steinberg SM, Jones E, Chen C, Dahut W. Pre-clinical and clinical evaluation of estramustine, docetaxel and thalidomide combination in androgen-independent prostate cancer. Br J Urol 2007;99:1047–1055.
34. Klein AW. Complications, adverse reactions, and insights with the use of botulinum toxin. Dermatol Surg 2003;29:549 –556
35. Taper HS, Woolley GW, Teller MN, Lardis MP. A new transplantable mouse liver tumor of spontaneous origin. Cancer Res 1966;26:143–148. 36. Fields MT, Eisbruch A, Normolle D, Orfali A, Davis MA, Pu AT, Lawrence TS. Radiosensitization produced in vivo by once- vs. twice-weekly 2⬘2⬘-difluoro-2⬘-deoxycytidine (gemcitabine). Int J Radiat Oncol Biol Phys 2000;47:785–791.
37. Gudbjartsson H, Patz S. The rician distribution of noisy MRI data. Magn Reson Med 1995;34:910 –914.
38. Hayes C, Padhani AR, Leach MO. Assessing changes in tumour vascu-lar function using dynamic contrast-enhanced magnetic resonance im-aging. NMR Biomed 2002;15:154 –163.