HAL Id: hal-01343083
https://hal.univ-lorraine.fr/hal-01343083
Submitted on 20 Jun 2019
HAL is a multi-disciplinary open access archive for the deposit and dissemination of sci-entific research documents, whether they are pub-lished or not. The documents may come from teaching and research institutions in France or abroad, or from public or private research centers.
L’archive ouverte pluridisciplinaire HAL, est destinée au dépôt et à la diffusion de documents scientifiques de niveau recherche, publiés ou non, émanant des établissements d’enseignement et de recherche français ou étrangers, des laboratoires publics ou privés.
Measuring mutual solubility in the H2O–CO2 system up
to 200 bar and 100°C by in situ Raman spectroscopy
Marie-Camille Caumon, Jérôme Sterpenich, Aurélien Randi, Jacques Pironon
To cite this version:
Marie-Camille Caumon, Jérôme Sterpenich, Aurélien Randi, Jacques Pironon. Measuring mutual solubility in the H2O–CO2 system up to 200 bar and 100°C by in situ Raman spectroscopy. Interna-tional Journal of Greenhouse Gas Control, Elsevier, 2016, 47, pp.63-70. �10.1016/j.ijggc.2016.01.034�. �hal-01343083�
1
Measuring mutual solubility in the H2O-CO2 system up to 200 bar and 100 °C by
in situ Raman spectroscopy.
Marie-Camille Caumona*, Jérôme Sterpenicha, Aurélien Randia, Jacques Pironona
a Université de Lorraine, CNRS, CREGU, GeoRessources laboratory, BP 70239, F-54506 Vandœuvre-lès-Nancy, France
The solubility control in the H2O-CO2 system under high pressure is of prime interest in numerous geochemical systems from hydrothermal fluids to CO2 geological storage. However, the number of experimental data is scarce in the range of interest of geological storage, especially in the CO2-rich phase. A new experimental device was built to measure mutual solubility in the CO2-H2O system without sampling by coupling a batch reactor with Raman immersion probes. The system was first calibrated by measuring the solubility of CO2 in water at 100 °C. The results were provided with an accuracy of a few % between 40 bar and 200 bar and in agreement with other published experimental data sets and models. The linear correlation between Raman peak intensity and CO2 solubility in the aqueous phase was then used to provide new experimental data of CO2 solubility in water at 65 °C from 3 to 200 bar. The Raman data of the CO2-rich phase or supercritical phase are compared to a
thermodynamic models and the few experimental data available in literature to provide a new data set of H2O-CO2 mutual solubility at 100 °C and up to 200 bar.
Keywords: CO2 geological storage; water; solubility; Raman spectroscopy; vapor
1 INTRODUCTION
Carbon dioxide is ubiquitous on Earth, as a gas composing almost 400 ppm of the atmosphere, through solubilization as a dissolved species responsible for acidification of the oceans, or trapped in minerals as a
major component of sedimentary rocks. CO2
plays also an important role as a fluid circulating in the crust, originating from hydrocarbon oxidation, carbonate dissolution or magma degassing. Consequently, CO2 is present under various conditions of pressure and temperature ranging from very low values at the surface of the Earth to pressures reaching several kilobars and temperatures of several hundreds of degrees in deep Earth. The determination of the thermodynamic
properties of CO2 is of prime interest to understand and predict its behavior through the geological and atmospheric cycles or for carbon sequestration. The geological storage of CO2 would be efficient if it is in a critical state, i.e. at temperature higher than 31.1°C
and pressure higher than 73.8 bar.
Supercritical CO2 behaves like a gas by filling all the available volume but has a liquid-like density, increasing storage capacity (Bachu, 2000). Considering a hydrostatic pressure, these conditions are reached above 800 m. At this depth, assuming a thermal gradient in the crust of around 25°C.km-1, temperature is around 35°C. These P-T conditions have to be considered as minima for an efficient CO2 storage so most of the storage reservoirs
2 temperature and pressure (35 to 150°C and 80
to 250 bar or more) (Li et al., 2011). Numerous studies were published under
various pressure-temperature-composition
(PTX) ranges to cover CO2 storage conditions, in particular in the H2O-CO2 system. In this system, one of the key parameter to define thermodynamic equilibria is CO2 solubility. If CO2 solubility in water is rather well documented at temperature higher than 100 °C, measurements at lower temperature and mutual solubility of water in the CO2-rich phase are sparse (Marini, 2006; Spycher et al., 2003).
The usual experimental and analytical techniques are based on the sampling of the phases before analysis by chromatography, mass spectrometry or weighing (see Diamond and Akinfiev, 2003; Duan and Sun, 2003; Guo et al., 2014; Spycher et al., 2003 for references). However, the sampling operation may induce a perturbation of the system (pressure and temperature decrease, fluid displacement), which can be of a great influence under conditions where the system is close to instability. Moreover, it is not suitable for the analysis of the vapor phase and real-time monitoring of the system. To
prevent from these problems, optical
spectroscopy analyses can be directly
performed without sampling, by the
interaction of light with the sample. Three different systems are described in literature.
White (2010) carried out solubility
measurements by Raman spectroscopy using an autoclave equipped with a sapphire window. The author showed a linear relation between the solubility of CO2 and the relative Raman intensity of its peaks in the range 1-17 bar and 0-50 °C, both in pure H2O and synthetic seawater. Liu et al. (2012) developed a microfluidic approach to measure CO2 solubility up to 100 °C, 100 bar and 3 M
NaCl, using a silicon microreactor.
Calculating peak intensity ratio between CO2 and the OH stretching vibration band of water, the authors showed a loss of linearity between the Raman signal and CO2 solubility with increasing NaCl concentration. Capillary
tubes were used to measure CO2 solubility in pure H2O in an extended range of pressure and temperature (0-300°C, 100-1200 bar) (Lu et al., 2007; Guo et al., 2014), or in H2O-NaCl media within a reduced range of PT conditions (Belgodere et al., 2015). These studies confirmed the linear relation between CO2 Raman signal and solubility over these ranges of pressure and temperature.
In this paper, we develop a new method to measure mutual solubility in both the H2 O-rich phase (called “liquid phase”) and the CO2-rich phase (called “vapor phase”, even if CO2 is in the supercritical domain above 73.9 bar) at 250 °C. The technical apparatus is based on a stainless steel autoclave equipped with two immersion probes to carry out in situ Raman analyses of both the liquid and vapor phases. The method is first calibrated at 100 °C by comparing the Raman data with the numerous CO2 solubility data from literature. Then the system is used to provide new data of mutual solubility at 100 °C in the CO2-rich phase, and CO2 solubility data at 65 °C in the liquid water phase.
2 MATERIAL AND METHODS
2.1 Experimental device
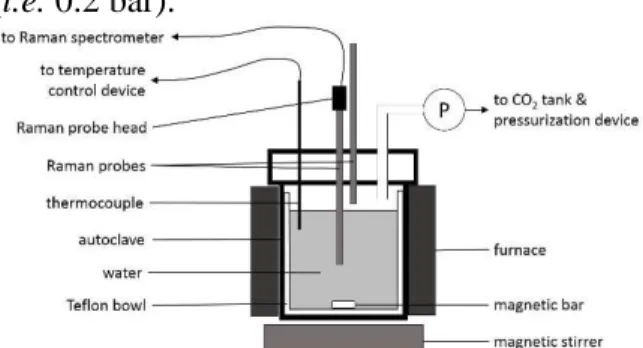
The reactor (Fig. 1) is the IMAGES batch reactor described in Sterpenich et al. (2009). It consists of a 316 stainless steel autoclave of a volume of 2 L placed in a band heater and connected to a hydropneumatic pump to inject CO2 (CO2 N45, 99.995 % , Air Liquide). A Teflon bowl is placed in the autoclave to avoid the contact of the aqueous solution with steel and so, to reduce the risk of chemical contamination through corrosion and to remove laser reflections on the metallic surface of the autoclave. The device runs at a maximum pressure of 300 bar, and a maximum temperature of 250 °C. The temperature of the oven is controlled by a thermocouple put in a stainless steel thermowell and dipped into the autoclave. The top of the autoclave is covered with alumina wool to limit heat convection inside the autoclave by thermal isolation. Pressure and
3 temperature are externally controlled and
continuously monitored and recorded.
Temperature is calibrated using a field metrology well with 0.35 °C accuracy in the range 50-250 °C, and controlled to ± 0.1 °C. The pressure transducer is calibrated using a Fluke pressure calibrator (range of 0 to 350 bar) with an accuracy of 0.05 % of full scale (i.e. 0.2 bar).
Fig. 1: scheme of the IMAGES experimental design.
2.2 Raman spectroscopy
Two immersion probes are crimped in the cover of the autoclave to collect Raman scattering (immersion optics from Kaiser Optical Systems, model IO-18L-VIS). The length of the immersion probes is of 18 inches and the diameter is of 0.5 inch. They can operate up to 450 °C and 200 bar. They are equipped with a sapphire window at one end and connected to the Raman spectrometer by a removable Raman probe head. One of the probes is immerged in the liquid phase, and the second one is positioned in the vapor phase a few centimeters under the autoclave lid. Isolating protective tubes cover the external part of the immersion optics to limit heat dispersion and liquid condensation on the sapphire window at the end of the probe placed in the vapor phase.
The spectrometer is a RXN1 spectrometer from Kaiser Optical Systems equipped with a Nd:YAG laser at 532 nm, with a power of ~25 m W after the sapphire window, a multiplex holographic grating, and a CCD detector cooled down to - 40 °C by Peltier effect. The multiplex holographic grating consists of two tilted holographic gratings illuminating two different areas of the CCD. In this configuration, the low part of the spectrum (<
2375 cm-1) comes from one grating
illuminating one part of the CCD and the high part of the spectrum (> 2375 cm-1) comes from the second grating illuminating a second part of the CCD. The spectral resolution is of ~ 3 cm-1 at 1400 cm-1. Spectrometer response,
Raman shift wavenumbers and laser
wavelength are calibrated using cyclohexane, a Neon lamp and a white lamp with a known
continuous emission spectrum (HCA
calibration accessory, Kaiser Optical
Systems). The acquisition time and the number of accumulations are defined in a way to optimize the signal-to-noise ratio, usually 30 s and 4 to 8 accumulations. Dark is subtracted and spectra are corrected from the instrument function (Intensity calibration on).
2.3 Experimental procedure
First, the autoclave is filled with 1.0 L of fresh MilliQ water (18.2 MΩ.cm) and closed. Temperature is set to 65 °C or 100 °C and let to reach equilibrium for 24 hours. A first series of Raman spectra is recorded in both phases without CO2 to record a blank spectra and to get the Teflon signal, then CO2 is added step by step (usually 10-20 bar). In the first steps of CO2 injection, it can be as long as 24 hours to reach equilibrium (following pressure and Raman signal stabilities). In the last steps, as the solution is almost saturated with CO2, equilibria can be reached within 4 hours. Pressure variations are of ± 0.3 bar at equilibrium. Raman spectra are acquired continuously using iC Raman software (Kaiser Optical Systems, Inc.) to check equilibrium. When both Raman signal and pressure reach equilibrium, several Raman spectra are acquired successively (usually 5-10 spectra per step). At 5-100 °C, the Raman spectra of the liquid phase and of the vapor phase are both acquired. As the spectrometer is a mono-channel one (only one Raman probe head), the spectra at equilibrium are first acquired in one of the two phases using a first probe. Then the Raman head is removed from the probe and fixed on the second one to record the Raman spectra in the other phase. Despite the use of isolating tubes on the immersion probes, liquid water drops
4 sometimes condense on the sapphire window
of the probe placed in the vapor phase. As a consequence, the spectra acquired when a drop of liquid water was present are excluded from the data set as they are a combination of signals coming from the liquid and the vapor phases.
2.4 Raman analysis
2.4.1 Principles of quantitative analysis by Raman spectroscopy
The integrated intensity of a Raman signal (peak area) is a function of the number of the analyzed species in the scattering volume (concentration), of the relative differential scattering cross section (RDSCS) of the species (Schrötter and Klöckner, 1979) and also of instrumental and physical parameters (Long, 1977), such as laser power and wavelength, instrument optics, detector response or the refractive index of the analyzed medium:
Equation 1 :
= × × ×ξ ×
with Ai the integrated intensity of the peak, I0
the laser irradiance, Ci the concentration of the
species i in the scattering volume,
σ
i theRDSCS of the vibration,
ξ
i the instrumentfunction at the wavenumber of the vibration and t the acquisition time. For a two-component system, the two species are analyzed at the same time, then I0 and t are
equal. The relative concentrations can thus be expressed as: Equation 2 : = ⁄ ×ξ ×ξ ⁄ = ∗ ⁄ ∗ ⁄
with ∗the apparent RDSCS of the species i combining the RDSCS and the instrument function (Dubessy et al., 1989; Schrötter and Klöckner, 1979; Wopenka and Pasteris, 1987, 1986). Here the ratio ACO2 / AH2O is calculated and plotted as a function of dissolved CO2 concentration (molality in mol.kg-1
H2O). The slope of the curve combines the RDSCS of the two species and the instrument function.
2.4.2 Raman data processing
Raman data are analyzed using the NGSLabspec software (Horiba Jobin-Yvon). Following Equation 2, the concentration of CO2 must be proportional to the peak area ratio but some authors said that the correlation was better using peak intensity ratios (Azbej et al., 2007; Guo et al., 2014). Here both peak intensities and areas are measured. A straight baseline is subtracted using the same anchorage points for all spectra: at 1150 cm-1 and 1450 cm-1 for dissolved CO2, 1450 cm-1 and 1850 cm-1 for liquid H2O, 1174 and 1474 cm-1 for gaseous CO2, and in a 30 cm-1-wide range centered on the peak maximum position for gaseous H2O. No smoothing nor peak fitting are processed. Peak intensities (or heights) are measured at the peak maximum position at 1383 ± 1 cm-1 for dissolved CO2, 1638 ± 1 cm-1 for liquid water, 1387 ± 1 cm-1 for gaseous CO2, and between 3639 cm-1 and 3654 cm-1 for gaseous H2O following the shift with pressure of the peak maximum position. A Teflon signal coming from the bowl superimposes to CO2, with three peaks of low intensity at 1378 cm-1, 1296 cm-1 and 1216 cm-1. Teflon peak intensity and area are measured at exactly the same position as for dissolved and gaseous CO2 from spectra recorded before the injection of CO2 in the autoclave. The Teflon-to-H2O peak intensity and area ratios are then subtracted to all further CO2/H2O ratios.
The solubility of CO2 in water (mol.kg-1H2O) and the molar fractions of H2O and CO2 in the vapor phase are calculated as a function of
pressure and temperature using a
thermodynamic model. Several models exist for the H2O-CO2-salt system (Akinfiev and Diamond, 2010; Duan and Sun, 2003; Dubessy et al., 2005; Enick and Klara, 1990; Søreide and Whitson, 1992; Spycher et al., 2003). The model of Duan and Sun (Duan and Sun, 2003) is selected because of an a priori best agreement with experimental data from literature in the ranges of pressure and temperature of the present study (Marini, 2006; Wang et al., 2013).
5 Peak intensity and area ratios are plotted
versus the solubility of CO2 and the molar fraction ratio yCO2/yH2O in the vapor phase. The fit parameters and statistics are calculated
using Origin 8 software (OriginLab
corporation) and GUM_MC software
(Biansan, 2015). The uncertainty of the thermodynamic model is considered using direct weighting by experiment and model
uncertainties in the fitting process.
Uncertainties from experimental data, fitting procedure and thermodynamics model are combined using a Monte Carlo method, following the recommendations of the Guide to the expression of Uncertainty in Measurement (GUM) (BIPM, 2008a, 2008b). Uncertainties are given to 95 % of confidence. The ratios of the peak area and peak height (or peak intensity) of the stretching vibration of CO2 and the bending vibration of H2O are linearly proportional to CO2 concentration, probably because the shape of the peaks remains constant over the whole range of pressure. The peak intensity ratios are greater than the peak area ratios and cover a greater range of variation. The sensitivity of the correlation is thus better using the peak intensity ratios. This is in agreement with the observations of Azbej et al. (2007) and Guo et
al. (2014). In the vapor phase, both peak
intensity and peak area ratios are presented and discussed.
3 RESULTS 3.1 Dissolved CO2
3.1.1 Raman spectra
Fig. 2 shows some of the Raman spectra collected in the liquid phase as a function of pressure at 100 °C. The band around 1640 cm -1 is the bending vibration of liquid water (Walrafen and Blatz, 1973). The Raman peaks of Teflon are visible at low pressure at 1216, 1296, and 1378 cm-1 (Hannon et al., 1969). They superimpose to the CO2 Fermi doublet of dissolved CO2 at 1276 cm-1 and 1384 cm-1. The peak position of the Fermi doublet remains about constant within ± 1 cm-1 with temperature and pressures. The intensity of the doublet increases with pressure but the
band position and intensity are constant with increasing pressure. A small peak is also visible at 1555 cm-1 and is assigned to atmospheric O2 trapped along the optical path (probes, optical fiber, and spectrometer). A small negative artifact is also visible on the bending band of water. It is due to a recurrent defect in the subtracted dark spectrum.
Fig. 2: Raman spectra of dissolved CO2 in water at various pressures (bar) at 100 °C. T: Teflon. The peak at 1555 cm-1 comes from atmospheric O2 trapped in the probe. The spectra are offset for clarity.
3.1.2 Raman data vs. CO2 solubility at 100
°C
Fig. 3 shows the correlation between the Raman peak intensity ratio ICO2/IH2O measured by Raman spectroscopy and the solubility of CO2 calculated at each P using the Equation of State (EoS) of Duan and Sun (2003). A calibration curve is calculated by fitting the data with a straight line with a slope equal to 4.93 ± 0.03 (95%) and an intercept fixed to zero. The adjusted R² is equal to 0.99957. The thermodynamic model uncertainty is of 7 % (Duan and Sun, 2003). It results that the solubility of CO2 can be determined by Raman spectroscopy using this experimental device with an accuracy of a few percent at 100 °C. Fig. 4 shows CO2 solubility (mol.kg
-6 1
H2O) as a function of pressure (bar) from the present study, data calculated with the EoS of Duan and Sun (2003) and literature experimental data (see legend in Fig. 4 for references). The coupling between a Raman spectrometer and the IMAGES experimental device can provide solubility data as accurate (~ a few %) as the one found in literature at 100 °C.
Fig. 3: ICO2/IH2O peak intensity ratio as a function of CO2 solubility (mol.kg-1
w) calculated from the thermodynamic model of Duan and Sun (2003) at 100 °C. Void circles: experimental data points; line: linear fit of the data (R2 = 0.99957).
Fig. 4: CO2 solubility (mol.kg-1w) as a function of pressure (bar) at 100 °C. Line: thermodynamic model of Duan and Sun (2003); Void circles: this study; plain triangles: literature data (Bohr and Bock, 1891; Drummond, 1981; Hou et al., 2013; Koschel et al., 2006; Langlais, 2013; Lucile et al., 2012; Malinin and Kurovskaya, 1975; Müller et al., 1988; Sabirzyanov et al., 2003; Shagiakhmetov and Tarzimanov, 1981; Wiebe and Gaddy, 1939; Zawisza and Malesinska, 1981)
3.1.3 New solubility data at 65 °C
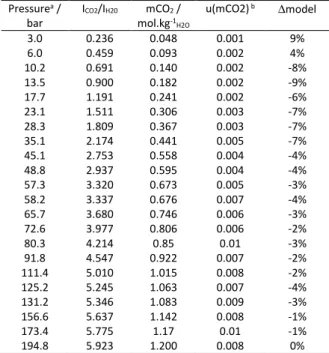
The Raman spectra of CO2 dissolved in pure H2O are recorded at 65 °C as a function of pressure using the same device and the same protocol as used at 100 °C. CO2 solubility is calculated at 65 °C applying the calibration
curve determined at 100 °C (Fig. 3) to the ICO2/IH2O peak intensities ratio (Fig. 5 and Table 1). The uncertainty is calculated combining the experimental uncertainty of the intensity ratio and the uncertainty of the calibration line slope. The resulting relative standard uncertainty is of ~1 % above 10 bar (cf. Table 1).The use of this calibration curve is only possible if the RDSCS of the CO2 stretching vibration band and the H2O bending band remain constant between 65 °C and 100 °C or vary of the same factor.
Fig. 5: CO2 solubility as a function of pressure at 65 °C calculated from Raman data and fit at 100 °C (Fig. 3). Line: thermodynamic model of Duan and Sun (2003); Void circles: this study (average value, Y-error bar equal or lower to point size); plain triangles: literature data (Bermejo et al., 2005).
Pressurea / bar ICO2/IH20 mCO2 / mol.kg-1H2O u(mCO2) b ∆model 3.0 0.236 0.048 0.001 9% 6.0 0.459 0.093 0.002 4% 10.2 0.691 0.140 0.002 -8% 13.5 0.900 0.182 0.002 -9% 17.7 1.191 0.241 0.002 -6% 23.1 1.511 0.306 0.003 -7% 28.3 1.809 0.367 0.003 -7% 35.1 2.174 0.441 0.005 -7% 45.1 2.753 0.558 0.004 -4% 48.8 2.937 0.595 0.004 -4% 57.3 3.320 0.673 0.005 -3% 58.2 3.337 0.676 0.007 -4% 65.7 3.680 0.746 0.006 -3% 72.6 3.977 0.806 0.006 -2% 80.3 4.214 0.85 0.01 -3% 91.8 4.547 0.922 0.007 -2% 111.4 5.010 1.015 0.008 -2% 125.2 5.245 1.063 0.007 -4% 131.2 5.346 1.083 0.009 -3% 156.6 5.637 1.142 0.008 -1% 173.4 5.775 1.17 0.01 -1% 194.8 5.923 1.200 0.008 0%
Table 1: CO2 solubility (mol.kg-1w) at 65 °C in pure H2O calculated from the calibration line in Fig. 3 as a function of pressure (bar), and difference with the EOS of Duan and Sun (2003) (∆model / %). The values are the mean of 5 to 10 measurements at a given pressure.
7
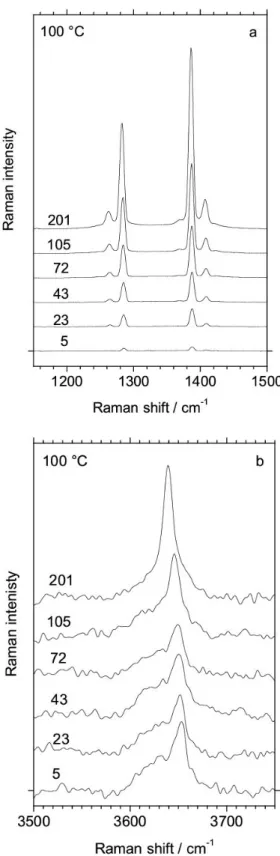
Fig. 6: Raman spectra of CO2 (a) and H2O (b) in the vapor phase at various pressures (bar) at 100 °C. Notice that the intensity scale of the two frames are different, the water peak intensity being about equal to the one of CO2 at the lowest pressure (5 bar). The spectra are offset for clarity.
3.2 CO2-rich phase at 100 °C
3.2.1 Raman spectra
The Fermi doublet of gaseous or supercritical CO2 is set at 1285 cm-1 and 1388 cm-1. It shifts of ~ 2 cm-1 toward lower wavenumbers and increases in intensity with pressure (Fig. 6a). The two small peaks on each side are hot bands. No discontinuity is observed at the
transition between the gas and the
supercritical fluid (73.9 bar). The difference of position between the two peaks of the CO2 Fermi doublet increases with density (see references in Fig. 6 of Frezzotti et al., 2011) but in our case, the resolution of the spectrometer (~ 3 cm-1) is too low to observe it. The Raman peak of gaseous H2O shifts from 3653 cm-1 to 3639 cm-1 from 5 to 200 bar (Fig. 6b) and its shape evolves a lot with pressure. First asymmetrical, it becomes almost symmetrical at 200 bar. The peak height also increases with pressure but the intensity of the H2O peak remains much lower than those of CO2, being of about the same height as the one of CO2 at the lowest pressure (Fig. 6a and Fig. 6b). Walrafen et al. (1999) suggested that the evolutions of peak shape and position of water are due to the presence of monomers (~3657 cm-1) and dimers (3628-3638 cm-1) or even higher aggregates in the vapor phase. The evolution of the proportion of each species with pressure (actually density) make the peak shape to become more symmetrical and the peak position to shift toward lower wavenumber when monomers disappears with the pressure increase. Here, the increase of pressure by the addition of CO2 should dilute H2O in the vapor phase, which seems to be in contradiction with the formation of aggregates of water molecule. The increase of density affects intermolecular interactions, which might result in a similar evolution of the Raman spectra of gaseous H2O.
3.2.2 Raman data vs. molar fraction ratio in vapor at 100 °C
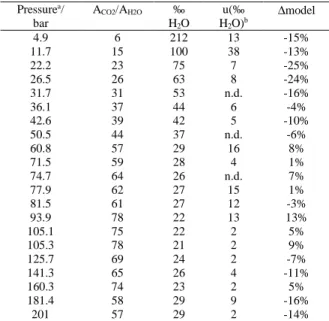
The ACO2/AH2O peak area ratios are plotted as a function of the yCO2/yH2O molar fraction ratio calculated using the EoS of Duan and Sun
8 (2003) (Fig. 7a and Table 2). The data are
more scattered than the ones obtained from the liquid phase (Fig. 3) because of the low signal-to-noise ratio (S/N) of the Raman signal of water and the difficulty to repeat acquisitions because of random liquid water condensation on the sapphire window. The whole set of data can be fitted by a straight line with a slope of 1.71 ± 0.05 (95%) (intercept fixed to zero) and with an adjusted R² of 0.98922. The mean resulting accuracy is of ~20% but with strong variations depending on the quality of the experimental data (signal intensity, number of values per step). The ICO2/IH2O peak intensity ratio is also plotted as a function of the yCO2/yH2O ratio (Fig. 7b). It increases up to ~ 130 bar (void circles in Fig. 7b) then, as pressure increases, the yCO2/yH2O ratio decreases and a hysteresis appears on Raman data (plain circles in Fig. 7b).
Fig. 7: (a): ACO2 / AH2O peak area ratio (arbitrary units) as a function of yCO2/yH2O molar fraction in vapor phase calculated using the thermodynamic model of Duan and Sun (2003) at 100 °C. Void circles: experimental data up to 125 bar; plain circles: experimental data above 125 bar; line: linear fit of the whole data set (R2= 0.98922); (b): I
CO2 / IH2O peak intensity ratio (arbitrary units) as a function of yCO2/yH2O molar fraction in vapor phase calculated using the thermodynamic model of Duan and Sun (2003). Void circles: experimental data up to 125 bar; plain circles: experimental data above 125 bar not considered for fit; line: second-order polynomial fit (R2 = 0.99387).
The ICO2/IH2O data recorded at pressure less than 130 bar can be fitted by a second-order polynomial curve. The change of shape of the Raman peak of water vapor occurs at constant area toward density (Walrafen et al., 1999) and so, the peak area ratio remains proportional to concentration (Equation 2), but the change of shape affects the peak intensity. As a result, the calibration curve calculated using the ICO2/IH2O peak intensity ratio is polynomial contrary to the curve calculated using the ACO2/AH2O peak area ratio
which remains linearly correlated to
concentration over the whole pressure range (Fig. 7a and Fig. 7b).
4 DISCUSSION
4.1 CO2 solubility in water
4.1.1 Solubility at 100 °C
Numerous CO2 data were published over the last hundred years. Relevant data were selected and reviewed by Diamond and Akinfiev (2003) and Spycher et al. (2003), excluding some data because of a significant deviation from other studies or obvious experimental problems. The experimental CO2 solubility data (mol.kg-1H2O) at 100 °C selected in the two above mentioned reviews (Bohr and Bock, 1891; Drummond, 1981; Malinin and Kurovskaya, 1975; Müller et al., 1988; Shagiakhmetov and Tarzimanov, 1981; Wiebe and Gaddy, 1939; Zawisza and Malesinska, 1981) and more recent works (Hou et al., 2013; Koschel et al., 2006; Langlais, 2013; Lucile et al., 2012; Sabirzyanov et al., 2003) are plotted in Fig. 4 as a function of pressure (bar) and compared to the present study and data calculated with the EoS of Duan and Sun (2003). The present data, based on Raman spectra and the EoS of Duan and Sun (2003) provide solubility data as accurate and sensitive as the one found in literature at 100 °C.
4.1.2 Solubility at 65 °C
The new experimental data at 65 °C are determined using the fit equation calculated from the well-constrained data at 100 °C (Fig. 3). They are compared in Fig. 5 to the EoS of
9 Duan and Sun (2003) and the only three data
points found in literature (Bermejo et al., 2005). A small defect as a line break is observed in the EoS at 117 bar, but not in the experimental data set. The agreement between our data at 65 °C and the thermodynamic model (Duan and Sun, 2003) is inside the model uncertainty range (7 %, see Table 1). The present Raman data are also in agreement with the data of Bermejo et al. (2005). Consequently the calibration determined at 100 °C can be used at any temperature between 65 °C and 100 °C at least, with an accuracy equivalent to the one of other
experimental methods and of the
thermodynamic model (7 %, Duan and Sun, 2003).
Fig. 8: yCO2 / yH2O molar fractions ratio in the H2O-CO2 system as a function of pressure (bar) at 100 °C. Void circles: experimental data from this study; triangles and diamonds: literature data (Coan and King, 1971; Hou et al., 2013; Müller et al., 1988; Tödheide and Frank, 1963); solid line: thermodynamic model of Duan and Sun (2003); dash line: thermodynamic model of Spycher et al. (2003).
4.2 The CO2-rich phase at 100 °C
4.2.1 Solubility of water in the CO2-rich
phase
Duan and Sun (2003) said that since there were no vapor composition measurements for the CO2-H2O-NaCl system in the range 273-533K, the model was built setting water vapor pressure to the one of pure water saturation pressure. However, as noted by Spycher et al. (2003), Chapoy et al. (2004), Marini (2006), and Ji et al. (2007), a few references can be found in the range of pressure and temperature of the present study (Coan and King, 1971; Müller et al., 1988; Tödheide and Frank,
1963). More recently, Hou et al. (2013) published molar fraction data in both the CO2 -rich and H2O-rich phase. The present data set, based on the EoS of Duan and Sun (2003), is compared to literature data in Fig. 8. The data of Müller et al. (1988), at pressure < 25 bar, are in agreement with both the models of Duan and Sun (2003) and Spycher et al. (see Fig. 7 in Spycher et al., 2003). The only data point from Tödheide and Franck (1963) at 200 bar fits with our data and nearly with the model of Duan and Sun (2003) but not with the model of Spycher et al. (2003). The data of Coan and King (1971) are in good agreement with the model of Spycher et al. (2003) but less with our data and the model of Duan and Sun (2003) (Fig. 8). Finally, the data of Hou et al. (2013) agree well with other data at low pressure but also deviate from the model of Duan and Sun (2003) above 70 bar. The authors recognized that it deviated from their own model at low temperature and high pressure (when the yCO2/yH2O ratio is the highest). Spycher et al. (2003) compared two versions of their model, with or without an
Pressurea/ bar ACO2/AH2O ‰ H2O u(‰ H2O)b ∆model 4.9 6 212 13 -15% 11.7 15 100 38 -13% 22.2 23 75 7 -25% 26.5 26 63 8 -24% 31.7 31 53 n.d. -16% 36.1 37 44 6 -4% 42.6 39 42 5 -10% 50.5 44 37 n.d. -6% 60.8 57 29 16 8% 71.5 59 28 4 1% 74.7 64 26 n.d. 7% 77.9 62 27 15 1% 81.5 61 27 12 -3% 93.9 78 22 13 13% 105.1 75 22 2 5% 105.3 78 21 2 9% 125.7 69 24 2 -7% 141.3 65 26 4 -11% 160.3 74 23 2 5% 181.4 58 29 9 -16% 201 57 29 2 -14%
Table 2: molar fraction of water in vapor phase yH2O (‰) calculated from the fit in Fig. 7a as a function of pressure (bar) at 100 °C and difference with the EOS of Duan and Sun (2003) (∆model / %). The values are the mean of 2 to 5 measurements at a given pressure.
assumption of ideal mixing in the CO2-rich phase. The authors concluded that the assumption of ideal mixing leads to large
10 discrepancies in view of their results.
However, the agreement of the EoS of Duan and Sun (2003) (with the assumption of ideal mixing in the CO2-rich phase) with some experimental data and the linear correlation found between the Raman peak area intensity ratio and the molar fraction ratio in vapor phase calculated with this model (Fig. 7 and Table 2) let us to think that the hypothesis about water saturation pressure might be not so bad in the range 0-200 bar at 100 °C. In any case, this hypothesis deserves confirmation by more reliable experimental data in the range of very low yH2O.
4.2.2 CO2-rich phase behavior
A change of slope sign occurs at ~130 bar in Fig.7a and Fig. 7b: the Raman ratio increases up to 130 bar and then decreases. Computed and experimental data of yH2O as a function of pressure at different temperature were presented in Marini (2006). A sharp discontinuity with slope inversion was observed at the gas-liquid transition pressure at sub-critical temperature (25 °C) (see Figure 3.8 in Marini, 2006). This discontinuity disappeared at supercritical temperature but the “memory” of the slope inversion remained up to 100 °C at a pressure increasing with temperature (around 100 bar at 75 °C and above 100 bar at 100 °C). The present results confirms this behavior and shows that more experimental data are required for the CO2 -rich phase in the supercritical domain at pressures between 75 and 200 bar and temperatures close to 100°C. The current models for the H2O-CO2 system in the CO2– rich phase may be quite divergent to each other or to available experimental data in some PT ranges (e.g. Spycher et al., 2003), even using similar hypothesis for molecular interactions in the basis of the model. More reliable experimental data would improve the adjustment of the EoS and thus the understanding of the mechanisms in this PT domain.
5 CONCLUSION
The experimental IMAGES device coupled with a Raman spectrometer and immersion probes makes possible to measure the mutual solubilities of H2O and CO2 at pressure up to 200 bar. The system is tested here at 65 °C and 100 °C but can operate up to 250 °C. Linear correlations are found between peak intensity ratios ICO2/IH2O and the CO2 solubility in liquid water. New data of CO2 solubility in water are provided at 65 °C with an accuracy of a few percent based on this linear correlation determined at 100 °C. This new data set is in agreement with the very few data available in literature and the EOS of Duan and Sun (2003). A linear calibration curve is also calculated to measure H2O molar fraction in the CO2-rich phase at 100 °C by measuring peak area ratios. Accuracy (~20%) is less good than in the liquid phase because of a lowest signal-to-noise ratio of the Raman signal of gaseous H2O and some difficulty to get pure vapor signal (without liquid water signal). It could be improved operating at higher temperature (to get more H2O in the vapor phase) or by increasing the global Raman signal intensity by using higher laser power or larger acquisition times. Finally these new data sets may improve the prediction of the thermodynamic behavior in the H2O-CO2 system especially in the vapor phase.
The device design (volume, connections, monitoring, material) could also operates under other conditions, including the presence of a massive solid to study water-rock interactions, or the addition of salt in water even at elevated temperature thanks to the Teflon bowl used to limit steel corrosion, or the injection of gas mixtures. However, the large volume (2 L) of the autoclave is a disadvantage for equilibration times and homogenization in the liquid phase in comparison with fused silica capillaries techniques (Caumon et al., 2014; Guo et al., 2014) or microfluidic systems (Liu et al., 2012). Finally, the addition of high-temperature-pressure pH probe (Bourdelle et al., 2014; Randi et al., 2014; Truche et al., in
11 press) or other chemical probes to the device
would be of great interest in numerous geochemistry domains.
Acknowledgments
Jérôme Corvisier is warmly thank for the exhaustive bibliographic review of CO2 solubility data in aqueous media and old unit conversions. This work was supported by the ANR grant (Geocarbone Injectivité ANR-05-CO2-007-05) and through the "Gaz Annexes" (ANR-06-CO2-005) and SIGARR (ANR-13-SEED-0006) projects.
References
Akinfiev, N.N., Diamond, L.W., 2010. Thermodynamic model of aqueous CO2–
H2O–NaCl solutions from −22 to 100 °C and
from 0.1 to 100 MPa. Fluid Phase Equilibria
295, 104–124.
doi:10.1016/j.fluid.2010.04.007
Azbej, T., Severs, M.J., Rusk, B.G., Bodnar, R.J., 2007. In situ quantitative analysis of individual H2
O-CO2 fluid inclusions by laser Raman
spectroscopy. Chemical Geology 237, 255– 263.
Bachu, S., 2000. Sequestration of CO2 in geological
media: criteria and approach for site selection in response to climate change. Energy Conversion and Management 41, 953–970. doi:10.1016/S0196-8904(99)00149-1
Belgodere, C., Dubessy, J., Vautrin, D., Caumon, M.-C., Sterpenich, J., Pironon, J., Robert, P., Randi, A., Birat, J.-P., 2015. Experimental determination of CO2 diffusion coefficient in
aqueous solutions under pressure at room temperature via Raman spectroscopy: impact of salinity (NaCl). Journal of Raman Spectroscopy 46, 1025–1032. doi:10.1002/jrs.4742
Bermejo, M.D., Martín, A., Florusse, L.J., Peters, C.J., Cocero, M.J., 2005. The influence of Na2SO4
on the CO2 solubility in water at high pressure.
Fluid Phase Equilibria 238, 220–228. doi:10.1016/j.fluid.2005.10.006
Biansan, J.-M., 2015. GUM_MC, http://jeanmarie.biansan.free.fr/gum_mc.html .
BIPM, 2008a. Evaluation of measurement data – Guide to the expression of uncertainty in measurement JCGM 100:2008.
BIPM, 2008b. Evaluation of measurement data – Supplement 1 to the “Guide to the expression of uncertainty in measurement” – Propagation of distributions using a Monte Carlo method JCGM 101:2008.
Bohr, C., Bock, J., 1891. Bestimmung der Absorption einiger Gase in Wasser bei den Temperaturen zwischen 0 und 100°. Ann. Phys. 280, 318– 343. doi:10.1002/andp.18912801010
Bourdelle, F., Truche, L., Pignatelli, I., Mosser-Ruck, R., Lorgeoux, C., Roszypal, C., Michau, N., 2014. Iron–clay interactions under hydrothermal conditions: Impact of specific surface area of metallic iron on reaction pathway. Chemical Geology 381, 194–205. doi:10.1016/j.chemgeo.2014.05.013
Caumon, M.-C., Robert, P., Laverret, E., Tarantola, A., Randi, A., Pironon, J., Dubessy, J., Girard, J.-P., 2014. Determination of methane content in NaCl–H2O fluid inclusions by Raman
spectroscopy. Calibration and application to the external part of the Central Alps (Switzerland). Chemical Geology 378-379, 52–61. doi:10.1016/j.chemgeo.2014.03.016 Chapoy, A., Mohammadi, A.H., Chareton, A., Tohidi,
B., Richon, D., 2004. Measurement and Modeling of Gas Solubility and Literature Review of the Properties for the Carbon Dioxide−Water System. Ind. Eng. Chem. Res. 43, 1794–1802. doi:10.1021/ie034232t Coan, C.R., King, A.D., 1971. Solubility of water in
compressed carbon dioxide, nitrous oxide, and ethane. Evidence for hydration of carbon dioxide and nitrous oxide in the gas phase. Journal of the American Chemical Society 93, 1857–1862.
Diamond, L.W., Akinfiev, N.N., 2003. Solubility of CO2 in water from -1.5 to 100 °C and from 0.1 to 100 MPa: evaluation of literature data and thermodynamic modelling. Fluid Phase Equilibria 208, 265–290.
Drummond, S.E., 1981. Boiling and mixing of hydrothermal fluids: chemical effects on mineral precipitation. Pennsylvania State University.
Duan, Z., Sun, R., 2003. An improved model calculating CO2 solubility in pure water and
aqueous NaCl solutions from 273 to 533 K and from 0 to 2000 bar. Chemical Geology 193, 257–271.
Dubessy, J., Poty, B., Ramboz, C., 1989. Advances in C-O-H-N-S fluid geochemistry based on micro-Raman spectrometric analysis of fluid inclusions. European Journal of Mineralogy 1, 517–534.
Dubessy, J., Tarantola, A., Sterpenich, J., 2005. Modelling of liquid-vapour equilibria in the H2O-CO2-NaCl and H2O-H2S-NaCl systems
to 270°C. Oil and Gas Science and Technology 60, 339–355.
Enick, R.M., Klara, S.M., 1990. CO2 solubility in water
and brine under reservoir conditions. Chemical Engineering Communications 90, 23–33.
12 Frezzotti, M.L., Tecce, F., Casagli, A., 2011. Raman
spectroscopy for fluid inclusion analysis. Journal of Geochemical Exploration 112, 1– 20.
Guo, H., Chen, Y., Hu, Q., Lu, W., Ou, W., Geng, L., 2014. Quantitative Raman spectroscopic investigation of geo-fluids high-pressure phase equilibria: Part I. Accurate calibration and determination of CO2 solubility in water
from 273.15 to 573.15 K and from 10 to 120 MPa. Fluid Phase Equilibria 382, 70–79. doi:10.1016/j.fluid.2014.08.032
Hannon, M.J., Boerio, F.J., Koenig, J.L., 1969. Vibrational analysis of polytetrafluoroethylene. The Journal of Chemical Physics 50, 2829–2836.
Hou, S.-X., Maitland, G.C., Trusler, J.P.M., 2013. Measurement and modeling of the phase behavior of the (carbon dioxide+water) mixture at temperatures from 298.15K to 448.15K. The Journal of Supercritical Fluids 73, 87–96. doi:10.1016/j.supflu.2012.11.011 Ji, Y., Xiaoyan Ji, Xin Feng, Chang Liu, Linghong Lü,
Xiaohua Lu, 2007. Progress in the Study on the Phase Equilibria of the CO2-H2O and CO2
-H2O-NaCl Systems. Chin. J. Chem. Eng. 15,
439–448.
Koschel, D., Coxam, J.-Y., Rodier, L., Majer, V., 2006. Enthalpy and solubility data of CO2 in water
and NaCl(aq) at conditions of interest for geological sequestration. Fluid Phase Equilibria 247, 107–120.
Langlais, C., 2013. Impacts géochimiques de la présence d’oxygène sur les saumures en conditions de stockage géologique de CO2 :
caractérisation de solubilités. Pau.
Li, H., Jakobsen, J.P., Wilhelmsen, Ã., Yan, J., 2011. PVTxy properties of CO2 mixtures relevant
for CO2 capture, transport and storage:
Review of available experimental data and theoretical models. Applied Energy 88, 3567– 3579.
Liu, N., Aymonier, C., Lecoutre, C., Garrabos, Y., Marre, S., 2012. Microfluidic approach for studying CO2 solubility in water and brine
using confocal Raman spectroscopy. Chemical Physics Letters 551, 139–143. Long, D.A., 1977. Raman spectroscopy. McGraw-Hill,
New-York.
Lucile, F., Cézac, P., Contamine, F., Serin, J.-P., Houssin, D., Arpentinier, P., 2012. Solubility of Carbon Dioxide in Water and Aqueous Solution Containing Sodium Hydroxide at Temperatures from (293.15 to 393.15) K and Pressure up to 5 MPa: Experimental Measurements. Journal of Chemical & Engineering Data 57, 784–789.
Lu, W., Chou, I., Burruss, R., 2007. Temperature effect on the quantitative analysis of CO2
concentration in water by in situ laser Raman spectroscopy, in: Water-Rock Interaction. Taylor & Francis.
Malinin, S.D., Kurovskaya, N.A., 1975. Solubility of CO2 in chloride solutions at elevated
temperatures and CO2 pressures. Geochem. Int 12, 199–201.
Marini, L., 2006. Carbon dioxide and CO2- H2O
mixtures, in: Geological Sequestration of Carbon Dioxide Thermodynamics, Kinetics, and Reaction Path Modeling, Developments in Geochemistry. Elsevier, pp. 27–51. Müller, G., Bender, E., Maurer, G., 1988. Das
Dampf-Flüssigkeitsgleichgewicht des Ternären Systems Ammoniak-Kohlendioxid-Wasser bei Hohen Wassergehalten im Bereich Zwischen 373 und 473 Kelvin. Berichte der Bunsen-Gesellshaft für Physikalische Chemie 92, 148–160.
Randi, A., Sterpenich, J., Morlot, C., Pironon, J., Kervévan, C., Beddelem, M.-H., Fléhoc, C., 2014. CO2-DISSOLVED: a Novel Concept Coupling Geological Storage of Dissolved CO2 and Geothermal Heat Recovery – Part 3:
Design of the MIRAGES-2 Experimental Device Dedicated to the Study of the Geochemical Water-Rock Interactions Triggered by CO2 Laden Brine Injection.
Energy Procedia, 12th International Conference on Greenhouse Gas Control Technologies, GHGT-12 63, 4536–4547. doi:10.1016/j.egypro.2014.11.487
Sabirzyanov, A.N., Shagiakhmetov, R.A., Gabitov, F.R., Tarzimanov, A.A., Gumerov, F.M., 2003. Water Solubility of Carbon Dioxide under Supercritical and Subcritical Conditions. Theoretical Foundations of Chemical Engineering 37, 51–53. doi:10.1023/A:1022256927236
Schrötter, H.W., Klöckner, H.W., 1979. Raman Scattering Cross Sections in Gases and Liquids, in: Weber, A. (Ed.), Raman Spectroscopy of Gases and Liquids, Topics in Current Physics. Springer Berlin Heidelberg, Berlin, pp. 123–166.
Shagiakhmetov, R.A., Tarzimanov, A.A., 1981. Measurements of CO2 solubility in water up to
60 MPa. Deposited Document SPSTL 200khp-D81-1982.
Søreide, I., Whitson, C.H., 1992. Peng-Robinson predictions for hydrocarbons, CO2, N2, and
H2S with pure water and NaCl brine. Fluid
Phase Equilibria 77, 217–240. doi:10.1016/0378-3812(92)85105-H
Spycher, N., Pruess, K., Ennis-King, J., 2003. CO2-H2O
mixtures in the geological sequestration of CO2. I. Assessment and calculation of mutual
13 bar. Geochimica et Cosmochimica Acta 67,
3015–3031.
Sterpenich, J., Sausse, J., Pironon, J., Géhin, A., Hubert, G., Perfetti, E., Grgic, D., 2009. Experimental ageing of oolitic limestones under CO2 storage conditions: Petrographical
and chemical evidence. Chemical Geology 265, 99–112.
Tödheide, K., Frank, E.U., 1963. Das Zweiphasengebiet und die Kritische Kurve im System Kohlendioxid-Wasser bis zu Drucken von 3500 bar. Zeitschrift fuer Physikalische Chemie Neue Folge. 37, 387–401.
Truche, L., Bazarkina, E.F., Berger, G., Caumon, M.-C., Dubessy, J., Bessaque, G., in press. Direct measurement of CO2 solubility and pH in
NaCl hydrothermal solutions by combining in situ potentiometry and Raman spectroscopy up to 280 °C and 150 bar. Geochimica et Cosmochimica Acta.
Walrafen, G.E., Blatz, L.A., 1973. Weak Raman bands from water. Journal of Chemical Physics 59, 2646–2650.
Walrafen, G.E., Yang, W.H., Chu, Y.C., 1999. Raman spectra from saturated water vapor to the supercritical fluid. Journal of Physical Chemistry B 103, 1332–1338.
Wang, Z., Small, M.J., Karamalidis, A.K., 2013. Multimodel Predictive System for Carbon Dioxide Solubility in Saline Formation Waters. Environmental Science & Technology 47, 1407–1415.
White, S., 2010. Qualitative and quantitative analysis of CO2 and CH4 dissolved in water and
seawater using laser Raman spectroscopy. Applied Spectroscopy 64, 819–827.
Wiebe, R., Gaddy, V.L., 1939. The Solubility in Water of Carbon Dioxide at 50, 75 and 100°C, at Pressures to 700 Atmospheres. Journal of the American Chemical Society 61, 315–318. Wopenka, B., Pasteris, J.D., 1987. Raman intensities
and detection limits of geochemically relevant gas mixtures for a laser Raman microprobe. Analytical Chemistry 59, 2165–2170. Wopenka, B., Pasteris, J.D., 1986. Limitations to
quantitative analysis of fluid inclusions in geological samples by laser Raman microprobe spectroscopy. Applied spectroscopy 40, 144–151.
Zawisza, A., Malesinska, B., 1981. Solubility of carbon dioxide in liquid water and of water in gaseous carbon dioxide in the range 0.2-5 MPa and at temperatures up to 473 K. J. Chem. Eng. Data 26, 388–391. doi:10.1021/je00026a012