HAL Id: hal-00330330
https://hal.archives-ouvertes.fr/hal-00330330
Submitted on 26 Oct 2007
HAL is a multi-disciplinary open access
archive for the deposit and dissemination of
sci-entific research documents, whether they are
pub-lished or not. The documents may come from
teaching and research institutions in France or
abroad, or from public or private research centers.
L’archive ouverte pluridisciplinaire HAL, est
destinée au dépôt et à la diffusion de documents
scientifiques de niveau recherche, publiés ou non,
émanant des établissements d’enseignement et de
recherche français ou étrangers, des laboratoires
publics ou privés.
waters: attenuation and reflectance within the visible
and near-UV spectral domains, as observed in South
Pacific and Mediterranean waters
A. Morel, Hervé Claustre, David Antoine, B. Gentili
To cite this version:
A. Morel, Hervé Claustre, David Antoine, B. Gentili. Natural variability of bio-optical properties
in Case 1 waters: attenuation and reflectance within the visible and near-UV spectral domains, as
observed in South Pacific and Mediterranean waters. Biogeosciences, European Geosciences Union,
2007, 4 (5), pp.913-925. �hal-00330330�
www.biogeosciences.net/4/913/2007/ © Author(s) 2007. This work is licensed under a Creative Commons License.
Biogeosciences
Natural variability of bio-optical properties in Case 1 waters:
attenuation and reflectance within the visible and near-UV
spectral domains, as observed in South Pacific and
Mediterranean waters
A. Morel, H. Claustre, D. Antoine, and B. Gentili
Laboratoire d’Oc´eanographie de Villefranche, Universit´e Pierre et Marie Curie (Paris 6) and CNRS/INSU, 06238 Villefranche-sur-mer, CEDEX, France
Received: 18 June 2007 – Published in Biogeosciences Discuss.: 3 July 2007
Revised: 12 October 2007 – Accepted: 14 October 2007 – Published: 26 October 2007
Abstract. The optical properties of Case 1 waters have been empirically related to the chlorophyll concentration, [Chl], historically used as an index of the trophic state and of the abundance of the biological materials. The well-known nat-ural variability around the mean statistical relationships is here examined by comparing the apparent optical properties (spectral downward irradiance attenuation and reflectance) as a function of [Chl] in two Case 1 environments, the Pacific and Mediterranean waters. These oceanic zones apparently represent two extremes of the possible bio-optical variability range around the mean. The systematic deviations, in both directions with respect to the average laws, mainly result from the differing contents in non-algal detrital materials and dissolved colored substance for a given [Chl] level. These contents are higher than the average in the Mediterranean Sea, and lower in the Pacific Ocean, respectively. These di-vergences between the two water bodies, detectable in the visible spectral domain, are considerably accentuated in the UV domain. The bio-optical properties in this spectral do-main (310–400 nm) are systematically explored. They are more varying for a given [Chl] than those in the visible do-main. Their prediction based on the sole [Chl] index is thus problematic, although it is probably possible on a regional scale if reliable field data are available. It does not seem, however, that ubiquitous relationships exist for this spectral domain for all Case 1 waters at global scale.
Correspondence to: A. Morel
1 Introduction
According to the common use, Case 1 waters are those for which phytoplankton with their accompanying retinue of dis-solved and particulate materials of biological origin govern the bulk optical properties. This statement also means that the terrigeneous influence (through dissolved or suspended material originating from land) is reduced to its minimum, and actually is supposed to be negligible. Such a defini-tion, based on a biogeochemical criterion, has bio-optical consequences. The apparent and inherent optical properties (AOP, and IOP, sensu (Preisendorfer, 1961)) of Case 1 waters have been analyzed and it was possible to empirically relate these properties to the chlorophyll concentration (thereafter denoted [Chl]). This concentration, which is routinely, or at least, very often determined at sea, was historically and is still used as a proxy of the whole (algal and non-algal) bio-logical material, or a convenient descriptor of trophic condi-tions. The choice of this single index was made for obvious practical and methodological reasons. Not less obviously, the inability of such a single parameter to fully describe the whole biological compartment, as soon as there are no strict co-variations between its various components, entails that variability for all Case 1 waters is to be expected. Actu-ally, the dispersion of data (IOP and AOP) around the empir-ical mean laws mentioned above attested that this variability is considerable (e.g., Gordon and Morel, 1983a; Bricaud et al., 1995; Bricaud et al., 1998; Loisel and Morel, 1998). A hint to the possibility of systematic geographical deviations was dropped by Morel and Maritorena (2001); they com-pared a restricted number of data from the Mediterranean Sea and from Central South Pacific for the spectral range 400– 350 nm. More numerous data, extended down to 310 nm, are now available to examine these differences in detail.
During the BIOSOPE cruise (Claustre et al., 20071) spec-tral measurements of the downward and upward planar ir-radiances, Ed(λ) and Eu(λ), respectively, were performed
along a ∼8000 km-long transect, from Marquesas islands to the Chilean coast off Concepci´on. The apparent optical prop-erties, in particular the spectral diffuse attenuation coeffi-cient, Kd(λ), for downward irradiance, and the irradiance
reflectance, R(λ), were derived from the spectroradiometric determinations of Ed(λ) and Eu(λ), which were made at
dis-crete depths within the water column.
A first study (Morel et al., 2007a) of this dataset was specifically devoted to the exceptional optical properties ob-served in the center of the South Pacific Gyre, near Easter Island. In this zone we encountered the most oligotrophic waters along the transect, and probably in the whole ocean (satellite Ocean Color imagery has steadily confirmed the extremely low [Chl] values in this zone – see e.g., Fougni´e (2002), Claustre et al. (20071). The exceptional clarity of these waters was in itself a worthwhile topic. This clarity has also allowed an upper limit for the absorption by pure sea-water in the UV domain to be inferred. It is worth recalling that the knowledge of this absorption coefficient was highly uncertain, because the scarce published values for the UV domain were questionable and contradictory.
The present paper extends the previous study to the en-tire South Pacific zone along the transect. Beside the hyper-oligotrophic regime of the central part of the gyre, it also includes the examination of the mesotrophic waters (near Marquesas Islands), the eutrophic waters (Chilean upwelling area), and the transition zones. Along the whole transect, [Chl] in the upper layer ranged from 0.02 to about 2 mg m−3. The present study also takes advantage of the improved knowledge of the water absorption properties in the UV (namely the 310–400 nm domain) as mentioned above. It thus becomes possible to analyze the optical properties in this spectral domain as a function of the chlorophyll concen-tration. Such an analysis builds upon a previous study (Morel and Maritorena, 2001), which yet did not examine the 310– 350 nm domain, and was only tentative in its conclusions re-garding the 350–400 nm domain. This limitation was essen-tially due to an insufficient amount of field data (and of the lack of reliable values for pure water absorption).
This situation has considerably improved, as the recent
Ed(λ) and Eu(λ) spectral determinations have been
system-atically extended down to 310 nm. Furthermore, a substantial amount of data for the South Pacific Ocean is now available by pooling together the recent data of the BIOSOPE (2004) cruise with those of the previous (1994) OLIPAC cruise (a S-N transect from Tahiti to 1◦N,). In addition, the same methodology was employed in other cruises in the
Mediter-1Claustre, H., Sciandra, A., and Vaulot, D.: Introduction to the
special section: Bio-optical and biogeochemical conditions in the South East Pacific in late 2004, the BIOSOPE program, Biogeo-sciences Discuss., in preparation, 2007.
ranean Sea (PROSOPE and AOPEX, see Table 1), as well as in South , Atlantic (BENCAL cruise). The data of the lat-ter cruise in the eutrophic walat-ters of the Benguela current are used for the sake of completion, as they represent a useful end member in terms of [Chl] in Case 1 waters (values up to 30 mg m−3; Morel et al., 2006). Therefore, it is presently possible to compare the various oceanic zones (all in Case 1 waters) and to initiate a study of the natural variability of the bio-optical properties in such waters.
1.1 Specific motivations and goals
For many years the Kd(λ) coefficients have been empirically
studied along with [Chl] (Baker and Smith, 1982; Austin and Petzold, 1981). Actually, the results of these researches were the basis for the development of [Chl]-dependent bio-optical models for Case 1 waters (Gordon and Morel, 1983a; Gordon et al., 1988; Morel, 1988), and of algorithms aim-ing at assessaim-ing [Chl] from the signals recorded by ocean color sensors; more generally, the prediction of the radiation transport within such waters makes use of these results as inputs for a numerical solution of the radiative transfer equa-tion (Morel and Gentili, 2004). The first motivaequa-tion of the present study is to examine whether the South Pacific waters follow the general trends already observed elsewhere in the global ocean, or in other specific areas (Mediterranean Sea), particularly with regards to the Kd(λ)↔[Chl] relationships.
The dependency in shape and magnitude of R(λ), upon [Chl] is also to be examined. The complementary objective is to try to explain the departures, if any, from the general trends.
The second aim is to extend the previous studies into the short wavelength region, which is by far less documented with regards to the possible existence of relationships be-tween either Kd(λ) or R(λ), and [Chl]. The respective
in-fluences of the algal populations with their retinue (including organic and inorganic debris, also heterotrophic organisms) and of the colored dissolved material in the UV domain, are still unclear and not quantified.
1.2 Methodology and theoretical background
The Eu(λ, z) and Ed (λ, z) spectral irradiances were
deter-mined at discrete depths (z) by using a calibrated LICOR spectroradiometer (LI-1800 UW) equipped with a cosine col-lector. The incident radiation on the deck was monitored by using a gimbaled PAR cosine sensor (PNF Biospherical in-strument). A detailed description of the equipment, protocols and data processing was provided in recent papers (Morel et al., 2006 and 2007a) and is not repeated. The chloro-phyll concentration ([Chl], as mg m−3), was determined for
all cruises via High-Performance Liquid Chromatography (HPLC) (Ras et al., 2007). The notation Chl actually rep-resents the sum of the following pigments: chlorophyll-a + divinyl chlorophyll-a + chlorophyllid-a + chlorophyll-a al-lomers and epimers (often referred to as “TChl-a”).
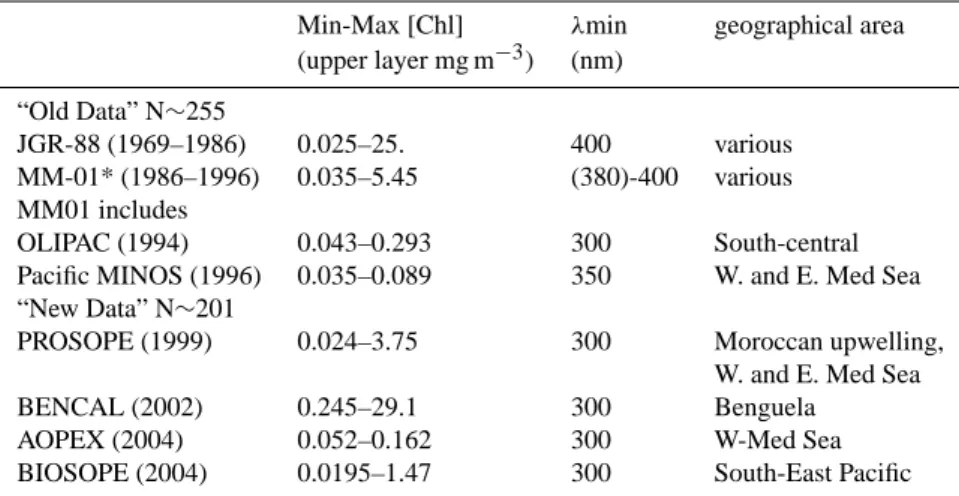
Table 1. Relevant information regarding the cruises,their geographical areas, and data, used in the present study. The minimal and maximal [Chl] values measured within the upper layer, and the minimal wavelength for the spectral irradiance measurements, are provided for each cruise.
Min-Max [Chl] λmin geographical area
(upper layer mg m−3) (nm) “Old Data” N∼255 JGR-88 (1969–1986) 0.025–25. 400 various MM-01* (1986–1996) 0.035–5.45 (380)-400 various MM01 includes OLIPAC (1994) 0.043–0.293 300 South-central
Pacific MINOS (1996) 0.035–0.089 350 W. and E. Med Sea
“New Data” N∼201
PROSOPE (1999) 0.024–3.75 300 Moroccan upwelling,
W. and E. Med Sea
BENCAL (2002) 0.245–29.1 300 Benguela
AOPEX (2004) 0.052–0.162 300 W-Med Sea
BIOSOPE (2004) 0.0195–1.47 300 South-East Pacific
Acronyms : OLIgotrophy in PACific (OLIPAC); Mediterranean InvestigatioN of Oligotrophic Systems (MINOS); PROductivity of Oceanic PElagic systems (PROSOPE); BIogeochemistry and Optics South Pacific Experiment (BIOSOPE); Ocean Color Cal/Val in the Benguela upwelling ecosystem (BENCAL); Apparent Optical Properties Experiment (AOPEX).
Information and data available on www.obs-vlfr/proof/index-vt.htm for OLIPAC, PROSOPE, and BIOSOPE cruises onwww.Ifremer.fr/ sismer for MINOS and AOPEX.
BENCAL Cruise Report, NASA Technical Memorandum 2003-206892, Vol. 27.
A minimal set of definitions is provided below. The spec-tral attenuation coefficient for downward irradiance, Kd(λ),
is computed (from null depth, denoted 0−, to a depth z) as
Kd(λ) = (1/z) ln[Ed(λ, 0−)/Ed(λ, z)] (1)
actually Ed(λ, 0−), just beneath the surface, is not
mea-sured but derived from the measurement above the surface,
Ed(λ, 0+), (notation 0+), by applying a spectrally neutral
coefficient (0.97) that accounts for the transmission across the air-sea interface. Here the examination is restricted to the upper layer, and z is about or slightly larger than 1/Kd(PAR),
where PAR represents the polychromatic (400 to 700 nm) photosynthetically available radiation (as used in algal phys-iology and photosynthesis studies).
The sub-surface irradiance reflectance at a depth z,
R(λ, z), is defined as
R(λ, z) = Eu(λ, z)/Ed(λ, z) (2)
The Ed and Eu determinations are separated in time by
a few minutes, and both quantities are normalized to a con-stant incident PAR irradiance at the surface (thanks to the deck reference). The depth, z, is as shallow as possible, and was the minimal depth (about 1 to 2 m) where the Eu(λ, z)
determination was possible, given the waves and ship’s roll. The downward spectral irradiance at the depth z, Ed(λ, z), is
computed by extrapolating Ed(λ, 0−) from 0−to z, by using
the appropriate Kd(λ) coefficients.
Based on the spectral Ed(λ, z) determinations, PAR(z) at
any depth z is obtained by integrating the Ed(λ, z) spectrum
over the 400–700 nm range, according to its definition (Tyler, 1966). By convention, the bottom of the euphotic layer, de-noted Zeu, is commonly and (somewhat arbitrarily defined)
as that depth where the downward PAR irradiance falls to 1% of its sub-surface value (Ryther, 1956; see also discus-sion about its significance in Banse, 2006). This 1% level can be determined from the PAR vertical profiles. For some stations and because of technical limitations (actually when
Zeu was >135 m), Zeu was determined by using the PNF
profiler instrument lowered beyond 135 m. Beside of being crucial information in primary production studies (both for experimental and modeling approaches), Zeuis also a useful
index to globally describe the bio-optical state of the entire upper water column; as 99% of the solar visible radiation is absorbed within the 0-Zeulayer, the knowledge of Zeuis
important to predict the solar heat deposition with its conse-quences on the upper ocean dynamics (Morel et al., 2007b).
2 Results
As said earlier, the data used for the present study are not restricted to the BIOSOPE cruise. All the data used in the present study have been collected with the same instru-ments and optical and chemical protocols during several re-cent oceanographic campaigns, as summarized in Table 1. The OLIPAC and BIOSOPE data, both for the South-Eastern Pacific, will be merged. Regarding the Mediterranean Sea, the data from the MINOS, PROSOPE, and AOPEX cruises
Kd [m −1 ] 0.01 0.1 1 10 100 0 .0 1 0 .1 1 410 nm fit : N = 429 r2 = 0.909 MM01 Chl [mg m−3] Kd [m −1 ] 0.01 0.1 1 10 100 0 .0 1 0 .1 1 440 nm fit : N = 433 r2 = 0.935 MM01 0.01 0.1 1 10 100 0 .0 1 0 .1 1 490 nm fit : N = 431 r2 = 0.921 MM01 Chl [mg m−3] 0.01 0.1 1 10 100 0 .0 1 0 .1 1 510 nm fit : N = 424 r2 = 0.885 MM01
Figure 1
Fig. 1. Plot of the Kdvalues for the upper layer as a function of [Chl], and for selected wavelengths, as indicated. The red symbols are for
the Mediterranean Sea, and the blue symbols for the South Pacific data. The continuous black curve represents the best fit (Eq. 5) for all field
data (number of data and r2provided in insert); the Kwconstant introduced into Eq. (5) is shown as red arrows. The dashed black curve
represents the previous (2001) best fit with the χ and e values which were proposed in MM-01.
will also be pooled together. The data of BENCAL, the only cruise in eutrophic Case 1 waters, will be considered to en-compass the whole range of [Chl] values. Finally, “old data”, already presented and analyzed in previous studies (Morel, 1988; Morel and Maritorena, 2001, hereafter denoted JGR-88, and MM-01), will be displayed when necessary, espe-cially for the sake of comparison with the “new data”.
2.1 The diffuse attenuation coefficient Kd(λ) and its
varia-tion with [Chl] in the visible domain
The Kd(λ)-[Chl] relationships are displayed in Fig. 1 for
some selected wavelengths in the visible part of the spec-trum, together with a curve representing the best fit for all data (i.e., “old + new” data). For this statistical analysis, the quantity Kbio(λ) is formed as the difference (JGR88)
Kbio(λ) = Kd(λ) − Kw(λ), (3)
where Kw(λ), which represents the contribution by
hypothet-ically pure seawater, is computed (Smith, 1981) as the sum of
the absorption coefficient and the backscattering coefficient for pure seawater (half the scattering coefficient), namely
Kw(λ) = aw(λ) +
1
2bsw(λ), (4)
Then a linear regression analysis is performed on the log-transforms of the Kbio(λ) and [Chl] values for the upper
layer, and leads for each wavelength to expressions of the form
K(λ) = Kw(λ) + χ (λ)[Chl]e(λ), (5)
where the coefficient χ (λ) represents the Kbio spectrum
when [Chl] is 1 mg m−3, and the exponent e(λ), which is al-ways below 1, quantifies the non-linear dependency of Kbio
upon [Chl].
The BIOSOPE and OLIPAC data (blue symbols, Fig. 1) are very similar over their common [Chl] range (0.02– 0.3 mg m−3). These Pacific waters follow the general trend (black curves) for Case 1 waters. Without being exceptional when considering the overall dispersion, their Kd values lie
rather systematically below the curve representing the best fit for all data. In addition, this departure from the mean toward lower values is progressively more accentuated for
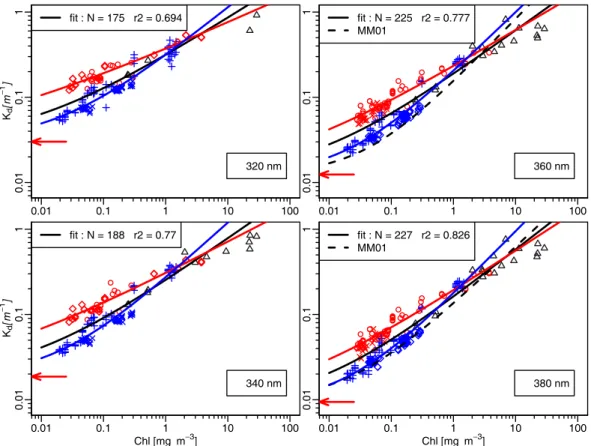
Kd [m −1 ] 0.01 0.1 1 10 100 0 .0 1 0 .1 1 320 nm fit : N = 175 r2 = 0.694 Chl [mg m−3] Kd [m −1 ] 0.01 0.1 1 10 100 0 .0 1 0 .1 1 340 nm fit : N = 188 r2 = 0.77 0.01 0.1 1 10 100 0 .0 1 0 .1 1 360 nm fit : N = 225 r2 = 0.777 MM01 Chl [mg m−3] 0.01 0.1 1 10 100 0 .0 1 0 .1 1 380 nm fit : N = 227 r2 = 0.826 MM01
Figure 2
Fig. 2. As in Fig. 1, but for wavelengths in the UV part of the spectrum, as indicated. The meaning of the continuous and dashed black curves is as in Fig. 1; Note that there was no χ and e values below 350 nm in MM-01, therefore no dashed black curve in the panels for 320 and 340 nm. The increased number of data between 340 and 360 nm results from the inclusion of the data from the MINOS cruise in Mediterranean Sea (see Table 1). The blue and red curves represent the separate best fits for the Pacific and Mediterranean data, respectively. decreasing wavelength (from 510 to 410 nm). In contrast,
the Mediterranean Kd values (red symbols), are recurrently
above the curve. This opposite distribution of the data from the two oceanic regions explains why, when all data are merged, the best fits and associated parameters, χ (λ) and
e(λ), remain practically unchanged with respect to those
pre-viously presented in the MM-01 study (that already included the OLIPAC data). Separate regressions performed on the Pacific and Mediterranean datasets result in best fit parame-ters that differ significantly (see below Sect. 3).
2.2 The diffuse attenuation coefficient Kd(λ) and its
varia-tion with [Chl] in the UV domain
The same analysis as above can be performed within the UV domain by using the revised values of the absorption coefficient by pure seawater recently proposed in Morel et al. (2007a), namely their aw1(λ) values. In MM01 such an
analysis was attempted for the range 350–400 nm, yet the
aw(λ) values used in Eq. (4) were uncertain, and the
num-ber of data somewhat insufficient. The backscattering coef-ficients (Eq. 4) for pure seawater, bsw(λ), are derived from
Buiteveld (1994) values, and multiplied by 1.30 to account for the effect of salinity (Morel, 1974).
The oligotrophic and mesotrophic waters of the Pacific and Mediterranean behave differently (examples in Fig. 2). For all wavelengths, the Pacific waters are systematically characterized by lower Kd (UV) values, compared to those
of Mediterranean waters. This behavior, which was al-ready noted for the shortest wavelengths of the visible spec-trum (Fig. 1a), is increasingly confirmed toward the short-est wavelengths in the UV domain. In contrast, there is no longer systematic differences when [Chl] is close to or above 1 mg m−3, i.e., between the Kd values in the Chilean and
Moroccan upwelling zones. Interestingly, these values are in continuity with those determined in the Benguela Current, with much higher [Chl] values.
2.3 Separate regression analyses for Pacific and Mediter-ranea waters
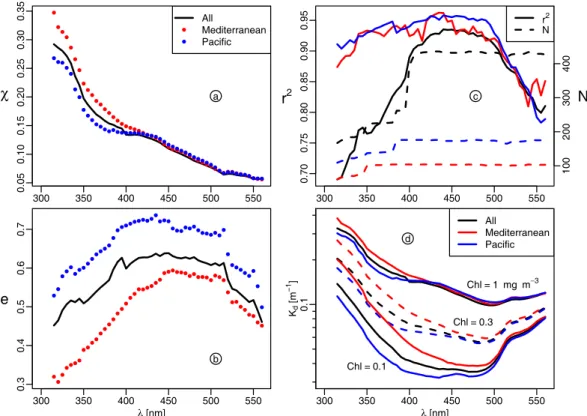
To account for the distinct behaviors of the two water bodies, separate regression analyses are appropriate. They were car-ried out systematically for all wavelengths from 560 down to 310 nm (increment 5 nm).The two resulting sets of val-ues are graphically compared in Fig. 3a and b, and the re-gression coefficients in Fig. 3c. The χ and e values dif-fer significantly and increasingly in the UV domain. It is
300 350 400 450 500 550 0 .0 5 0 .1 0 0 .1 5 0 .2 0 0 .2 5 0 .3 0 0 .3 5 χ All Mediterranean Pacific a 300 350 400 450 500 550 0 .3 0 .4 0 .5 0 .6 0 .7 λ [nm] e b 300 350 400 450 500 550 0 .7 0 0 .7 5 0 .8 0 0 .8 5 0 .9 0 0 .9 5 r2 1 0 0 2 0 0 3 0 0 4 0 0 N r2 N c λ [nm] Kd [ m − 1] 300 350 400 450 500 550 0 .1 Chl = 1 mg m−3 Chl = 0.3 Chl = 0.1 All Mediterranean Pacific d
Fig. 3. The χ (λ) (a) and e(λ) (b) values corresponding to the best fits (Eq. 5), separately computed for the Pacific (blue) and Mediterranean
waters (red); the corresponding coefficient of determination and number of data (r2and N ) are spectrally displayed in (c). In (d), examples
of Kd(λ) values computed with the previously shown χ (λ) and e(λ) values and for 3 [Chl] values as indicated. In the four panels the black
curves show the same quantities when the two datasets are merged. worth noting that the respective coefficients of determina-tion are high (Fig. 3c) even inside the UV domain. As a consequence, when all data are pooled together, the global correlation logically degrades, particularly in the UV do-main. The specific values for the two oceanic provinces are also compared to the adopted χ and e values (limited to 350 nm) resulting from a general merging of all data avail-able (ftp://oceane.obs-vlfr.fr/pub/morel/2006-e-chi).
Regarding the χ (λ) parameter (Fig. 3a), the values for the two water bodies are not significantly differing within the 420–560 nm domain. Below 420 nm, the Mediterranean val-ues are ostensibly above the Pacific valval-ues (and above the av-erage values, admittedly more influenced by the latter, with about 115 data versus 62 for the former). The spectral shape of the χ (λ) coefficient in the UV domain is characterized for both oceanic areas by a strong increase, with almost a dou-bling from 410 to 315 nm, and by the presence of a shoulder inside the 330–315 nm region.
Regarding the e(λ) exponent (Fig. 3b), large deviations occur between the two sets, with higher values for Pacific waters, and lower ones for the Mediterranean waters. The departure from linearity between Kd and [Chl] is expressed
by the e(λ) values (always <1); this departure is thus no-tably larger in the Mediterranean waters within the entire (310–560 nm) spectrum, and especially below 450 nm. Such
a weakening in the dependency upon [Chl] (even with high and significant r2values, cf. Fig. 3c) suggests the existence of an optically influential background which would be uncor-related with the contemporaneous algal stock. On the con-trary, the existence of larger e(λ) values for Pacific waters globally shows that the dependence upon [Chl] is maintained at a higher degree (lesser non-linearity), which would mean that the interfering effect of a [Chl]- independent background is less marked.
More generally, it is interesting to note the decrease of the e(λ) values in the UV compared with those in the vis-ible domain. With various extents this remark holds true in both cases (Mediterranean and Pacific). Accordingly, the UV absorbing material (the dissolved colored organic material, CDOM, and likely some colloidal and particulate material) generally appears to be rather loosely related to the local al-gal biomass, in contrast to the material responsible for ab-sorption within the visible part of the spectrum, which def-initely seems more closely associated with the algae them-selves. Therefore, the generic concept of Case 1 waters tends to weaken, or more precisely, to take a more regional sense, as far as the UV domain is concerned.
Chlsurf Chltot Ze u [ m] 0.01 0.1 1 10 100 1 0 1 0 0 Chltot [mg m−2] Chlsurf [mg m−3]
Fig. 4. Left hand side: Zeuas a function of [Chl]surf, as mg m−3,
or, right hand side, as a function of [Chl]tot, as mg m−2, for the
Pacific (blue) and Mediterranean waters (red). The curve for the
Zeu-[Chl]surfrelationship is a modeled one for a sun-zenith angle
equal to 30◦, and is reproduced from Morel and Gentili, 2004 (their
Fig. 1 and Table 1); .the curve for the Zeu-[Chl]totrelationship is
reproduced from MM01 (their Fig. 6). The green symbols are for the eutrophic waters of the Benguela Current (Morel et al., 2006) shown for completion.
2.4 Global visible (PAR) radiation and euphotic depth Empirical relationships between Zeuand the average
chloro-phyll concentration within the upper layer [Chl]surf, or
be-tween Zeuand the column integrated concentration, [Chl]tot
(as mg m−2) have previously been derived for Case 1 waters
(JGR88, MM-01). In addition, hyperspectral computations of the radiative transfer were performed (Morel and Gen-tili, 2004), using the appropriate relationships between the inherent optical properties and [Chl], and also by account-ing for the vertical phytoplankton profiles (as statistically es-tablished as a function of [Chl]surf; see Morel and Berthon,
1989 and also Uitz et al., 2006). This sun angle dependent modeling has explained and validated the mean empirical re-lationships derived from simultaneous determinations of Zeu
and [Chl] profiles made in the field. Therefore, specific and regional situations can be compared to the “average” rela-tionships.
The experimental Zeudepths are displayed in Fig. 4 as a
function of measured [Chl]surf, or as a function of [Chl]tot
([Chl]tot is computed by trapezoidal integration over the
[Chl] vertical profiles). The previously published curves (empirical and modeled) depicting the average behavior are also shown. As a first comment, the Pacific waters follow the general pattern; however, in the domain of very low [Chl] (integrated contents), a distinct departure appears, with ob-served Zeuvalues exceeding those corresponding to the
av-erage situation. Note that the largest Zeuvalues, apparently
Chl [mg m−3] Cp ( 5 5 5 ) [ m −1] 0.1 1 10 0 .1 1 Biosope Prosope Bencal
Fig. 5. The particle attenuation coefficient, cp (as m−1) at the
wavelength 555nm, obtained using an ac-9 instrument, and plot-ted as a function of [Chl] for the upper layer waters in the Pacific Ocean (blue dots) and in the Mediterranean Sea (red dots). The line
represents the relationship cp(555)=0.275 [Chl]0.635, derived from
cp(660) in Loisel and Morel (1998; their subsets 2 and 3), and by
using a λ−0.5dependency for the transfer from 660 to 555 nm.
ever observed (∼170 m), are located in the central South Pa-cific gyre (see Fig. 1b in Morel et al., 2007a). Conversely, most of the Mediterranean Zeuvalues are notably lower than
those expected when the average relationship are operated with their [Chl]surfvalues; correlatively, the [Chl]totcolumn
contents are considerably reduced compared to the average. The contrast between the two water bodies is such that within similar euphotic layers (e.g. ∼80 m), the integrated column contents may differ by a factor of about 2, and are notably lower in the Mediterranean waters compared to Pacific. Most likely, such a difference has a potential impact upon the pri-mary production (actual or predicted), to the extent that the first determinant of the primary production is the biomass it-self (this topic is out of the scope of the present study).
The above observations about the euphotic layer, show that the global bio-optical state of the entire water columns are markedly different in the two zones. In Mediterranean waters, additional substances efficiently compete with algae in the absorption process inside the PAR spectral domain, whereas in Pacific waters, phytoplankton with their normal retinue seem to be dominant in this process. This interpreta-tion is compatible with the spectral analysis previously made in the visible and UV parts of the spectrum, which have evi-denced systematically lower Kdvalues in Pacific waters than
in Mediterranean waters.
2.5 The effect of scattering upon attenuation
Note that in the preceding remarks, the absorption term has been put forward to explain the variations in the diffuse at-tenuation coefficients. This is justified by the dominance of
R 300 400 500 600 700 800 1 e− 0 4 0 .0 0 1 0 .0 1 0 .1 Prosope (Chl) MIO1 (0.032) MIO2 (0.029) MIO4 (0.035) MIO5 (0.032) Biosope STB5 (0.035) a λ [nm] R 300 400 500 600 700 800 1 e− 0 4 0 .0 0 1 0 .0 1 0 .1 Aopex (Chl) t1_01 (0.085) t1_02 (0.085) Biosope STB1 (0.098) b 300 400 500 600 700 800 1 e− 0 4 0 .0 0 1 0 .0 1 0 .1 Aopex (Chl) b1_03 (0.13) b1_04 (0.13) Biosope STB18 (0.13) c λ [nm] 300 400 500 600 700 800 1 e− 0 4 0 .0 0 1 0 .0 1 0 .1 Prosope (Chl) UPW3 (1.57) Biosope UPW3 (1.25) d
Figure 6
Fig. 6. Reflectance spectra (Eq. 2, as %) for similar [Chl] values as determined in the Pacific Ocean and in the Mediterranean Sea. The panel (d) shows reflectance spectra for the Chilean and Moroccan upwelling zones.
absorption in the diffuse attenuation process. Indeed, Kdcan
be approximately expressed as (Gordon, 1989)
Kd =1.04(µd)−1(a + bb), (6)
where µdis the average cosine for downward irradiance (of
the order of 0.6–0.9, depending on solar elevation, wave-length, and [Chl] value), and where a and bb are the
ab-sorption and backscattering coefficients, respectively. The latter is always small when compared to the former; typi-cally it amounts to a few per-cent of the absorption coef-ficient; it may reach exceptionally 25%, in extremely clear waters and in the blue-violet part of the spectrum (i.e. when the backscattering by water molecule becomes the dominant process). Nevertheless, the influence of the bbterm has to be
taken into consideration. If bbis enhanced in Mediterranean
waters (e.g. Claustre et al., 2002), because of the presence of more abundant scattering particles, or because of an in-creased backscattering efficiency, it may partly contribute to the enhanced Kdvalues in this zone.
The first argument is supported by Fig. 5, where the parti-cle attenuation coefficients, cp, are displayed as a function of
[Chl] for the Pacific waters and for the Mediterranean wa-ters; also included are some eutrophic waters observed in the South Atlantic (all the cp values were determined by
using AC-9 instruments). At 555 nm, where algal absorp-tion is at its minimum, the attenuaabsorp-tion coefficient is a close proxy of the scattering coefficient. Conspicuously, the scat-tering coefficients in the Mediterranean waters are higher than those in Pacific waters (by almost a factor of 2 for the same [Chl]), whereas the latter follow more closely the em-pirical mean relationship established by Loisel and Morel (2001). Such rather large deviations in Mediterranean, how-ever, stay within the (wide) range of variability previously observed for other oceanic waters (see Fig. 3 ibidem). The presence of submicron Saharan dust in suspension within the upper layer would be a plausible explanation to the enhanced scattering in Mediterranean waters, at least at some seasons (Claustre et al., 2002). More abundant debris than usual or
perhaps coccolithophorids cannot be excluded as other plau-sible (but not identified) causes.
2.6 The spectral irradiance reflectance
In the hyper oligotrophic situations ([Chl]∼0.02 mg m−3)
found in the South Pacific anticyclonic gyre, the upper layer reflectance spectra exhibit uncommon shapes and exception-ally high values. These spectra have been discussed in Morel et al. (2007a), and presented as being those of the bluest nat-ural waters ever observed in the whole ocean. In brief, the
R(λ) values for these waters undergo a maximum slightly
exceeding 13% in the near UV domain (around 394 nm), and
R(λ) is still as high as 6% at 310 nm.
This distinct maximum around 394 nm persists when [Chl] increase (up to 0.13 mg m−3), as shown in Fig. 6a to c; in
these figures the reflectance spectra for Pacific and Mediter-ranean waters with similar [Chl] are comparatively dis-played. The most striking differences between pairs of spec-tra are observed for the UV domain, and extend toward the violet and blue domain, at least for the lowest [Chl] values; they tend to diminish for higher [Chl] values. For the longer wavelengths (say beyond 450–490 nm), the differences in
R(λ) between the two water bodies are minute, albeit
sys-tematic (see discussion below) For the sake of completeness, the last panel of Fig. 6 provides examples of similar eutrophic situations in the Moroccan and Chilean upwelling zones.
At least for Case 1 waters, the ratio of two reflectances at two specific wavelengths (or “band ratio”) is the basis of most of the algorithms (either empirical or semi-analytical) that have been developed for the interpretation of the Ocean Color imagery as captured from space. The semi-analytical algorithm OC4Me (Morel et al., 2007b) by which several and successive band ratios are related to [Chl] (see legend) is rep-resented by the curve in Fig. 7. The corresponding band ra-tios derived from the reflectance spectra determined in the Pacific and Mediterranean environments are superimposed on this curve. According to the way it has been built, this semi-analytical algorithm represents an average situation for Case 1 waters. To the extent that these waters experience a natural variability around the statistically averaged values, a scatter of the data is expected; this is clearly demonstrated by Fig. 7. Note that this natural scatter around the average is the main cause of the limitation in the [Chl] retrieval from space, whatever the algorithm (semi-analytical as here or empirical) that is employed.
The scatter is not completely disorganized, however. In-deed, in the domain of low [Chl], when the band ratio in-volved is R(443)/R(560), the Mediterranean waters are often below the modeled curve (actually, most of the data from PROSOPE and AOPEX cruises, but not those from the MI-NOS cruise, which perhaps indicates a seasonality in this trend). This deviation leads to [Chl] returns of the algorithm larger than the in situ values. This bias in the Mediterranean waters has already been pointed out and discussed in
Claus-Chl [mg m−3] Ba n d ra ti o 0.01 0.1 1 10 1 1 0
Fig. 7. The curve represents the semi-analytical algorithm (OC4Me) developed for the MERIS sensor to derive [Chl]. It is of the maximum band ratio type; namely, it makes use of the largest ratio of spectral reflectances amongst the three following ones R(443)/R(560), R(490)/R(560), and R(510)/R(560). The switch
be-tween the first and second ratio occurs around [Chl] ∼0.54 mg m−3,
and between the second and third one around 2.2 mg m−3. The field
data are plotted in the same way, so that for most of the Pacific and Mediterranean data (blue and red symbols, respectively), the max-imum ratio implied (and plotted) is R(443)/R(560). For the waters of the Moroccan and Chilean upwelling zones, as well as for the Benguela Current data (green symbols) the two other ratios are im-plied. The grey symbols stand for earlier data already shown in MM01.
tre et al. (2002); actually, specific algorithms for the retrieval of [Chl] have been proposed and used in the case of this sea (D’Ortenzio et al., 2002; Bricaud et al., 2002).
In contrast, for the Pacific waters, and particularly for very low [Chl] values (<0.03 mg m−3), the measured
R(443)/R(560) ratios are slightly higher than the modeled ones, and thus entail a slight underestimate of the actual concentration when applying the nominal algorithm. These departures from the average curve (i.e. from algorithm) are fully coherent with the deviations already noted regarding the spectral attenuation coefficients, a proxy of the absorption coefficients (recall that R is roughly inversely proportional to absorption). In case-1 waters, absorption and backscattering do not tightly co-vary with [Chl], so that reflectance, or re-flectance ratios as above, necessarily show deviations around the values derived from the nominal algorithms. Lee and Hu (2006) defined criteria based on “acceptable” deviations with respect to these algorithms; beyond these thresholds, the wa-ters could not longer be considered as Case 1. These (admit-tedly arbitrary) criteria appear to be too restrictive compared to the possible deviations as, for instance, those presently observed. Without entering a debate easily of semantic na-ture, a larger range of waters could be categorized as Case 1
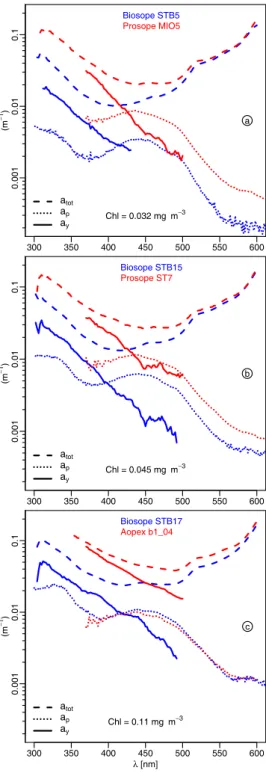
(m −1) 300 350 400 450 500 550 600 0 .0 0 1 0 .0 1 0 .1 atot ap ay Biosope STB5 Prosope MIO5 Chl = 0.032 mg m−3 a (m −1) 300 350 400 450 500 550 600 0 .0 0 1 0 .0 1 0 .1 atot ap ay Biosope STB15 Prosope ST7 Chl = 0.045 mg m−3 b λ [nm] (m −1) 300 350 400 450 500 550 600 0 .0 0 1 0 .0 1 0 .1 atot ap ay Biosope STB17 Aopex b1_04 Chl = 0.11 mg m−3 c
Fig. 8. Spectra of the total absorption coefficient (atot), derived
from the diffuse attenuation coefficient, of the particulate
absorp-tion (ap) determined via the glass fiber filter technique, and of the
dissolved colored matter (ay, see text). (a) For a couple of stations
in Pacific and Mediterranean waters (blue and red curves, respec-tively) with the same chlorophyll concentration, as indicated. (b) and (c) As in (a), but for other [chl] values. Note that during the
Mediterranean cruises and because of technical limitations, the ap
determinations were restricted in the UV domain to 370 nm.
Conse-quently, the ayestimates experience the same spectral limitations.
This limitation was removed for the BIOSOPE cruise.
waters, more in conformity with their biogeochemical status and definition, if less stringent criteria were adopted.
3 Discussion
Very likely because the nutricline is extremely deep (1 µM NO−3 at ∼200 m; Fig. 5a, Claustre et al., 20071), so that the [Chl] values stay minimal over extended water columns (0 to 100 m or more), the oligotrophic waters in the South Pacific gyre are among the clearest natural wa-ters. They are systematically more transparent to solar ra-diation than “average” Case 1 waters with similar [Chl], and, a fortiori, when compared to Mediterranean waters, that con-versely are less transparent than average.
Actually, between individual Kd(λ) values in Pacific
wa-ters and those resulting from the global Kd(λ)↔[Chl]
re-lationships, the difference is not so large within the visi-ble part of the spectrum. For a merged dataset (all those discussed here plus earlier data), the RMSE for the log-transform Kd(λ) and [Chl] data (see Table 4 and Fig. 4, in
Morel et al., 2007b) is 0.08 at 510 nm (corresponding to ran-domly distributed deviations in Kd of about ±20% with
re-spect to the mean). The RMSE progressively increases for decreasing wavelengths; for instance, it reaches 0.12 (±32% deviations) at 412 nm. Therefore, from this point of view, the Pacific data are not exceptional, as they remain within the expected “normal” dispersion for Kdin Case 1 water (at
least ±35%). Nevertheless, the important observation is that the observed divergences are “polarized”, i.e., systematically oriented toward the minimal Kd values inside the range of
possible dispersion. This orientation, which is not random, undoubtedly reveals differing composition and optical prop-erties of the biogenous material in the oligotrophic Pacific compared with those in average Case 1 waters.
For the Mediterranean Sea, systematic divergences also occur, yet in the opposite direction (Kdsystematically above
the average). These deviations are observed in the visible do-main; into the UV domain, the results of regression analyses show that the divergences between the two water bodies con-tinue to increase. Another striking difference between these waters lies in the degree of dependency of their UV absorb-ing materials upon the local and contemporaneous chloro-phyll concentration. This dependency appears to be much higher in Pacific waters than in Mediterranean waters, as re-flected by their respective exponent e(λ) values (cf. Fig. 3b). Consistently, the reflectance spectra of the two bodies also diverge in the violet-blue and UV part of the spectrum in di-rections which are predictable from their Kddifferences. To
various degrees, both the violet-blue and UV reflectances are simultaneously affected by the change in bio-optical prop-erties; therefore, some information is present in the visible reflectance about the properties in the UV domain. Actually, ocean color remote sensing in UV has never been routinely attempted; the rationale for providing the presently in flight
sensors with a channel at 412 nm was nevertheless the pos-sibility of discriminating [Chl] from CDOM, and possibly to extrapolate toward the UV domain. Up to now, the at-mospheric correction problem at this wavelength has been a serious obstacle to proceed safely in this direction.
Imbedded within the average “laws” for Case 1 waters (for instance, the Kd(λ)↔[Chl] statistical relationships), certain
implicit (and non-linear) relationships between the algal and the non-algal compartments are underlying. The algal partment is presently quantified through [Chl], i.e., the monly available (albeit imperfect) index. The non-algal com-partment includes both dissolved colored material (CDOM) and particulate materials (various debris plus heterotrophic organisms). The optical variability inside Case 1 waters with respect to the average laws (Gordon and Morel, 1983b, 65– 67), originates primarily from the fluctuations in the relative proportions of the algal and non-algal compartments. To a second order, the fluctuations inside each compartment (e.g., differing absorbing characteristics from one phytoplankton assemblage to another one, or differing yellow substance or detritus composition) may also induce an additional variabil-ity.
Beside the water absorption, the algal pigment absorption with its typical bands is the dominant factor governing the diffuse attenuation in the visible domain. The optical vari-ability around the average laws is lower here than in the UV domain (cf. the r2in Fig. 3c). In this UV domain, the optical role of the algal compartment is comparatively diminishing. The various particles (algal, bacterial, heterotrophic commu-nities, and organic debris) are still contributing to absorption in the UV domain (e.g. Stramski and Kiefer, 1998); their UV spectra are characterized by a broad minimum around 360 nm and below this wavelength, a peak of variable ampli-tude around at 320 nm (likely due to mycosporine-like amino acids (see Arrigo et al., 1998; Laurion et al., 2003). The main source of attenuation, however, is the colored dissolved organic material (CDOM, or “yellow substance”), which is characterized by a regular and steep slope toward the shortest wavelengths. Varying CDOM concentrations, not tightly cor-related to the local and contemporaneous algal abundance, are most probably the major cause of the optical variability in the UV.
The dominance of CDOM is illustrated clearly through some comparative examples (Fig. 8). They are based on Figs. 11 and 12 in Morel et al. (2007a), to which are added results from the Mediterranean Sea with identical [Chl]. The additional panel (8c) provides another couple of data for larger values of [Chl]. Beside the total absorption atot(λ)
(ob-tained by inversion of Kd(λ); see ibid.), are plotted the
exper-imentally determined particulate absorption spectra, ap(λ),
and also the dissolved absorption spectra, ay(λ), obtained by
subtracting both ap(λ) and the pure water absorption, aw(λ),
from atot(λ).
In all situations, the yellow substance absorption is pre-ponderant in the UV domain (and even the violet-blue
do-Chl [mg m−3] ay ( 3 7 0 ) [ m − 1 ] 0.1 1 0 .0 1 0 .1 0.02 0.05 0.2 0.5 2 0 .0 0 5 0 .0 2 0 .0 5
Fig. 9. As a function of [Chl], the CDOM absorption coefficient at 370 nm, for all stations in Pacific (blue symbols, BIOSOPE cruise) and Mediterranean waters (red symbols, PROSOPE and AOPEX cruises). The straight line corresponds to the best fit for the Pacific data only, as already shown in Morel et al. (2007a), which expresses
as ay(370)=0.10 [Chl]0.80(with r2=0.94 on the log-transform data).
Note that the dots beyond 1 mg m−3correspond to waters in the
Peruvian (blue) and Moroccan (red) upwelling zones.
main) when compared to the particulate matter absorption. Actually, ay(λ) begins to be smaller than ap(λ) when λ
ex-ceeds 425 nm, approximately (and is never smaller at the Mediterranean station AOPEX B1-04). Interestingly, the ay
spectra in the two water bodies are approximately parallel, with an exponential slope around 0.016 nm−1(discussed in Morel et al., 2007a). The difference is in the magnitude of
ay(λ); for similar [Chl], the ay(λ) values in the
Mediter-ranean waters are always higher (by a factor 2 or even 3) than in Pacific. Such a systematic difference between the two oceanic zones is clearly seen in Fig. 9 (for λ=370 nm) which is redrawn from Fig. 13 (ibid.), to which the Mediter-ranean data have been overlaid. A rather loose correlation still exists between the ay(370) term and [Chl], at least when
each zone is considered separately. This is especially true for Pacific waters, maybe because the [Chl] range (2 orders of magnitude) allows a significant trend to be extracted. When all data are pooled together, the covariation almost vanishes (a similar conclusion was drawn by Siegel et al., 2005).
The similarity between this Fig. 9 and the previous Fig. 5 is an interesting feature; compared to the South Pacific ters, the particulate scattering “excess” in Mediterranean wa-ters parallels the “excess” of dissolved absorbing matter. It is tempting to imagine a relation of cause-and-effect, which, however, remains to be demonstrated on the basis of biogeo-chemical arguments.
4 Conclusions
When examining the natural variability in Case 1 waters, it is necessary to consider separately the visible and the UV domains.
In the visible domain, abundantly documented, it appears that the present data do not exceed the (rather wide) disper-sion range already recorded, in particular for the Kd↔[Chl]
relationship. For the two water bodies here studied, the vari-ability is not at random; instead it lies in the systematic char-acter of the observed deviations, either steadily negative (Pa-cific waters), or positive (Mediterranean waters). Therefore, the generic Case 1 water model is not the most accurate one to describe accurately such local situations. As pointed out by Mobley et al. (2004) “within Case 1 waters, there is a factor-of-two (and sometimes much greater) variability in the values of optical properties for a given chlorophyll value”. The two water bodies examined in this study are demonstra-tive examples of such situations and of significant departures from the average. This observation does mean that the con-cept of Case 1 water, or the Chl-based models, fail, but their true significance and their statistically limited validity must be kept in mind. In fact without the use of this concept and in absence of local information, the interpretation of ocean color remote sensing data would have not been possible for about 95% of the oceanic area.
When facing these two rather contrasted situations and ge-ographical zones, the question arises: are we in presence of the end members of the possible variations inside Case 1 wa-ters? This obviously cannot be ascertained, but the consid-eration of older data may help. These data (the grey dots in Fig. 1, mostly from the Atlantic Ocean) are sometimes superimposed onto or stand between the present Pacific and Mediterranean data. This observation thus suggests a posi-tive answer to the above question, but the consideration of polar waters may lead to another answer (e.g., Reynolds et al., 2001; Stramska et al., 2003).
For the bio-optical state in the UV domain, there is not much information, nor a Case 1 water model. The large dif-ferences and variations detected here tend to compromise the reliability of a general model. Actually the notion of Case 1 water, and its usefulness, rest on the dominance of the algal material in shaping the bio-optical properties in the visible part of the spectrum. This dominance no longer exists in the UV; instead, it is replaced by that of the dissolved colored matter, whose origin, life-history, dynamics, and thus result-ing concentration, are largely disconnected from the contem-poraneous algal presence. According to this argument, com-parable environments with respect to [Chl] may largely differ regarding their UV properties. This observation was previ-ously made in the field (Sargasso Sea) regarding the transi-tional domain of the violet-blue radiation, already affected by this colored matter (Nelson, 1998), and even at global scale via the interpretation of satellite observations (Siegel et al., 2002a and b). In summary, the causes of the natural
variabil-ity in Case 1 waters can be identified; as far as the visible do-main is concerned, the variability is do-maintained within lim-ited and already identified bounds. The same causes, how-ever, have an amplified effect in the UV domain and induce more variability, so that the prediction of the optical prop-erties in this spectral domain, if based on the [Chl] index, becomes highly problematic.
Acknowledgements. The HPLC pigment determinations were
per-formed for the PROSOPE cruise by J. Ras, J.-C. Marty, and one of the author (H.C.), and by J. Ras for the BENCAL, AOPEX and BIOSOPE cruises. J. Ras has maintained at a high level the qual-ity control of these pigment determinations throughout this multi-year multi-cruise operation and she is particularly thanked. We ac-knowledge the help provided at sea by M. Babin, M. Chami, and N. Soua¨ıdia during the radiometric measurements, and E. Leymarie for developing a fast acquisition/processing software dedicated to the spectroradiometers. We are also indebted to Y. Huot for useful comments on a first draft of the present paper.
The crew and officers of the Research Vessels Thalassa, Africana, Le Suroit, and Atalante were instrumental in the success of the
successive cruises. The financial supports for these campaigns
of the Centre National de la Recherche Scientifique and Institut des Sciences de l’Univers (CNRS and INSU), the Marine Coastal Management (MCM, Cape Town, South Africa), the Centre National d’Etudes Spatiales (CNES), the National Aeronautics and Space Administration (NASA), and the European Space Agency (ESA) were essential and much appreciated.
Edited by: E. Boss
References
Arrigo, K. R., Robinson, D. H., Worthen, D. L., Schieber, B., and Lizotte, M. P.: Bio-optical properties of the southwestern Ross Sea, J. Geophys. Res., 103, 21 683–21 695, 1998.
Austin, R. W. and Petzold, T. J.: The determination of the dif-fuse attenuation coefficient of sea water using the coastal zone color scanner, Oceanography from Space, Plenum Press, 239– 256, 1981.
Baker, K. S. and Smith, R. C.: Bio-optical classification and model of natural waters, Limnol. Oceanogr., 27, 500–509, 1982. Banse, K.: Should we continue to use the 1% light depth for
esti-mating the compensation depth of phytoplankton for another 70 years?, Limnol. Oceanogr. Bull., 13, 49–51, 2004.
Bricaud, A., Bosc, E., and Antoine, D.: Algal biomass and sea sur-face temperature in the Mediterranean basin: Intercomparison of data from various satellite sensors, and implications for pri-mary production estimates, Remote Sens. Environ., 81, 163–178, 2002.
Bricaud, A., Babin, M., Morel, A., and Claustre, H.: Variability in the chlorophyll-specific absorption coefficients of natural phyto-plankton: Analysis and parameterization, J. Geophys. Res., 100, 13 321–13 332, 1995.
Bricaud, A., Morel, A., Babin, M., Allali, K., and Claustre, H.: Variations of light absorption by suspended particles with chloro-phyll a concentration in oceanic (Case 1) waters: Analysis
and implications for bio-optical models, J. Geophys. Res., 103, 31 033–31 044, 1998.
Buiteveld, H., Hakvoort, J. H. M., and Donze, M.: The optical prop-erties of pure water, SPIE Ocean Optics XII, 2258, 174–183, 1994.
Claustre, H., Morel, A., Hooker, S. B., Babin, M., An-toine, D., Oubelkheir, K., Bricaud, A., Leblanc, K., Que-quiner, B., and Maritorena, S.: Is desert dust making olig-otrophic waters greener?, Geophys. Res. Lett., 29, 1469, doi:10.1029/2001GL014056, 2002.
D’Ortenzio, F., Marullo, S., Ragni, M., Ribera d’Alcala, M., and Santoleri, R.: Validation of empirical SeaWiFS algorithms for chlorophyll a retrieval in the Mediterranean Sea: A case study for oligotrophic seas, Remote Sens. Environ., 82, 79–94, 2002. Fougni´e, B., Henry, P., Morel, A., Antoine, D., and Montagner,
F.: Identification and characterization of stable homogeneous oceanic zones: climatology and impact on in-flight calibration of space sensor over Rayleigh scattering, Ocean Optics XVI, Santa Fe, NM, 18–22 November, 2002.
Gordon, H. R.: Can the Lambert-Beer law be applied to the diffuse attenuation coefficient of ocean water?, Limnol. Oceanogr., 34, 1389–1409, 1989.
Gordon, H. R. and Morel, A.: Remote sensing of ocean color for in-terpretation of satellite visible imagery; A review, Springer ver-lag, 114 pp., 1983
Gordon, H. R., Brown, O. B., Ewans, R. H., Brown, J. W., Smith, R. C., Baker, K. S., and Clark, D. K.: A semi-analytical radiance model of ocean color, J. Geophys. Res., 93, 10 909–10 924, 1988. Laurion, I., Blouin, F., and Roy, S.: The quantitative filter technique for measuring phytoplankton absorption; Interference by MAAs in the UV waveband, Limnol. Oceanogr. Methods, 1, 1–9, 2003. Lee, Z. P. and Hu, C.: Global distribution of case-1 waters: An anal-ysis from seawifs measurements, Remote Sens. Environ., 101, 270–276, 2006.
Loisel, H. and Morel, A.: Light scattering and chlorophyll concen-tration in Case 1 waters: A reexamination, Limnol. Oceanogr., 43, 847–858, 1998.
Mobley, C. D., Stramski, D., Bissett, W. P., and Boss, E.: Optical modeling of ocean waters: Is the case 1-case 2 classification still useful?, Oceanography, 12, 61–67, 2004.
Morel, A.: Optical properties of pure water and pure seawater, in: Optical Aspects of Oceanography, edited by: Steeman-Nielsen, N. G. J. E., Academic, 1–24, 1974.
Morel, A.: Optical modeling of the upper ocean in relation to its biogenous matter content, J. Geophys. Res., 93, 10 749–10 768, 1988.
Morel, A. and Berthon, J.-F.: Surface pigments, algal biomass pro-files, and potential production of the euphotic layer: Relation-ships reinvestigated in view of remote sensing applications, Lim-nol. Oceanogr., 34, 1545–1562, 1989.
Morel, A., Gentili, B., Chami, M., and J. Ras: Bio-optical proper-ties of high chlorophyll Case 1 waters, aand of yellow-substance-dominated Case 2 waters, Deep-Sea Res. I, 53, 1439–1559, 2006. Morel, A. and Maritorena, S.: Bio-optical properties of ocanic
wa-ters: A reappraisal, J. Geophys. Res., 106, 7163–7180, 2001.
Morel, A. and Gentili, B.: Radiation transport within
oceanic (Case 1) water, J. Geophys. Res., 109, C06008, doi:10.1029/2003JC002259, 2004.
Morel, A., Gentili, B., Claustre, H., Babin, M., Bricaud, A., Ras, J., and Ti`eche, F.: Optical properties of the “clearest” waters, Limnol. Oceanogr., 52, 217–229, 2007a.
Morel, A., Huot, Y., Gentili, B., Werdell, P. J., Hooker, S. B., and Franz, B. A.: Examining the consistency of products derived from various ocean color sensors in open ocean (Case 1) wa-ters in the perspective of a multi-sensor approach, Remote Sens. Environ., 111, 69–88, doi:10.1016/j.rse.2007.03.012, 2007b. Nelson, N. B., Siegel, D. A., and Michaels, A. F.: Seasonal
dynam-ics of colored dissolved material in the Sargasso Sea, Deep-Sea Res. I, 45, 931–957, 1998.
Preisendorfer, R. W.: Application of radiative transfer theory to light measurement in the sea, IUGG Monography, 10, 11–30, 1961.
Ras, J., Uitz, J., and Claustre, H.: Spatial variability of phyto-plankton pigment distribution in the South East Pacific, Biogeo-sciences Discuss., 4, 3409–3451, 2007,
http://www.biogeosciences-discuss.net/4/3409/2007/.
Reynolds, R. A., Stramski, D., and Mitchell, B. G.: A chlorophyll-dependent semianalytical reflectance model derived from field measurements of absorption and backscattering coefficients within southern ocean, J. Geophys. Res., 106, 7125–7138, 2001. Ryther, J. H.: Photosynthesis in the ocean as a function of light
intensity, Limnol. Oceanogr., 1, 61–70, 1956.
Siegel, D. A., Maritorena, S., Nelson, N. B., Hansell, D. A., and Lorenzi-Kayser, M.: Global ocean distribution and dynamics of colored dissolved and detrital organic material, J. Geophys. Res., 107(C12), 3328, doi:1029/2001JC000965, 2002.
Siegel, D. A., Maritorena, S., Nelson, N. B., and Behrenfeld, M. J.: Independence and interdependencies of global ocean color properties: Reassessing the bio-optical assumption, J. Geophys. Res., 110, C07011, doi:10.1029/2004JC002527, 2005a. Siegel, D. A., Maritorena, S., Nelson, N. B., Behrenfeld,
M. J., and McClain, C. R. Colored dissolved organic mat-ter and its influence on the satellite-based charamat-terization of the ocean biosphere, Geophys. Res. Lett., 32, L20605, doi:10.1029/2005GL024310, 2005b.
Smith, R. C. and Baker, K. S.: Optical properties of the clearest natural waters (200–800 nm), Appl. Opt., 20, 177–184, 1981. Stramska, M., Stramski, D., Hapter, R., Kaczmarek, S., and Ston, J.:
Bio-optical relationships and ocean color algorithms for the north polar region of the atlantic, J. Geophys. Res., 108(C5), 3143, doi:3110.1029/2001JC001195, 2003.
Stramski, D. and Kiefer, D. A.: Can heterotrophic bacteria be im-portant to marine absorption?, J. Plankton Res., 20, 1489–1500, 1998.
Tyler, J. E.: Report on the the second meeting of the joint group of experts on photosynthetic radiant energy, UNESCO Technical Papers in Marine Science, 5, 1–11, 1966.
Uitz, J., Claustre, H., Morel, A., and Hooker, S. B.: Vertical dis-tribution of phytoplankton communities in open ocean: An as-sessment based on surface chlorophyll, J. Geophys. Res., 111, C08005, doi:10.1029/2005JC003207, 2006.
![Fig. 1. Plot of the K d values for the upper layer as a function of [Chl], and for selected wavelengths, as indicated](https://thumb-eu.123doks.com/thumbv2/123doknet/14784753.598221/5.892.151.741.94.539/plot-values-upper-layer-function-selected-wavelengths-indicated.webp)
![Fig. 5. The particle attenuation coefficient, c p (as m −1 ) at the wavelength 555nm, obtained using an ac-9 instrument, and plot-ted as a function of [Chl] for the upper layer waters in the Pacific Ocean (blue dots) and in the Mediterranean Sea (red dots](https://thumb-eu.123doks.com/thumbv2/123doknet/14784753.598221/8.892.78.427.99.371/particle-attenuation-coefficient-wavelength-obtained-instrument-function-mediterranean.webp)
![Fig. 6. Reflectance spectra (Eq. 2, as %) for similar [Chl] values as determined in the Pacific Ocean and in the Mediterranean Sea](https://thumb-eu.123doks.com/thumbv2/123doknet/14784753.598221/9.892.192.699.94.647/reflectance-spectra-similar-values-determined-pacific-ocean-mediterranean.webp)
![Fig. 7. The curve represents the semi-analytical algorithm (OC4Me) developed for the MERIS sensor to derive [Chl]](https://thumb-eu.123doks.com/thumbv2/123doknet/14784753.598221/10.892.468.813.94.366/curve-represents-analytical-algorithm-developed-meris-sensor-derive.webp)
![Fig. 9. As a function of [Chl], the CDOM absorption coefficient at 370 nm, for all stations in Pacific (blue symbols, BIOSOPE cruise) and Mediterranean waters (red symbols, PROSOPE and AOPEX cruises)](https://thumb-eu.123doks.com/thumbv2/123doknet/14784753.598221/12.892.466.817.92.439/function-absorption-coefficient-stations-pacific-biosope-mediterranean-prosope.webp)
