HAL Id: hal-03050129
https://hal.archives-ouvertes.fr/hal-03050129
Submitted on 10 Dec 2020HAL is a multi-disciplinary open access archive for the deposit and dissemination of sci-entific research documents, whether they are pub-lished or not. The documents may come from teaching and research institutions in France or abroad, or from public or private research centers.
L’archive ouverte pluridisciplinaire HAL, est destinée au dépôt et à la diffusion de documents scientifiques de niveau recherche, publiés ou non, émanant des établissements d’enseignement et de recherche français ou étrangers, des laboratoires publics ou privés.
LMDzT-INCA dust forecast model developments and
associated validation efforts
M Schulz, A Cozic, S Szopa
To cite this version:
M Schulz, A Cozic, S Szopa. LMDzT-INCA dust forecast model developments and associated vali-dation efforts. IOP Conference Series: Earth and Environmental Science, IOP Publishing, 2009, 7, �10.1088/1755-1307/7/1/012014�. �hal-03050129�
IOP Conference Series: Earth and Environmental Science
OPEN ACCESS
LMDzT-INCA dust forecast model developments
and associated validation efforts
To cite this article: M Schulz et al 2009 IOP Conf. Ser.: Earth Environ. Sci. 7 012014
View the article online for updates and enhancements.
Related content
Multiple regression method to determine aerosol optical depth in atmospheric column in Penang, Malaysia
F Tan, H S Lim, K Abdullah et al.
-Interpolation for Aerosol Optical Depth at Four Wavelengths over Ilorin from Observed Aeronet Data
R.S Sa’id and S. Garba
-Previsibility of Saharan dust events using the CHIMERE-DUST transport model
L Menut, I Chiapello and C Moulin
-Recent citations
Technical Note: On the use of nudging for aerosol-climate model intercomparison studies
K. Zhang et al
-Technical Note: On the use of nudging for aerosol–climate model intercomparison studies
K. Zhang et al
LMDzT-INCA Dust Forecast Model Developments and
Associated Validation Efforts
M Schulz, A Cozic and S Szopa
Laboratoire des Sciences du Climat et de l'Environnement, CEA-CNRS-IPSL, Gif-sur-Yvette Cedex, France
Email: [email protected]
Abstract. The nudged atmosphere global climate model LMDzT-INCA is used to forecast
global dust fields. Evaluation is undertaken in retrospective for the forecast results of the year 2006. For this purpose AERONET/Photons sites in Northern Africa and on the Arabian Peninsula are chosen where aerosol optical depth is dominated by dust. Despite its coarse resolution, the model captures 48% of the day to day dust variability near Dakar on the initial day of the forecast. On weekly and monthly scale the model captures respectively 62% and 68% of the variability. Correlation coefficients between daily AOD values observed and modelled at Dakar decrease from 0.69 for the initial forecast day to 0.59 and 0.41 respectively for two days ahead and five days ahead. If one requests that the model should be able to issue a warning for an exceedance of aerosol optical depth of 0.5 and issue no warning in the other cases, then the model was wrong in 29% of the cases for day 0, 32% for day 2 and 35% for day 5. A reanalysis run with archived ECMWF winds is only slightly better (r=0.71) but was in error in 25% of the cases. Both the improved simulation of the monthly versus daily variability and the deterioration of the forecast with time can be explained by model failure to simulate the exact timing of a dust event.
1. LMDZT-INCA aerosol model
The global aerosol transport model LMDzT-INCA is operated for an experimental chemical weather forecast system. The model includes a dust aerosol component as part of a multi-component aerosol module. For the forecast version we nudge the winds, which means that three dimensional wind fields for every 6 hour time step for all the forecasted time period are used from NCEP and ECMWF to guide the model wind fields and hence force the atmospheric model LMDzT to follow synoptic weather evolution.
The relaxation of the GCM wind components
u and vtoward NCEP or
ECMWF meteorology is performed by applying a correction term to the GCM winds with a
relaxation time of 2.5 h for both variables and over the whole model domain.
For experimental purposes we use three day forecasted winds for NCEP and five days from ECMWF. We use the standard LMDzT-INCA model as described e.g. by [1] and its aerosol module as documented within the AeroCom model intercomparison effort [2] with a horizontal resolution of ca 3.75º x 2.85º.Dust erosion by wind is responsible for the largest fraction of the global aerosol mass load. Erosion takes place mainly in semi-arid and arid regions but not everywhere in such regions and not at all times. While the erosion of dust is a strong function of wind speed, approximately to the power of three, it is necessary to account in a dust source model for limitations in erodibility. We have WMO/GEO Expert Meeting on an International Sand and Dust Storm Warning System IOP Publishing IOP Conf. Series: Earth and Environmental Science 7 (2009) 012014 doi:10.1088/1755-1307/7/1/012014
c
implemented several such limitations: the “erosion potential” of a given region provides the maximum amount of dust which is effectively available for atmospheric transport under favourable wind speed conditions; the “varying state of the soil” can introduce a variability in the erosion potential through wetting of the soil and freezing conditions; the “threshold wind speed” expresses that limit above which wind stress can effectively start the erosion process; the initial “dust size
distribution” corresponds to that fraction of the saltated soil particle spectrum which is long range
transported. The simplified formula of the INCA dust flux Fdust reads as follows (equation 1):
Fdust =C⋅u2 ⋅(u−ut)⋅Fsoil if (1)
t
u
u
>
where C represents the erosion potential, u the surface wind speed, ut the threshold velocity above
which wind erosion can take place, Fsoil represents the inhibiting factor due to unfavorable soil
conditions. The erosion potential C is varied for different dust minerals and for number and mass of uplifted dust to provide an initial size distribution. We assume, that for a given sufficiently high wind speed, in dry conditions, a constant maximum erosion potential is valid for each region. This potential will integrate subgrid scale variability of erodibility and vegetation cover. It represents the effective grid area fraction in which the soil is erodible. It also incorporates a parameterisation for which fraction of the saltated dust leaves the close-to-the-ground saltation layer and enters into the atmospheric boundary layer for transport. We have chosen to use the remote sensing products from TOMS and Aeronet to obtain an erosion potential C for larger regions [3,4]. It is defined only in regions where precipitation is less than 300 mm per year. Values close to 2 ug m-5 s-2 are retrieved, but
vary between 0.05 and 2 for the different deserts of the world. On rare occasions it rains also in arid and semi-arid regions and the state of the soil becomes unfavourable to dust erosion. We assume that a wet or frozen soil inhibits dust erosion, since soil particles are bound together with water or ice. [5] and [6] have shown that corn size and temperature are the most important factors to explain how long water is retained in top desert soils. Dust is known to be eroded only above a threshold velocity which may vary from region to region. The INCA dust source extends the mapped Saharan dust source of [7] [MB95]. This is done through the mineralogical information for arid and semi-arid areas contained in the FAO (Food Agriculture Organisation) database of soil types [8,9], and by establishing a spatial correspondence between threshold velocities from MB95 and the different FAO soil types. The residence time of mineral dust in the atmosphere depends to a large extent on the initial size distribution of the dust, since sedimentation is the major removal process near the sources. Our sensitivity tests in the chemical transport model TM2 [10] showed that an initial size distribution with a mass median diameter of 2.5 µm with a geometric standard deviation of two is a good assumption to be able to simulate the long range dust transport of dust. At the same time note that the modal approach used in the LMDzT-INCA aerosol module assures that the size distribution evolves with time of transport.
2. Definition of Experimental runs
The experimental forecast system is running since summer 2005. It has been originally built to support experimental campaigns. Daily forecasted NCEP and ECMWF winds are retrieved once a day to nudge the LMDzT model. Each daily forecast simulation encompasses a period of three days (based on NCEP winds) or five days (based on ECMWF winds). While the nudging is done at the model resolution of 3.75ºx2.85º, forecasted surface winds are used in addition at a higher resolution of 1x1 degree to compute with higher accuracy the dust fluxes. Dust fluxes are then interpolated to the transport model resolution at every time step (30 minutes). Results have been stored from all model runs and we examine exemplary our simulations forced by ECMWF winds. Results are here combined into three continuous time series of simulated aerosol fields, corresponding to the initial day of each simulation (named J0) and to the forecasted day 2 and 5 of each simulation. Model runs are performed every day based on the restart file obtained at the end of the first day of yesterday’s simulation. The restart files contain the initial conditions of the meteorological parameters and tracer mixing ratio WMO/GEO Expert Meeting on an International Sand and Dust Storm Warning System IOP Publishing IOP Conf. Series: Earth and Environmental Science 7 (2009) 012014 doi:10.1088/1755-1307/7/1/012014
fields. Note that only the winds are taken as external forcing from NCEP and ECMWF for a suite of forecast simulations. Once the forecast chain is broken it requires several days before the system is at equilibrium with respect to the aerosol fields. In the case of a discontinuation of the model runs, the latest available restart file is used. The results of the forecast model with respect to the evolution of the aerosol and gas species are accessible via a web interface: http://www-lsceinca.cea.fr/cgi-bin/lsce/inca_work_annualrs.pl. A reanalysis run was performed later which made use of the operational ECMWF winds. This run did not experience interruptions as did the experimental forecast system.
3. Evaluation of the LMDZT INCA dust forecasts
Validation is done here on an exemplary basis using Aeronet sun photometer and MODIS satellite derived aerosol optical thickness at 550 nm (AOD). Figure 1 shows the comparison of a dust cloud exiting North Africa on September 4, 2005, observed by MODIS and compared to the simulated AOD field of the INCA forecast model version. The form of the dust plume in both satellite observation and modeled dust AOD field suggests that the dust had exited across a small stretch of the African coast. In both images one can also see the dispersion of the dust over the Atlantic, which involved a southward directed vortex. Such correspondence between model and satellite has been found on several occasions.
Figure 1. An aerosol plume with elevated dust aerosol optical depth leaves West-Africa on September 4th of 2005. The plume is forecasted by the INCA model at day 2 of the forecast
simulation (left image). The corresponding MODIS-Terra satellite observation (right image) shows a thick dust cloud in an area corresponding to the white window frame found in the INCA-model forecast image.
The comparison of the daily time variation of AOD is shown exemplary for the Aeronet/Photons site near Dakar in Figure 2. Despite its coarse resolution, the forecast model captures 48% of the day to day dust variability within the year 2006 near Dakar (reanalysis model version 50%). On weekly and monthly scale the model captures respectively 63% and 71% of the variability (reanalysis version: 70% and 74%). Most of the smaller dust events are found both in the Aeronet and modeled time series. For some large dust events the coherence is less well. The results suggest that for some large dust events the model seems to predict too high dust levels. In the reanalysis run, this feature of the model disappeared partly (not shown). Since the dust emissions and thus the amplitude of the dust events is largely driven by the surface winds, which are directly taken from NCEP and ECMWF for our forecast model, we suspect that there is a major difference in the reanalysis ECMWF surface wind fields.
WMO/GEO Expert Meeting on an International Sand and Dust Storm Warning System IOP Publishing IOP Conf. Series: Earth and Environmental Science 7 (2009) 012014 doi:10.1088/1755-1307/7/1/012014
Figure 2. Mean daily total aerosol optical depth as measured at the AERONET/PHOTONS site near Dakar in West Africa by a sun photometer against the INCA model simulated values. Three modelled time series are shown: J0 corresponds to the day when the model is initialised, J2 corresponds to day two of the forecast and J5 uses the forecast five days ahead.
We explore also the deterioration of dust forecast with time of forecast. Correlation coefficients between daily AOD values observed and modelled at Dakar decrease from 0.69 for the initial forecast day J0 to 0.59 and 0.41 respectively for two days ahead and five days ahead. The correlation found for the reanalysis run is found to attain 0.71.
Other possibilities to judge the forecast model are hit rates and the error in predicting high levels of dust. Hit rates are established by calculating those occurrences when the model AOD level is within a range of 0.3 of the observed value. Such hit rates attain 76%, 72% and 64% for the time steps J0, J2 and J5. This shows that the model can predict major dust events, which can result in high AOD values of well above 1 in the area as can be seen from figure 2. We also calculate the possible error in eventually issuing a warning for major dust events. We define here a major dust event as one with AOD values greater 0.5. Table 1 reports the cases when the model would have issued a correct or a false dust warning, in other words when it would have missed an event and when it correctly assumed that dust is below the warning level. For a threshold level of 0.5 AOD we find that at Dakar the model is correctly predicting on 71% (68%, 65%) of the days for time step J0 ( J2, J5 respectively) the state of the dust load, be it over the threshold or below. As can be seen from the detailed error analysis in Table 1, an AOD greater than 0.5 is observed on 36% of the days. These dusty days are predicted correctly almost every third time even on forecast day five, when 27 events are correctly predicted and 52 are missed out. However there are also quite some false alarms (or falsely timed alarms). Even for forecast day 5 this error frequency is only 35%.
Table 1. Number of days in 2006, when the INCA model would be right/wrong with respect to predicting a dusty situation with levels above 0.5 AOD near Dakar. The error counts are based on the comparison of the daily Aeronet and INCA modelled AOD levels. Three time steps of the forecast model run and the reanalysis run are shown. Days with no information from Aeronet or from the forecast model are omitted.
# J0 J2 J5 ReAnalysis
missing « warning » 43 47 52 40
correct « no warning » 118 116 114 124
correct « warning » 36 32 27 39
« warning » false 21 23 25 15
WMO/GEO Expert Meeting on an International Sand and Dust Storm Warning System IOP Publishing IOP Conf. Series: Earth and Environmental Science 7 (2009) 012014 doi:10.1088/1755-1307/7/1/012014
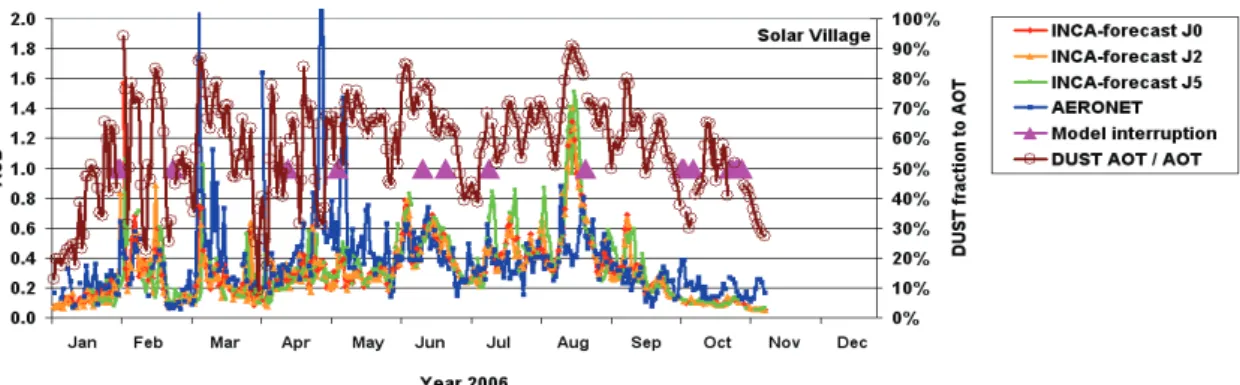
A second time series comparison is shown in Figure 3. From the model we can retrieve the contribution of dust to total AOD. It can be seen that for both the dusty cases and the mixed dust/pollution cases model data correlation in daily AOD evolution can be found.
Figure 3. Aeronet sun photometer measurements of aerosol optical depth (AOD) at Solar Village in Saudi Arabia as compared to day zero (J0) day two and five (J2,J5) of all daily INCA forecast simulations performed in the year 2006. Pink triangles indicate times when model operation was discontinued. The contribution of dust AOD to total AOD from the model is shown as brownish curve.
4. Conclusions
The forecast simulation is a relative harsh test of modeling capabilities, since the wind fields, the initialization and the dust aerosol source formulation undergo no further checking. Despite this the INCA model shows significant capacity in predicting dust events in West Africa.
The comparison of the monthly versus the daily model/data correlation and the deterioration of the forecast with time can be explained by the models failure to simulate some aspects of the transport and thus the exact timing of a dust event.
The model agreement with observed AOD at dusty sites as a function of forecast time and on different temporal scales, hit rates and an error analysis with respect to threshold dust loads is suggested to be one criterion for evaluating the quality of the transport of dust in a given model.
Acknowledgments
Of great benefit have been the Aeronet/Photons data of sun photometers provided through the Aeronet web site, namely Brent Holben and Didier Tanre. The operational forecast model version is based on tools developed at the LMD, thanks to Frederic Hourdin. Support by the supercomputing facilities of the CEA and the IT department at the LSCE, Francois Marabelle, is acknowledged. Financial support has been received through the EU funded GEMS project.
References
[1] Hauglustaine, D.A., F. Hourdin, L. Jourdain, M.-A. Filiberti, S. Walters, J.-F. Lamarque, and E.A. Holland, 2004 Interactive chemistry in the Laboratoire de Météorologie Dynamique general circulation model : Description and background tropospheric chemistry evaluation,
Journal of Geophysical Research, 109 (D04314, doi:10.1029/2003JD003957)
[2] Textor, C., M. Schulz, S. Guibert, S. Kinne, Y. Balkanski, S. Bauer, T. Berntsen, T. Berglen, O. Boucher, M. Chin, F. Dentener, T. Diehl, R. Easter, H. Feichter, D. Fillmore, S. Ghan, P. Ginoux, S. Gong, A. Grini, J. Hendricks, L. Horowitz, P. Huang, I. Isaksen, T. Iversen, S. Kloster, D. Koch, A. Kirkevåg, J.E. Kristjansson, M. Krol, A. Lauer, J.F. Lamarque, X. Liu, V. Montanaro, G. Myhre, J. Penner, G. Pitari, S. Reddy, Ø. Seland, P. Stier, T. Takemura, and X. Tie, 2006 Analysis and quantification of the diversities of aerosol life cycles within AeroCom, Atmos. Chem. Phys., 6, 1777-1813.
WMO/GEO Expert Meeting on an International Sand and Dust Storm Warning System IOP Publishing IOP Conf. Series: Earth and Environmental Science 7 (2009) 012014 doi:10.1088/1755-1307/7/1/012014
[3] Balkanski, Y., M. Schulz, T. Claquin, C. Moulin, and P. Ginoux, 2004 Global emissions of mineral aerosol: formulation and validation using satellite imagery, in Emission of
Atmospheric Trace Compounds, edited by C. Granier, P. Artaxo, and C.E. Reeves, pp.
239-267, Kluwer, 2004.
[4] Claquin, T., 1999 Modelisation de la minéralogie et du forcage radiatif des poussières désertiques, PhD thesis, Université Paris VI, France, Paris.
[5] Shao, Y., M. Raupach, and J. Leys, 1996 A model for predicting aeolian sand drift and dust entrainment on scales from paddock to region, Australian Journal of Soil Research, 34 (3), 309 - 342.
[6] Fecan, F., B. Marticorena, and G. Bergametti, Parametrization of the increase of the aeolian erosion threshold wind friction velocity due to soil moisture for arid and semi-arid areas,
Annales Geophysicae-Atmospheres Hydrospheres and Space Sciences, 17 (1), 149-157.
[7] Marticorena, B., and G. Bergametti, 1995 Modeling the atmospheric dust cycle: 1. Design of a soil-derived dust emission scheme, J. Geophys. Res., 100, 16415-16430.
[8] FAO, 1995 Digital soil map of the world, Food and agriculture organization of the United Nations (FAO).
[9] Zobler, L., 1986 A world soil file for global climate modeling, pp. 32, NASA, Washington, D.C.
[10] Schulz, M., Y.J. Balkanski, W. Guelle, and F. Dulac, 1998 Role of aerosol size distribution and source location in a three-dimensional simulation of a Saharan dust episode tested against satellite-derived optical thickness, Journal of Geophysical Research-Atmospheres, 103 (D9), 10579-10592.
WMO/GEO Expert Meeting on an International Sand and Dust Storm Warning System IOP Publishing IOP Conf. Series: Earth and Environmental Science 7 (2009) 012014 doi:10.1088/1755-1307/7/1/012014