HAL Id: hal-00300919
https://hal.archives-ouvertes.fr/hal-00300919
Submitted on 15 Oct 2002HAL is a multi-disciplinary open access
archive for the deposit and dissemination of sci-entific research documents, whether they are pub-lished or not. The documents may come from teaching and research institutions in France or abroad, or from public or private research centers.
L’archive ouverte pluridisciplinaire HAL, est destinée au dépôt et à la diffusion de documents scientifiques de niveau recherche, publiés ou non, émanant des établissements d’enseignement et de recherche français ou étrangers, des laboratoires publics ou privés.
Global chemical weather forecasts for field campaign
planning: predictions and observations of large-scale
features during MINOS, CONTRACE, and INDOEX
M. G. Lawrence, P. J. Rasch, R. von Kuhlmann, J. Williams, H. Fischer, M.
de Reus, J. Lelieveld, P. J. Crutzen, M. Schultz, P. Stier, et al.
To cite this version:
M. G. Lawrence, P. J. Rasch, R. von Kuhlmann, J. Williams, H. Fischer, et al.. Global chemical weather forecasts for field campaign planning: predictions and observations of large-scale features during MINOS, CONTRACE, and INDOEX. Atmospheric Chemistry and Physics Discussions, Euro-pean Geosciences Union, 2002, 2 (5), pp.1545-1597. �hal-00300919�
ACPD
2, 1545–1597, 2002 Global chemical weather forecast system M. G. Lawrence et al. Title Page Abstract Introduction Conclusions References Tables Figures J I J I Back Close Full Screen / EscPrint Version Interactive Discussion
c
EGU 2002 Atmos. Chem. Phys. Discuss., 2, 1545–1597, 2002
www.atmos-chem-phys.org/acpd/2/1545/ c
European Geosciences Union 2002
Atmospheric Chemistry and Physics Discussions
Global chemical weather forecasts for
field campaign planning: predictions and
observations of large-scale features
during MINOS, CONTRACE, and INDOEX
M. G. Lawrence1, P. J. Rasch2, R. von Kuhlmann1, J. Williams1, H. Fischer1, M. de Reus1, J. Lelieveld1, P. J. Crutzen1, M. Schultz3, P. Stier3, H. Huntrieser4, J. Heland4, A. Stohl5, C. Forster5, H. Elbern6, H. Jakobs6, and R. R. Dickerson7
1
Max-Planck-Institut f ¨ur Chemie, Postfach 3060, 55020 Mainz, Germany
2
National Center for Atmospheric Research, Boulder, Colorado, USA
3
Max-Planck-Institut f ¨ur Meteorologie, Hamburg, Germany
4
Institut f ¨ur Physik der Atmosph ¨are, Deutsches Zentrum f ¨ur Luft- und Raumfahrt, Oberpfaffenhofen, Germany
5
Technische Universit ¨at M ¨unchen, M ¨unchen, Germany
6
Institut f ¨ur Geophysik und Meteorologie, Universit ¨at zu K ¨oln, K ¨oln, Germany
7
Department of Meteorology, University of Maryland, College Park, Maryland, USA Received: 26 July 2002 – Accepted: 11 October 2002 – Published: 15 October 2002 Correspondence to: M. G. Lawrence ([email protected])
ACPD
2, 1545–1597, 2002 Global chemical weather forecast system M. G. Lawrence et al. Title Page Abstract Introduction Conclusions References Tables Figures J I J I Back Close Full Screen / EscPrint Version Interactive Discussion
c
EGU 2002
Abstract
The first global tropospheric forecasts of O3and its precursors have been used in the daily flight planning of field measurement campaigns. The 3-D chemistry-transport model MATCH-MPIC is driven by meteorological data from a weather center (NCEP) to produce daily 3-day forecasts of the global distributions of O3 and related gases,
5
as well as regional CO tracers. This paper describes the forecast system and its use in three field campaigns, MINOS, CONTRACE and INDOEX. An overview is given of the forecasts by MATCH-MPIC and by three other chemical weather forecast mod-els (EURAD, ECHAM, and FLEXPART), focusing on O3 and CO. Total CO and re-gional CO tracers were found to be the most valuable gases for flight planning, due to
10
their relatively well-defined anthropogenic source regions and lifetimes of one to a few months. CO was in good agreement with the observations on nearly all the flights (gen-erally r > 0.7, RMS < 20%). In every case in which the chemical weather forecasts were primarily responsible for the flight plans, the targeted features were observed. Two forecasted phenomena are discussed in detail: outflow from Asia observed in the
15
Mediterranean upper troposphere during MINOS, and outflow from North America ob-served in the middle troposphere over northern Europe during CONTRACE. It is shown that although such pollution plumes occur repeatedly during the months around the campaigns, their frequency is sufficiently low (∼10–30% of the time) that global chem-ical weather forecasts are important for enabling them to be observed during
limited-20
duration field campaigns. The MATCH-MPIC chemical weather forecasts, including an interface for making customized figures from the output, are available for community use viahttp://www.mpch-mainz.mpg.de/˜lawrence/forecasts.html.
1. Introduction
Field campaigns are an essential component in the study of physical and chemical
25
ACPD
2, 1545–1597, 2002 Global chemical weather forecast system M. G. Lawrence et al. Title Page Abstract Introduction Conclusions References Tables Figures J I J I Back Close Full Screen / EscPrint Version Interactive Discussion
c
EGU 2002 meteorological variability results in variations in the distributions of gases and aerosols,
careful planning is required in order to maximize the use of available resources to attain campaign objectives. While numerical weather prediction models and trajectory mod-els have a long history of being used in campaign flight planning, chemistry-transport models (CTMs) have only recently begun to be employed for this purpose. CTMs
5
provide direct information on the expected state of atmospheric trace constituents on timescales of hours to days – the “chemical weather” – which depends on the inte-grated effects of meteorology, sources, photochemical reactions, aerosol nucleation and growth, and loss processes which an airmass undergoes prior to when it is sam-pled. In combination with information on the regional “chemical climate” – seasonal
10
statistics of trace gas and aerosol distributions based on multi-year historical CTM or coupled chemistry-climate model runs – forecasts of the chemical weather will likely become the primary tool for the daily planning of future atmospheric chemistry field campaigns.
Chemical weather forecasting for the stratosphere was first done for the ASHOE and
15
SESAME campaigns (1994–95), during whichLee et al.(1997) used two global strato-spheric CTMs (TOMCAT and SLIMCAT) to compute the anticipated levels of O3 and other constituents of the arctic polar vortex starting two weeks prior to each deploy-ment. The first regional tropospheric chemistry forecasts were provided for the 1997 POLINAT campaign using the NILU chemistry-transport model (Flatoy et al.,2000).
20
Global tropospheric O3-chemistry forecasts were computed for the first time during the 1999 Indian Ocean Experiment (INDOEX) with a prototype of the MATCH-MPIC system described here. Following that, global CO-tracer forecasts were computed dur-ing TRACE-P (April 2000) by both the ECHAM GCM (described in the Appendix) and the Harvard GEOS-CHEM CTM (http://www-as.harvard.edu/chemistry/trop/ 25
geos/geos_traps.html), and chemical weather forecasts were also provided by a variety of regional models. An updated MATCH-MPIC forecast system was employed during MINOS (the Mediterranean Intensive Oxidants Study, July–August 2001), along with the ECHAM CO-tracer forecasts, and again during CONTRACE (Convective
Trans-ACPD
2, 1545–1597, 2002 Global chemical weather forecast system M. G. Lawrence et al. Title Page Abstract Introduction Conclusions References Tables Figures J I J I Back Close Full Screen / EscPrint Version Interactive Discussion
c
EGU 2002 port of Trace Gases into the Upper Troposphere over Europe, November 2001), in
addi-tion to global CO-tracer forecasts computed using the FLEXPART model, and regional chemical weather forecasts using the EURAD model (both described in the Appendix). A different version of MATCH is also being used to compute global aerosol forecasts, which have been employed primarily during INDOEX and ACE-Asia; the aerosol
fore-5
casts profit from the assimilation of satellite measurements of aerosol optical depth, and are described elsewhere (Collins et al.,2001;Rasch et al.,2001).
The use of chemical weather forecasts in field campaigns is expanding rapidly. For instance, new forecast systems with regional CO tracers using the GEOS-CHEM (Har-vard) model and with gas phase O3-related chemistry using MOZART
10
(NCAR/Hamburg/GFDL) and CHASER (University of Tokyo) were set up for use dur-ing ITCT 2k2 and PEACE-B (April–May 2002, seehttp://www.al.noaa.gov/WWWHD/
pubdocs/ITCT/2k2 and http://www.eorc.nasda.go.jp/AtmChem/GLACE/PEACE/
htdocs/pcb.html). These campaigns also employed the global MATCH-MPIC and FLEXPART forecasts, the global aerosol forecasts by MATCH (NCAR), and various
15
regional chemical weather forecast products. Recent developments in stratospheric chemical weather forecasting include the assimilation of global O3columns from satel-lite observations (Eskes et al., 2002). Several regional chemical weather forecast systems have been set up at national weather centers. Extreme advances in res-olution may also soon be possible; recently, forecasts with a cloud resolving model
20
(∆X ≈ 1 km) have been used in a field campaign focused on convective activity (Benoit et al.,2002). International activities are being planned for the near future to develop elaborate global and nested-regional chemical weather forecast systems.
In light of this extensive effort, it is important to assess the quality and value of chemical weather forecasts in past field campaigns, and to consider where the most
25
effort should be focused in the near future. Here we discuss the use of the MATCH-MPIC chemical weather forecast system during MINOS, CONTRACE and INDOEX. Following a description of the model and the forecast system setup in the next section, we give a brief overview of the chemical weather forecasts and their use during the
ACPD
2, 1545–1597, 2002 Global chemical weather forecast system M. G. Lawrence et al. Title Page Abstract Introduction Conclusions References Tables Figures J I J I Back Close Full Screen / EscPrint Version Interactive Discussion
c
EGU 2002 three campaigns, focusing on O3 and CO. The model results are compared with the
observations, documenting for the first time that a tropospheric CTM such as MATCH-MPIC is capable of successfully forecasting several different types of pollution outflow. We then examine two forecasted phenomena in detail: the Asian monsoon plume over the Mediterranean (MINOS), and North American outflow observed over Europe
5
(CONTRACE). We conclude with our perspectives on future developments in chemical weather forecasting.
2. Forecast model system setup
The chemical weather forecast system uses the Model of Atmospheric Transport and Chemistry, Max-Planck-Institute for Chemistry version 3.0 (hereafter MATCH-MPIC),
10
described and evaluated inRasch et al.(1997),Mahowald et al.(1997b,a),Lawrence et al. (1999), and von Kuhlmann (2001). A description of the model is given in the Appendix. In addition to the extensive non-methane hydrocarbon (NMHC) oxidation mechanism described invon Kuhlmann(2001), the forecast runs include regional CO tracers. These have the same emissions as the normal CO over a chosen region (e.g.
15
Europe), and are subjected to the model transport algorithms and the same losses as normal CO (note that dry deposition of the CO tracers was not included during MINOS and CONTRACE, but has since been incorporated). A list of the CO tracers and their bounding regions is given in Table1.
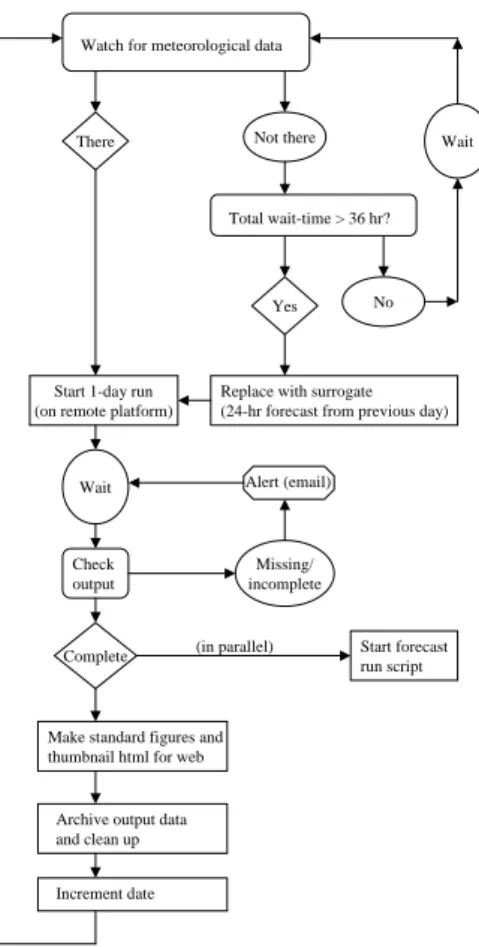
The basic procedure for producing the daily forecasts is outlined in Fig. 1. Each
20
day’s run is fully automated and consists of two parts, a “near-real-time” (hereafter “NRT”) run and a forecast run. The NRT run employs the NCEP analysis data to run forward one day at a time as soon as the previous day’s data are available. The forecast runs use the NCEP forecast data in place of the NCEP analysis. The NCEP data are made available daily via the internet (http://www.nco.ncep.noaa.gov/
25
pmb/products/avn). These data are retrieved at NCAR (Boulder) and interpolated
ACPD
2, 1545–1597, 2002 Global chemical weather forecast system M. G. Lawrence et al. Title Page Abstract Introduction Conclusions References Tables Figures J I J I Back Close Full Screen / EscPrint Version Interactive Discussion
c
EGU 2002 data used for the runs in Mainz (currently T42, 64 × 128 grid points, or about 2.8◦in the
horizontal, and 42 levels in the vertical up to about 2 hPa).
Once the data is transferred to Mainz, the daily NRT run starts up using the model restart file from the previous day and runs forward one day. If there is a delay in the data delivery, the NCEP forecast data from the previous day is used as a surrogate
5
for the NCEP analysis. This prevents the forecast system from falling too far behind or stopping during active campaigns. In 2001, surrogates were used about 10% of the time, in the first half of 2002 this was reduced to about 5% of the time.
After the NRT run for a day is finished, pre-selected figures are made and placed in the internet, the 3-hourly output data from MATCH-MPIC is archived, and the date
10
is incremented to the next day. The archived output data is then available for making custom figures via the web interface. In parallel, the forecast run for the day is initial-ized using the restart file from the end of the day’s NRT run, and steps forward like the analysis run procedure in Fig.1. The automated runs and plots are normally done by about 06:00 UTC the next day, so that the 1-day forecast (which is actually for the
cur-15
rent day) is available in time for daily flight briefings. In the discussion below we focus on the 2-day (48-hour) forecast fields; these are available about one day in advance after the computational lag time, and were generally the most critical for making the flight plans.
The present forecast system started with a prototype run at T21 resolution on 1 May
20
2001, with the tracer distributions initialized to the average for May 1998 from the base run invon Kuhlmann (2001). On 1 June 2001, the forecast system was switched to T42 and has provided routine daily forecasts since. The model was thus given about three months to spin up before being used in the MINOS campaign (August 2001), and six months prior to CONTRACE (November 2001).
ACPD
2, 1545–1597, 2002 Global chemical weather forecast system M. G. Lawrence et al. Title Page Abstract Introduction Conclusions References Tables Figures J I J I Back Close Full Screen / EscPrint Version Interactive Discussion
c
EGU 2002
3. Forecasts and observations during INDOEX, MINOS, and CONTRACE
3.1. Field campaign descriptions and measurement techniques
This section briefly describes the three field campaigns, the measurements techniques employed, and the chemical weather forecasts used in each campaign (meteorological forecasts were available for all campaigns, along with forward and backward
trajecto-5
ries).
INDOEX (http://www-indoex.ucsd.edu) took place in the Indian Ocean region during January–April 1999. The major objectives were to assess the degree of chem-ical pollution and its dispersion over the region, and to examine the role of continental aerosols in the regional radiative forcing (Crutzen and Ramanathan, 2001). Several
10
observation platforms were involved, including two aircraft, two ships, several ground stations and satellites. The MATCH-MPIC chemical weather forecasts were used in planning several flights of the Dutch Cessna Citation (de Gouw et al.,2001), based out of Mal ´e (4◦N, capital of the Maldives). These forecasts were computed using an earlier version of MATCH-MPIC (v2.0, described inLawrence et al.,1999), also used for
IN-15
DOEX inLal and Lawrence(2001), which differed from the current version mainly in its use of a simplified chemistry scheme which neglected NMHCs. This allowed a higher horizontal resolution (T62, about 1.9◦) than the current system. The INDOEX forecasts were only computed from mid-February until the end of March 1999, with only a one-week spin-up period possible after initializing from the mean trace gas distributions
20
computed for February 1993 (fromLawrence et al.,1999).
MINOS (http://www.mpch-mainz.mpg.de/˜reus/minos) was conducted dur-ing July and August 2001, in the eastern Mediterranean Sea. 14 research flights were made with the DLR Falcon based out of Heraklion, Crete. The objectives of MINOS include examining: (1) the transport of pollution to the Mediterranean region from
Eu-25
rope and from remote sources, especially Asia; (2) the chemical mechanisms involved in the build-up of oxidants and aerosols in the region; and (3) the export of pollutants to the global environment, e.g. towards Asia. Two chemical weather forecast systems
ACPD
2, 1545–1597, 2002 Global chemical weather forecast system M. G. Lawrence et al. Title Page Abstract Introduction Conclusions References Tables Figures J I J I Back Close Full Screen / EscPrint Version Interactive Discussion
c
EGU 2002 were employed: (1) MATCH-MPIC and (2) regional CO tracers computed using the
ECHAM5 GCM (see Appendix).
The CONTRACE program (http://www.pa.op.dlr.de/contrace) focuses on the processes which control the transport of trace gases, especially NOx, to the free tro-posphere (FT) over Europe. The first field campaign (CONTRACE 1, hereafter simply
5
CONTRACE) was in November 2001, and focused on frontal uplifting, including trans-port of pollutants from North America to Europe (Stohl,2001). A second, planned for summer 2003, will focus on transport and scavenging by deep convection. Four flights (three of them two-part) with the DLR Falcon were conducted during CONTRACE, based out of Oberpfaffenhofen (near Munich, Germany). Three separate chemical
10
weather forecasts were used in the flight planning: (1) the MATCH-MPIC forecasts, (2) CO tracer forecasts based on the FLEXPART Lagrangian particle dispersion model, and (3) regional O3-chemistry forecasts using the EURAD model (see the Appendix for FLEXPART and EURAD setups).
The measurements techniques used during these campaigns are described in
Ta-15
ble2. Only CO and O3are considered here. During INDOEX there were no other gases that were measured on the aircraft which were also included in the model (except NO, which was generally below the detection limit of the instrument). The data on other gases observed during MINOS and CONTRACE and their comparison with the model output are still under evaluation, and will be discussed in several other manuscripts
20
in preparation. Generally the comparison with CO is good, while O3 and other gases often show the same types of problems as seen in evaluations of the chemical climate as simulated by global models (e.g.Emmons et al.,1997;Hauglustaine et al.,1998; Lawrence et al.,1999;Thakur et al.,1999).
3.2. Overview of the forecast applications during the three field campaigns
25
A summary of the flights for which the MATCH-MPIC forecasts played a primary role in determining the flight plans is given in Table 3, along with the correlation coe ffi-cients, RMS errors, and ratios between the mean modeled and observed CO mixing
ACPD
2, 1545–1597, 2002 Global chemical weather forecast system M. G. Lawrence et al. Title Page Abstract Introduction Conclusions References Tables Figures J I J I Back Close Full Screen / EscPrint Version Interactive Discussion
c
EGU 2002 ratios. In every case the main predicted features in the trace gas distributions were
observed. Not only were the forecasts successful in this overall sense, but they were also generally well-correlated with the observations on a flight-by-flight basis, with cor-relation coefficients (r) for CO nearly always above 0.7, and reaching as high as 0.96. The RMS differences indicate that the variations (departures from the mean) in the
5
modeled values were generally within 10–20% of the observed spatial and temporal variations. There is only a slight degradation in the correlations and RMS differences for the 2-day forecasts compared to the NRT run. MATCH-MPIC tended to underes-timate the mean CO levels by about 25% during INDOEX and overesunderes-timate by about 30% during CONTRACE, whereas it is in close agreement with the MINOS data. The
10
reasons for these regional offsets are still unclear. They are likely due to errors in the emissions inventories, though this is difficult to determine definitively, since they are within the range of uncertainty in current emissions inventories. For the sake of flight planning, however, the reproduction of spatial and temporal variations (i.e. the correla-tion) is more important than prediction of absolute values. Note that the comparisons
15
of MATCH-MPIC output with the observations were done by making “virtual flights” through the model output, interpolating it in 4-D space/time to the position of the air-craft during the flights. This places a greater demand on the model than the alternative of averaging the observations onto the model domain.
The rest of this section gives a brief description of the overall forecast applications
20
during the three campaigns, based on Table3. A detailed description of the forecasts on a flight-by-flight basis, including the original forecast figures and comparisons to the observations for most of the flights, is available viahttp://www.mpch-mainz.mpg.
de/˜lawrence/forecasts/flight_by_flight_imc/. The targeted features of
the flights based on the chemical weather forecasts can be broken down into three
25
basic types:
1. separation of the chemical northern and southern hemispheres by the intertropi-cal convergence zone (INDOEX only),
ACPD
2, 1545–1597, 2002 Global chemical weather forecast system M. G. Lawrence et al. Title Page Abstract Introduction Conclusions References Tables Figures J I J I Back Close Full Screen / EscPrint Version Interactive Discussion
c
EGU 2002 2. boundary layer and lower tropospheric outflow of pollution from nearby populated
regions (all three campaigns), and
3. intercontinental pollution plumes (MINOS and CONTRACE only).
The first application of the MATCH-MPIC forecasts showed that the global model is able to accurately predict the sharp gradient in trace gas mixing ratios to the north
5
and south of the intertropical convergence zone (ITCZ) and its varaible location in the Indian Ocean (despite the relatively short spin-up time). During INDOEX, the ITCZ was difficult to reach with the Cessna Citation due to its flight range (∼ 1000 km one way). The MATCH-MPIC trace gas forecasts were used to predict when the chemical ITCZ would be far enough north for the Citation to reach it, resulting in a multi-leg flight
10
which was successful in sampling southern hemispheric air; very low mixing ratios of O3(∼ 10 nmol/mol) and CO (∼ 50 nmol/mol) were observed and modeled near the sur-face in the southernmost profiles. A detailed analysis of the flight is given byWilliams et al. (2002). The ITCZ was also encountered twice by the research vessel Ronald H. Brown, once at 2◦S (27 February) and once at 11◦S (19 March). In both cases
15
the model reproduced the abrupt changes in CO and O3 well, and overall the corre-lation coefficients between the model output and the observations on the Ron Brown were high: 0.91 (O3) and 0.86 (CO) for the NRT run, and 0.90 (O3) and 0.85 (CO) for the 2-day forecasts. The second encounter with the Ron Brown was an important application of the MATCH-MPIC forecasts; the ITCZ was barely encountered at the
20
farthest extent of a southbound leg, after the chemical weather forecasts alerted the ship crew to the need to travel farther south than originally expected (∼ 6◦S) based on the meteorological forecasts.
The flights of the second type, observing near-surface pollution outflow, showed that while global chemical weather forecasts are able to predict the general regions where
25
enhanced mixing ratios should be seen on a day-to-day basis, such flights would bene-fit from higher resolution or from regional model forecasts. The plans for this flight type were in principle similar for INDOEX and MINOS, since both campaigns were based
ACPD
2, 1545–1597, 2002 Global chemical weather forecast system M. G. Lawrence et al. Title Page Abstract Introduction Conclusions References Tables Figures J I J I Back Close Full Screen / EscPrint Version Interactive Discussion
c
EGU 2002 on islands in the outflow of major population centers. Both aimed for regions where
the outflow was predicted to produce a considerable enhancement in the levels of key trace gases (e.g. CO) above the background values. Two such flights during INDOEX and four during MINOS were carried out based on the chemical weather forecasts. On all the flights, the pollutant outflow gradients were observed in the regions where
5
they were predicted. However, especially during MINOS some of the smaller scale details were missed in the forecasts. For instance, the flight on 19 August targeted a large-scale gradient towards higher CO levels in the east, based on the MATCH-MPIC forecasts. This overall gradient was observed, but a thin plume (∼ 1.1◦ width in longi-tude) of enhanced CO was also observed in the BL, which neither MATCH-MPIC nor
10
ECHAM was able to resolve (the horizontal resolution of both models was T42, ∼ 2.8◦). In this case, a higher resolution regional model may have been able to simulate this feature better.
The advantages of a higher resolution regional model were also seen during the 14 November CONTRACE flights, which targeted European pollution lofted to the FT
15
near a trough in the western Mediterranean. All three chemical weather forecasts (MATCH-MPIC, FLEXPART, and EURAD) predicted enhanced trace gas mixing ratios up to 500 hPa in the region. However, only the regional model (EURAD) was able to predict strong enhancements in CO observed at 4–7 km along the flight path, due to outflow from local convection; both MATCH-MPIC and FLEXPART misplaced the
con-20
vection too far to the west of Corsica. The degree to which higher resolution regional models can consistently provide better forecasts of local convection effects than global models will be important to assess as more data becomes available for future forecast evaluations (e.g. for ITCT 2k2).
Global chemical weather forecasts, on the other hand, have the advantage of being
25
able to predict intercontinental plume transport (supporting the third type of flights), which is generally not possible with regional models. During MINOS the summer mon-soon outflow from southern Asia was observed on three flights based on the MATCH-MPIC and ECHAM forecasts. Two plumes from North America were observed during
ACPD
2, 1545–1597, 2002 Global chemical weather forecast system M. G. Lawrence et al. Title Page Abstract Introduction Conclusions References Tables Figures J I J I Back Close Full Screen / EscPrint Version Interactive Discussion
c
EGU 2002 CONTRACE with support from the MATCH-MPIC and FLEXPART forecasts. These
plumes and the model results are discussed in detail in the following two sections. 3.3. The Asian monsoon plume during MINOS
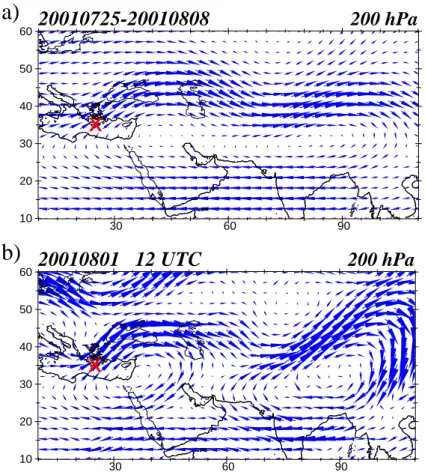
Every year during the summer monsoon period in Asia, deep convection lofts insoluble and moderately soluble pollutants from populated regions of southern Asia (especially
5
India) into the UT. These UT outflow plumes are then frequently carried towards Africa by the tropical easterly jet on the southern side of the distinct Tibetan anticyclone (Fig.2), then northwards over the Mediterranean at the western edge of an anticyclone over northern Arabia which is part of the Walker circulation in this region (Das,1992). The locations of the Tibetan and Arabian UT anticyclones depicted in Fig.2b vary, so
10
that in the mean they form a large anticyclone covering the region from Tibet to the eastern Mediterranean (Fig. 2a). An example of the three-dimensional structure of the outflow plume resulting from this circulation is shown in Fig.3; the plume is often present as an elongated, contiguous region of enhanced CO levels, mainly between 400–150 hPa.
15
The separation of the plume into the southern Asian and northern Asian CO tracers in MATCH-MPIC at 200 hPa is shown in Fig.4(see the supplementary material for an animation of this figure). In the MATCH-MPIC forecast runs, the northern Asian CO tracer was defined as two rectangles so that it included all of China (Table 1). This results in the northern Asian tracer being split into two outflow regions in the upper
20
troposphere: to the east, Chinese emissions are transported to the UT by deep con-vection over the Pacific warm pool, and then carried in westerlies which are sufficiently strong to circle the globe and influence the UT CO levels over continental Europe; con-vection over southern China feeds the easterlies of the Tibetan anticyclone, so that the northern Asian CO merges with the southern Asian CO plume over the Bay of Bengal
25
and India. In our analysis of the southern Asian plume during MINOS with MATCH-MPIC, we have found that in most cases the northern Asian and southern Asian CO tracers contribute roughly equal amounts to the total CO. Since the partitioning into
ACPD
2, 1545–1597, 2002 Global chemical weather forecast system M. G. Lawrence et al. Title Page Abstract Introduction Conclusions References Tables Figures J I J I Back Close Full Screen / EscPrint Version Interactive Discussion
c
EGU 2002 northern and southern tracers is rather arbitrary, in the analysis of the forecast model
results below only the sum of the two Asian tracers will be examined.
Based on analyses of multi-year wind fields, trajectories, and tracer simulations, it was hypothesized that the southern Asian monsoon outflow could be observed over the eastern Mediterranean; this was one of the objectives of MINOS. The chemical nature
5
of the plume is being analyzed byScheeren et al.(2002). Here we concentrate on the plume’s spatial distribution, the comparison of model output with the observations, and the frequency of strong plume events in the region.
Figure5shows a six year climatology of the UT distribution of a CO-like tracer from India which was used in planning MINOS, based on a high resolution (T63) run done
10
prior to MINOS with an earlier version of MATCH-MPIC (in that run, only a southern Asian component was included). The outflow to the west is directed mostly towards Arabia and northeast Africa; there is also a considerable dispersion of the plume to the east. In most years the monthly average extent of the plume just barely reaches Crete, due to the northern Arabian UT anticyclone (Fig.2) which brings airmasses northwards
15
from Africa to the eastern Mediterranean, with the furthest northwest extent of the trajectories being close to Crete. There is, however, a significant interannual variability, with the average plume extending well past Crete in 1998. There is also a large day-to-day variability in the plume’s location and its CO mixing ratios (see the animation of Fig. 4 in the supplementary material). Such plumes would be difficult to predict
20
with standard meteorological fields or forward trajectories, since the plume depends on the integrated effects of: the strength of convection over Asia 5–7 days back, the strength and location of the Tibetan and northern Arabian anticyclones, the transport times (aging of the plume), and dilution due to mixing with other UT air masses. Thus, the chemical weather forecasts during MINOS were central to achieving the objective
25
of observing the plume.
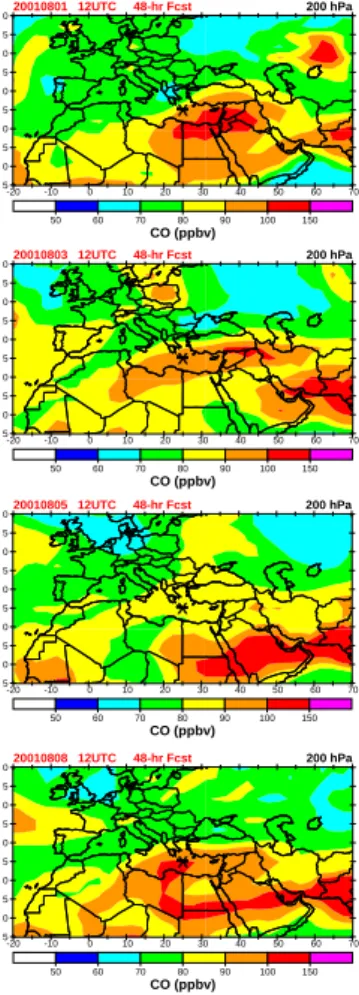
Three flights to examine the plume were conducted on 1, 3, and 8 August 2001. The first and third flights were conducted to the east of Crete, while the second was to the north (Fig.6). Selected MATCH-MPIC forecast figures which were used in planning
ACPD
2, 1545–1597, 2002 Global chemical weather forecast system M. G. Lawrence et al. Title Page Abstract Introduction Conclusions References Tables Figures J I J I Back Close Full Screen / EscPrint Version Interactive Discussion
c
EGU 2002 these flights are shown in Fig.7. The forecasts indicate a region of measurable
en-hancements (∼ 20 nmol/mol over the background) to the south and east of Crete on 1 August, which advanced to the north on 3 August. By 5 August, the strong plume had passed by, but the next one reached Crete prior to the third flight on 8 August. The Asian CO tracers (see Fig.4for an example) showed similar patterns of enhanced
val-5
ues on the flight days. The ECHAM forecasts were generally in good agreement with MATCH-MPIC; Fig. 8 shows an example for 1 August. The differences are relatively small in light of the different wind fields, emissions, and treatments of CO chemistry (“online” vs. “offline”). The Asian plume forecasts and the overall similarity between the two models resulted in three flights being conducted to intersect the plume.
10
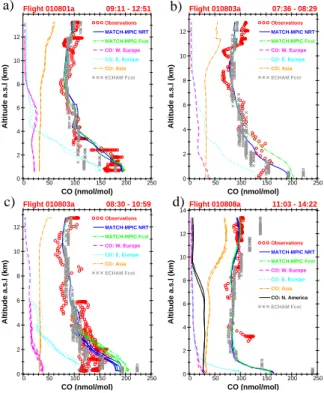
The observed and modeled vertical profiles, shown in Fig. 9, all indicate an en-hancement in UT CO by 30–50 nmol/mol compared to the middle troposphere during each of the flights. The MATCH-MPIC tracers (and the ECHAM tracers, not shown) attribute this to largely being due to Asian emissions. The total CO levels computed by MATCH-MPIC are generally correlated well with the observations for these three
15
flights (Table3). Since most of the variation in CO is due to differences in air mass origins (rather than OH loss, which is too slow to cause significant day-to-day varia-tions), the good correlations support the use of the regional CO tracers to diagnose the Asian origin of the UT layer (and likewise to diagnose the eastern European ori-gin of the near-surface enhancements, and the eastern and western European oriori-gins
20
of the convective outflow near 5 km on 1 and 3 August). The model results tend to bracket the observations in the UT: MATCH-MPIC underestimates the strength of the plume during the first two flights and matches the third flight, while ECHAM agrees well with the first two flights but overestimates the total CO levels in the plume on the third flight. Since, as discussed above, several factors control the amount of Asian
25
CO which reaches the UT near Crete, it is not clear what causes individual over- or underestimates. On the other hand, the overestimate near the surface by both models is more directly attributable to the outflow of eastern European emissions. These are likely overestimated in the runs, since the emissions databases are for 1990, and the
ACPD
2, 1545–1597, 2002 Global chemical weather forecast system M. G. Lawrence et al. Title Page Abstract Introduction Conclusions References Tables Figures J I J I Back Close Full Screen / EscPrint Version Interactive Discussion
c
EGU 2002 CO emissions in this region are expected to have decreased over the last decade due
to the economic restructuring.
North American CO also has a substantial influence in this region up to 8 km accord-ing to MATCH-MPIC (shown for 8 August in Fig.9d, also similar for the earlier flights). The North American CO decreases over the same altitude range as the Asian CO
con-5
tribution is increasing, resulting in roughly constant modeled total CO between 8–9 km. It is remarkable that above about 2 km during the third flight, the total CO is dominated by emissions from outside Europe. During the earlier flights (Fig.9a–c), the European CO emissions contributed substantially up to about 6 km, but above this the CO from other regions again dominated. The extent and implications of this strong influence of
10
intercontinental transport to the Mediterranean region are discussed inLelieveld et al. (2002).
How frequently was this plume present over Crete and the surrounding region during MINOS and the months before and after? Figure10shows the time series of CO and the Asian CO tracers above Crete during July–September 2001, based on the
MATCH-15
MPIC NRT run output (the 2-day forecast time series values are hardly discernible from the NRT run, and are not plotted). We define a “strong plume” in a given model layer as any time the total CO and the Asian CO both exceed the 3-month minimum value in that layer by more than an arbitrary threshold value, COt, where the minimum value is taken to be representative of the background CO levels, and COt is chosen to be between
20
20–30 nmol/mol (representing a clearly discernible signal in the measurements). The presence of a strong plume in the column is then defined as any time this criterion is met at any model level. The periods of a strong plume in the column above Crete (with COt = 25 nmol/mol) are indicated on Fig. 10as regions of gray shading. Using this threshold, a strong plume is present above Crete 23% of the time. Table4 lists
25
the percentages for COt values of 20, 25 and 30 nmol/mol, as well as for the locations 10◦ east, south, and west of Crete. South and east of Crete the strong plumes are more frequent; for COt = 25 nmol/mol, the plume is present over 40% of the time over the three months 10◦east of Crete. To the west of Crete, enhancements of up to
ACPD
2, 1545–1597, 2002 Global chemical weather forecast system M. G. Lawrence et al. Title Page Abstract Introduction Conclusions References Tables Figures J I J I Back Close Full Screen / EscPrint Version Interactive Discussion
c
EGU 2002 20 nmol/mol are still common (25% of the time), but more substantial enhancements of
25–30 nmol/mol are rare.
Focusing specifically on the role of the chemical weather forecasts, a strong plume was present over Crete for much of the period between Julian Day 196 (15 July) and 224 (12 August), confined mostly to the model levels above 300 hPa. The most
per-5
sistent presence of the plume and its greatest vertical extent (down to ∼ 400 hPa) was during the first week of MINOS flights (starting 1 August); the times of the three flights which targeted the plume are also marked on the figure. Following that, the plume only reached Crete once more around day 245 (2 September), after the flight campaign was over, and at a level (150 hPa) which would have been at the ceiling of the DLR
10
Falcon. This emphasizes the important role the chemical weather forecasts had in the successful deployment of the Falcon to observe the plume during the first week of the campaign, prior to the flights focusing primarily on other objectives.
3.4. The North American plume during CONTRACE
Based on a recent analysis of the transport of pollutants from North America to Europe
15
(Stohl,2001) one of the objectives of CONTRACE was to observe the pollution plumes resulting from lifting in frontal disturbances. Two such plumes were observed during CONTRACE, one over southern Scandinavia and Germany, the other over Belgium. This section focuses on the first plume. The origins of both plumes are discussed in Stohl et al.(2002), and a characterization of the chemical nature of the first plume is
20
given by Huntrieser et al. (2002). Here we consider the North American plume from the same perspective as the Asian monsoon plume in the previous section, focusing on the MATCH-MPIC forecasts, the comparison with the observations, and the frequency of such plumes.
The North American plume observed during CONTRACE on 19 November 2001
25
is depicted in Figs. 11 and 12 in terms of the MATCH-MPIC North American CO tracer. The wintertime transatlantic transport of North American pollutants occurs as intermittent air masses lofted by frontal disturbances along the North American east
ACPD
2, 1545–1597, 2002 Global chemical weather forecast system M. G. Lawrence et al. Title Page Abstract Introduction Conclusions References Tables Figures J I J I Back Close Full Screen / EscPrint Version Interactive Discussion
c
EGU 2002 coast, which are then mostly confined to the middle troposphere (MT), between ∼ 500–
800 hPa. The transport routes vary widely from crossing the Atlantic at ∼ 45◦N to first entering European air space over northern Greenland and Scandinavia (see the ani-mation of Fig.12provided in the supplementary material). The plume observed on 19 November was lifted into the MT between Maine and southern Greenland on 16 and
5
17 November. An anticyclone over the north Atlantic pulled the original plume apart into two distinct, polluted airmasses, one which remained over Greenland, and another which was rapidly transported at the northern edge of the anticyclone, reaching Norway in the afternoon on the 18th and Germany by the afternoon of the 19th.
The original forecasts figures from MATCH-MPIC and FLEXPART used to plan the
10
flight on 19 November are shown in Fig.13. There is a very strong resemblance be-tween the forecasts at 500 hPa, despite the widely differing model formulations, which provided a considerable degree of confidence for the flight planning. The MATCH-MPIC CO tracers indicated that about half the CO in this layer came from North America, and the FLEXPART standard forecast figures indicated that the North American plume
15
would also be prevalent at 700 hPa. Based on these forecasts, a flight across southern Scandinavia (Fig.14) was planned for 19 November.
The observed CO levels and the MATCH-MPIC CO and CO tracers are shown in Figs.15and16. The North American plume was flown through 5 times during the two flight legs. The observations show a thin layer of clearly enhanced CO around 2.5–
20
3 km during the first leg (Fig.16b–d), and a second, weaker layer near 4 km. The plume was again observed during the return leg (Fig.16e and f), with the strongest layer at ∼ 4 km and a weak enhancement at 2.5 km during the final descent. These very thin layers are in contrast to the Asian monsoon plume, which extended up to several km in the vertical. MATCH-MPIC (forecasts and NRT run) computed a single layer of North
25
American CO, about 2 km deep and centered around 3–4 km; the absence of the layer is also correctly predicted in the first profile (Fig.16a). Further investigation is needed to determine whether the tendency for MATCH-MPIC to smear out the plumes is due to artificial diffusion resulting from the moderate vertical resolution (∼ 0.6–0.8 km) or
ACPD
2, 1545–1597, 2002 Global chemical weather forecast system M. G. Lawrence et al. Title Page Abstract Introduction Conclusions References Tables Figures J I J I Back Close Full Screen / EscPrint Version Interactive Discussion
c
EGU 2002 whether excessive physical diffusion or other transport errors are the main cause.
It is remarkable that both the observations and the model (NRT run) indicate the presence of a strong plume near Munich in the late afternoon but not in the morning, considering that the ascending and descending profiles passed through 4 km altitude within 100 km (about 1 degree) of each other. According to the MATCH-MPIC
re-5
sults shown earlier in Fig.12c and d, this was due to the rapid transport of the plume southwards during the day. At 600 hPa, between 09:00 and 15:00 UTC the edge of the plume region with significant CO tracer mixing ratios advances from northern Germany to southern Germany, so that the plume was flown over during the steep ascent in the morning, but was intersected during the descent into Oberpfaffenhofen in the
after-10
noon. Notably, the descent into Oberpfaffenhofen was a case in which the forecasts failed to predict the presence of a strong feature – only a weak layer was predicted (Fig.16f) – whereas a strong layer was computed based on the NCEP analysis data (in the NRT run). This is because in the 2-day forecasts the plume lags about 2–3 h be-hind the plume in the NRT run, which was sufficient that only a weak CO enhancement
15
in the layer was computed for the time of the descent (∼ 16:00 UTC). Nevertheless, the accuracy of the plume arrival time near Munich in this instance – even in the 2-day forecasts, made when the plume was still located over Greenland – indicates that global chemical weather forecasts can be used to predict and allow careful, targeted observations to be made of intercontinental transport phenomena.
20
In all 5 instances in which a layer with enhanced CO was observed during a profile on this flight, O3was also observed to be elevated by 5–10 nmol/mol. However, although MATCH-MPIC computed an enhancement in CO each time it was observed, the model only computed a very weak enhancement in O3 (a few nmol/mol) in two of these in-stances, and no enhancement the other three times. This is an indication that the
25
model is underestimating the photochemical O3 production in such pollution plumes, or that the plumes are starting off with too little O3 in the North American BL. In con-trast, during the brief encounter with the North American plume over Belgium during the flight on 27 November, no corresponding O3 enhancement was observed. Thus,
ACPD
2, 1545–1597, 2002 Global chemical weather forecast system M. G. Lawrence et al. Title Page Abstract Introduction Conclusions References Tables Figures J I J I Back Close Full Screen / EscPrint Version Interactive Discussion
c
EGU 2002 it is unknown whether these O3enhancements are normal or an exception during the
first flight. However, the potential implications of this are significant: MATCH-MPIC and possibly other similar models may be underestimating the contribution of North Ameri-can pollution to the O3burden in the free troposphere over Europe in winter. This issue is being examined in more detail byHuntrieser et al.(2002).
5
Very strong North American plumes crossing over Stockholm such as the one ob-served on 19 November are relatively rare. Using the same criterion as defined before to determine the presence of a strong plume in the column (with COt= 25 nmol/mol), only one other such plume was observed during the period of October–December 2001 (Fig.17a). Weaker plumes (with COt = 20 nmol/mol) were more frequent, occurring
10
about 11% of the time (see Table4). Pollution lofted directly from western European surface sources also contributes significantly to the variability at this altitude, as de-picted by the western European CO tracer in the figure. Further to the south strong North American plume events were more common, though still < 20% of the time, even for COt = 20 nmol/mol. At these low frequencies it would have been difficult to plan
15
flights which could successfully intersect these plumes without the availability of global chemical weather forecasts.
4. Conclusions
Chemical weather forecasts made with MATCH-MPIC have been found to be useful in planning flights targeting different types of synoptic scale phenomena, such as
near-20
surface outflow from nearby polluted regions, intercontinental pollution plumes in the MT and UT, and the separation of the chemical NH and SH at the ITCZ. The most valu-able gas used during INDOEX, MINOS, and CONTRACE was CO, along with regional CO tracers, due to their relatively well-defined anthropogenic source regions and life-times of one to a few months. The modeled CO values were in good agreement with
25
the observations made on nearly all of the flights which were based on the forecasts, with r > 0.7 and RMS differences (for departures from the respective means) generally
ACPD
2, 1545–1597, 2002 Global chemical weather forecast system M. G. Lawrence et al. Title Page Abstract Introduction Conclusions References Tables Figures J I J I Back Close Full Screen / EscPrint Version Interactive Discussion
c
EGU 2002 within 10–20% of the observed mean mixing ratios. There is only a slight degradation
in the correlations and RMS differences for the 2-day forecasts compared to the NRT run. This ability to reproduce spatial and temporal variations is critical for flight plan-ning. Furthermore, the modeled mean CO levels were within 25–30% of the observed means, which is within the range of uncertainty in current emissions inventories. The
5
main limitation found was in terms of small-scale features, which can be better repre-sented with regional models. Based on this assessment, we recommend that global and regional (or, where possible, coupled) chemical weather forecasts generally be included as a central component in the daily flight planning of atmospheric chemistry field campaigns.
10
A major advantage of global (versus regional) chemical weather forecasts is the abil-ity to predict intercontinental transport. A detailed analysis was given of the forecasts and observations of pollution transport from Asia and North America over Europe. Both the Asian monsoon plume and the North American outflow are recurrent fea-tures influencing the chemical composition of the MT and UT over Europe. However,
15
the outflow events are intermittent, with the pollution plumes arriving at different geo-graphical locations and altitudes. The Asian monsoon plume was normally limited to being strong only in the eastern Mediterranean, but its altitude varied from covering much of the region above 400 hPa, to being confined to only around 150 hPa. During the 3-month period around MINOS, a strong plume was present above Crete about
20
25% of the time; the only good opportunity to observe the plume was during the first week of MINOS, when three flights were conducted which encountered the anticipated polluted airmasses. The North American plume during CONTRACE was much more intermittent, with strong plumes being present only a small fraction of the time. The North American outflow is generally confined to the MT (between ∼ 500–800 hPa), and
25
is much more common over west-central Europe (Belgium and Germany) than over Scandinavia. In both campaigns, the chemical weather forecasts were crucial to en-abling the plumes to be observed.
ac-ACPD
2, 1545–1597, 2002 Global chemical weather forecast system M. G. Lawrence et al. Title Page Abstract Introduction Conclusions References Tables Figures J I J I Back Close Full Screen / EscPrint Version Interactive Discussion
c
EGU 2002 curately (see Table3) without assimilation of CO observations. This is in contrast to
meteorological weather models, which rapidly diverge from real meteorological condi-tions if key parameters such as temperature, winds and water vapor are not regularly assimilated. The difference is because the distribution and variability of CO depends more strongly on the time-dependent boundary values and simulated transport than on
5
the initial conditions, provided that the model has had a sufficient “spin-up” time (order of the trace gas lifetime, a few months in the case of CO). For example, the fluctua-tions in CO at a remote location depend largely on whether the winds are coming from nearby polluted regions or instead from the “clean sectors,” rather than the exact CO mixing ratios and their histories in each of these regions. Nevertheless, assimilation of
10
CO observations from satellites might help to compensate for errors in the emissions databases or model physics, and provide even more accurate CO forecasts in the near future, while ongoing model development leads to better CO forecasts in the long term. Future developments in chemical weather forecasts will particularly need to focus on going beyond CO and regional CO tracers. We have made use of the O3 forecasts in
15
only a few cases so far, and other gases have mostly given a “second opinion” confirm-ing the CO forecasts. This reflects the general need for further development of global chemistry-transport models. One particular issue which is closely tied to improved chemical weather forecasts is the quality of boundary conditions (emissions and strato-spheric influx) used in the models. Currently emissions datasets are about a decade
20
behind the present (1990 in the EDGAR database used for the forecast runs, 1995 in the most recent release), and normally are only available on a monthly or annual aver-age basis. Diurnal cycles, weekly traffic cycles, and the stochastic nature of forest fires and lightning NOx are only a few of the major challenges. One approach to improving these is assimilating relevant observations, such as satellite fire pixel counts for
com-25
puting surface emissions from biomass burning (e.g.Schultz,2002), and stratospheric O3 amounts for providing more accurate stratosphere-troposphere fluxes (e.g. Eskes et al.,2002). Other important developments are needed in the chemisty and physics algorithms, such as the transport of soluble gases in hydrometeors, which is very
sen-ACPD
2, 1545–1597, 2002 Global chemical weather forecast system M. G. Lawrence et al. Title Page Abstract Introduction Conclusions References Tables Figures J I J I Back Close Full Screen / EscPrint Version Interactive Discussion
c
EGU 2002 sitive to several assumptions which are currently highly uncertain, e.g. retention of
gases in ice (e.g.Lawrence and Crutzen,1998;Crutzen and Lawrence,2000). These basic developments will likely be more important than assimilation of trace gas obser-vations, which are limited by data availability; balloon soundings of O3 (Logan,1999) are too rare (∼ 1/week), too sparse (< 50 globally), and generally require too long for
5
data delivery to be of use, and while new satellite instruments such as SCIAMACHY are promising, it will still be many years before the vertical resolution for trace gases such as O3and NO2improves beyond a couple of layers for the entire troposphere.
In parallel to model development, evaluations of the chemical weather simulated by different models are also a critical future need. Until recently, model evaluations
10
largely focused on the chemical climate. In addition to considering field campaign data, long-term datasets with high temporal resolution will be important for assessing chemical weather forecasts. For instance, with respect to the intercontinental plume transport observed during CONTRACE, a possibility to determine the general degree of accuracy of predictions of the North American outflow would be the use of long-term
15
datasets at free tropospheric monitoring stations in the European mountains.
Finally, the applications of global chemical weather forecast systems beyond field measurement campaign planning will need to be explored. One example is more ac-curate public warnings of summer smog events, and possibly targeted reductions in emissions prior to and during these events. Given the increasing contributions to
re-20
gional pollution from intercontinental transport (e.g.Jaffe et al.,1999;Berntsen et al., 1999;Jacob et al.,1999;Yienger et al.,2000), boundary conditions from global sys-tems will be crucial in improving the accuracy of regional forecasts for this purpose. Furthermore, there are significant potential agricultural applications. For instance, it has recently been documented (Fumagalli et al.,2001) that the susceptibility of some
25
plants to O3 and other gases is reduced when they are under water stress (due to stomatal closure). It is thus possible that crop damage could be mitigated by care-fully controlled irrigation practices based on more accurate future chemical weather forecasts.
ACPD
2, 1545–1597, 2002 Global chemical weather forecast system M. G. Lawrence et al. Title Page Abstract Introduction Conclusions References Tables Figures J I J I Back Close Full Screen / EscPrint Version Interactive Discussion
c
EGU 2002
Acknowledgements. Thanks to all those who have made INDOEX, MINOS, and CONTRACE
possible. Thanks especially to Patrick J ¨ockel for helping keep the system running during the first 2 weeks of MINOS, and to J ¨org Steinkamp for the development of the new interactive web interface and help with 3-D visualizations of the output. Technical assistance from H.-U. Pan with the NCEP data preparation and from Bill Collins, Brian Eaton, Dani Bundy, Steve Williams,
5
Hans-Stefan Bauer and Johann Feichter was appreciated. Valuable comments were provided by T. Kunhikrishnan, Larry Horowitz, and Bert Scheeren. This work was supported by funding from the German Ministry of Education and Research (BMBF), project 07-ATC-02.
Appendix: Model Descriptions
The meteorology component of MATCH simulates advective transport (Rasch and
10
Lawrence, 1998), convection (Zhang and McFarlane, 1995; Hack et al., 1994), ver-tical diffusion (Holtslag and Boville, 1993), cloud fractions (Slingo, 1987), and cloud microphysics (Rasch and Kristj ´ansson,1998). Gridded values for basic meteorological parameters (pressure, temperature, horizontal winds, surface heat fluxes, and surface stresses) are obtained from the National Centers for Environmental Prediction (NCEP)
15
aviation forecasts (Caplan and Pan, 2000). The remaining meteorological properties (e.g. convective cloud transport) are diagnosed online within MATCH. MATCH has a full tropospheric hydrological cycle; the surface source of water vapor is computed from the latent heat flux in the NCEP data, and the moisture transport and precipitation are computed using the algorithms in MATCH. This gives a water vapor distribution which
20
is internally consistent with the model’s meteorology (Rasch et al., 1997; Lawrence et al.,1999).
The tropospheric chemistry module includes isoprene chemistry based on the Mainz Isoprene Mechanism (P ¨oschl et al.,2000), as well as representations of ethane, propane, ethene, propene, and n-butane (von Kuhlmann,2001). Surface sources of NOx, CO,
25
and non-methane hydrocarbons (NMHCs) are based on the EDGAR inventory for in-dustrial emissions (Olivier et al.,1999); biomass burning emissions are from Galanter et al. (2000) and Andreae and Merlet (2001), and soil emissions are from Yienger
ACPD
2, 1545–1597, 2002 Global chemical weather forecast system M. G. Lawrence et al. Title Page Abstract Introduction Conclusions References Tables Figures J I J I Back Close Full Screen / EscPrint Version Interactive Discussion
c
EGU 2002 and Levy (1995). The lightning NOx source distribution is based on the
parameter-ization of Price and Rind (1992, 1994), and aircraft emissions are from Baughcum et al. (1994). The stratospheric influxes of O3 and NOy are computed by the model’s advection scheme, with prescribed stratospheric O3levels from HALOE satellite mea-surements (Russel, 1993, and C. Br ¨uhl and J.-U. Grooss, personal communication,
5
1997) and NOy/O3 ratios based on Murphy et al. (1993). The stratospheric O3 in-flux has been reduced considerably since the very high amounts in earlier versions of the model (seevon Kuhlmann,2001, for details). Reaction rates are from DeMore et al. (1997),Atkinson et al.(1999), andSander et al.(2000), and photolysis rates are computed usingLandgraf and Crutzen(1998). Dry deposition is from Ganzeveld and
10
Lelieveld (1995), and heterogeneous loss of N2O5on aerosols is based on Dentener and Crutzen (1993). Cloud scavenging by precipitation and gravitational settling pro-cesses in non-precipitating clouds are computed based on the modeled precipitation production rates in each grid cell, as described inLawrence and Crutzen (1998) and Crutzen and Lawrence(2000).
15
Detailed descriptions of the model and extensive comparisons of the chemical cli-mate versus observations are given in Lawrence et al. (1999) and von Kuhlmann (2001), and are also available viahttp://www.mpch-mainz.mpg.de/˜kuhlmann. Like most contemporary models, MATCH-MPIC reproduces most of the major ob-served features, such as land-sea gradients and vertical profile structures in the tropics
20
and extratropics, particularly for key gases such as O3, CO, and NOx. However, it also has a number of unexplained discrepancies with the observations which are common in contemporary models, such as the NOx/HNO3ratio (Thakur et al.,1999).
Brief descriptions of ECHAM, FLEXPART, and EURAD are:
1. The forecast runs with ECHAM5 (successor to ECHAM4,Roeckner et al.,1996,
25
1999) were nudged with ECMWF winds, using a horizontal resolution of T42 (2.8× 2.8 deg) and 19 vertical levels. CO was divided into 14 tracers for different regions and emissions sources. The emissions for ECHAM were from the MOZART 2 model (Horowitz et al.,2002), and OH is prescribed as monthly mean fields from
ACPD
2, 1545–1597, 2002 Global chemical weather forecast system M. G. Lawrence et al. Title Page Abstract Introduction Conclusions References Tables Figures J I J I Back Close Full Screen / EscPrint Version Interactive Discussion c EGU 2002 Spivakovsky et al.(2000). http://www.mpimet.mpg.de/˜schultz.martin
2. FLEXPART (Stohl et al.,1998) is a Lagrangian particle dispersion model. It uses the EDGAR industrial CO emissions inventory for the year 1990 (the same as used in MATCH-MPIC). No decay of CO is assumed, and the tracer particles are
5
carried in the simulation until they are 20 days old.
http://www.forst.uni-muenchen.de/EXT/LST/METEO/stohl/flexpart.html
3. EURAD (Jakobs et al.,1995;Memmesheimer et al.,1995) is a regional chemistry-transport model centered over Europe which contains the complex RADM2 chem-ical integration scheme (Stockwell et al.,1990) coupled with aerosol chemistry
10
(Ackermann et al.,1998;Schell et al.,2001) and with a detailed emissions database for Europe, and uses the meteorology from forecasts with the MM5 mesoscale model, initialized with NCEP AVN wind fields, to drive the transport of trace gases.
http://www.eurad.uni-koeln.de/index_e.html
References
15
Ackermann, I., Hass, H., Memmesheimer, M., Ebel, A., Binkowski, F., and Shankar, U.: Modal aerosol dynamics model for Europe: Development and first applications, Atmos. Environ., 32, 2891–2999, 1998. 1569
Andreae, M. O. and Merlet, P.: Emission of trace gases and aerosols from biomass burning, Global Biogeochem. Cycles, 15, 955–966, 2001. 1567
20
Atkinson, R., Baulch, D. L., Cox, R. A., Hampson, Jr, R. F., Kerr, J. A., Rossi, M. J., and Troe, J.: Evaluated kinetic and photochemical data for atmospheric chemistry, organic species: Supplement vii, J. Phys. Chem. Ref. Data, 28, 191–393,http://www.iupac-kinetic.
ch.cam.ac.uk/, 1999. 1568
Baughcum, S. L., Henderson, S. C., Hertel, P. S., Maggiora, D. R., and Oncina, C. A.:
Strato-25
ACPD
2, 1545–1597, 2002 Global chemical weather forecast system M. G. Lawrence et al. Title Page Abstract Introduction Conclusions References Tables Figures J I J I Back Close Full Screen / EscPrint Version Interactive Discussion
c
EGU 2002
Benoit, R., Sch ¨ar, C., Binder, P., Chamberland, S., Davies, H. C., Desgagne, M., Girard, C., Keil, C., adn D. L ¨uthi, N. K., M ¨uller, E., Pellerin, P., Schmidli, J., Schubiger, F., Schwierz, C., Sprenger, M., Walser, A., Willemse, S., Yu, W., and Zala, E.: The real-time ultrafinescale forecast support during the special observing period of the MAP, Bull. Am. Met. Soc., 83, 85–109, 2002. 1548
Berntsen, T. K., Karlsd `ottir, S., and Jaffe, D. A.: Influence of Asian emissions on the composition
5
of air reaching the North Western United States, Geophys. Res. Lett., 26, 2171–2174, 1999.
1566
Caplan, P. and Pan, H.-L.: Changes to the 1999 NCEP Operational MRF Model Analy-sis/Forecast System, NCEP Pub. No. 452, National Centers for Environmental Prediction, Silver Spring, 2000. 1567
10
Collins, W. D., Rasch, P. J., Eaton, B. E., Khattatov, B. V., Lamarque, J., and Zender, C. S.: Simulating aerosols using a chemical transport model with assimilation of satellite aerosol retrievals: Methodology for INDOEX, J. Geophys. Res., 106, 7313–7336, 2001. 1548
Crutzen, P. J. and Lawrence, M. G.: The impact of precipitation scavenging on the transport of trace gases: A 3-dimensional model sensitivity study, J. Atmos. Chem., 37, 81–112, 2000.
15
1566,1568
Crutzen, P. J. and Ramanathan, V.: Forward to the Indian Ocean Experiment special section, part 1, J. Geophys. Res., 106, 28 369–28 370, 2001. 1551
Das, P. K.: The Monsoons, National Book Trust, India, New Delhi, 1992. 1556
de Gouw, J. A., Warneke, C., Scheeren, H. A., van der Veen, C., Bolder, M., Scheele, M. P.,
20
Williams, J., Wong, S., Lange, L., Fischer, H., and Lelieveld, J.: Overview of the trace gas measurements on board the Citation aircraft during the intensive field phase of INDOEX, J. Geophys. Res., 106, 28 453–28 467, 2001. 1551
DeMore, W. B., Sander, S. P., Howard, C. J., Ravishankara, A. R., Golden, D. M., Kolb, C. E., Hampson, R. F., Kurylo, M. J., and Molina, M. J.: Chemical kinetics and photochemical data
25
for use in stratospheric modeling, Evaluation 12, 97-4, Jet Propulsion Laboratory, Pasadena, California, 1997. 1568
Dentener, F. J. and Crutzen, P. J.: Reaction of N2O5on tropospheric aerosols: Impact on the global distributions of NOx, O3, and OH, J. Geophys. Res., 98, 7149–7163, 1993. 1568
Dickerson, R. R. and Delany, A. C.: Modification of a commercial gas filter correlation CO
30
detector for enhanced sensitivity, J. Atmos. Oceanic Tech., 5, 424–431, 1998. 1577
ACPD
2, 1545–1597, 2002 Global chemical weather forecast system M. G. Lawrence et al. Title Page Abstract Introduction Conclusions References Tables Figures J I J I Back Close Full Screen / EscPrint Version Interactive Discussion
c
EGU 2002
Sillman, S., Levy II, H., Rohrer, F., Wauben, W. M. F., Velthoven, P. F. J. V., Wang, Y., Jacob, D., Bakwin, P., Dickerson, R., Doddridge, B., Gerbig, C., Honrath, R., H ¨ubler, G., Jaffe, D., Kondo, Y., Munger, J. W., Torres, A., and Volz-Thomas, A.: Climatologies of NOx and NOy:
A comparison of data and models, Atmos. Environ., 31, 1851–1904, 1997. 1552
Eskes, H. J., van Velthoven, P. F. J., and Kelder, H. M.: Global ozone forecasting based on ERS-2 GOME observations, Atmos. Chem. Phys. Discuss., 2, 921–942, 2002. 1548,1565
5
Flatoy, F., Hov, O., and Schlager, H.: Chemical forecasts used for measurement flight planning during POLINAT 2, Geophys. Res. Lett., 27, 951–954, 2000. 1547
Fumagalli, I., Gimeno, B. S., Velissariou, D., Temmerman, L. D., and Mills, G.: Evidence of ozone-induced adverse effects on crops in the mediterranean region, Atmos. Environ., 35, 2583–2587, 2001. 1566
10
Galanter, M., Levy, H. and Carmichael, G. R.: Impacts of biomass burning on tropospheric CO, NOx, and O3, J. Geophys. Res., 105, 6633–6653, 2000. 1567
Ganzeveld, L. and Lelieveld, J.: Dry deposition parameterization in a chemistry general circu-lation model and its influence on the distribution of reactive trace gases, J. Geophys. Res., 100, 20 999–21 012, 1995. 1568
15
Gerbig, C., Schmitgen, S., Kley, D., Volz-Thomas, A., Dewey, K., and Haaks, D.: An improved fast-response vacuum-uv resonance fluorescence co instrument, J. Geophys. Res., 104, 1699–1704, 1999. 1577
Hack, J. J., Boville, B. A., Kiehl, J. T., Rasch, P. J., and Williamson, D. L.: Climate statistics from the National Center for Atmospheric Research community climate model CCM2, J. Geophys.
20
Res., 99, 20 785–20 813, 1994. 1567
Hauglustaine, D. A., Brasseur, G. P., Walters, S., Rasch, P. J., M ¨uller, J.-F., Emmons, L. K., and Carroll, M. A.: MOZART, a global chemical transport model for ozone and related chemical tracers, 2: model results and evaluation, J. Geophys. Res., 103, 28 291–28 335, 1998. 1552
Holtslag, A. A. M. and Boville, B. A.: Local versus nonlocal boundary-layer diffusion in a global
25
climate model, J. Climate, 6, 1825–1842, 1993. 1567
Horowitz, L. W., Walters, S., Mauzerall, D. L., Emmons, L. K., Rasch, P. J., Granier, C., Tie, X., Lamarque, J.-F., Schultz, M. G., and Brasseur, G. P.: A global simulation of tropospheric ozone and related tracers: Description and evaluation of mozart, version 2, in preparation for J. Geophys. Res., 2002. 1568
30
Huntrieser et al.: Intercontinental transport of pollution from North America to Europe: Airborne trace gas measurements over central and northern Europe during CONTRACE, manuscript