Publisher’s version / Version de l'éditeur:
ASCE Journal of the Structural Division, 86, 5, pp. 39-68, 1960-10-01
READ THESE TERMS AND CONDITIONS CAREFULLY BEFORE USING THIS WEBSITE. https://nrc-publications.canada.ca/eng/copyright
Vous avez des questions? Nous pouvons vous aider. Pour communiquer directement avec un auteur, consultez la
première page de la revue dans laquelle son article a été publié afin de trouver ses coordonnées. Si vous n’arrivez pas à les repérer, communiquez avec nous à [email protected].
Questions? Contact the NRC Publications Archive team at
[email protected]. If you wish to email the authors directly, please see the first page of the publication for their contact information.
NRC Publications Archive
Archives des publications du CNRC
This publication could be one of several versions: author’s original, accepted manuscript or the publisher’s version. / La version de cette publication peut être l’une des suivantes : la version prépublication de l’auteur, la version acceptée du manuscrit ou la version de l’éditeur.
Access and use of this website and the material on it are subject to the Terms and Conditions set forth at
Rationale for determining design wind velocities
Davenport, A. G.
https://publications-cnrc.canada.ca/fra/droits
L’accès à ce site Web et l’utilisation de son contenu sont assujettis aux conditions présentées dans le site
LISEZ CES CONDITIONS ATTENTIVEMENT AVANT D’UTILISER CE SITE WEB.
NRC Publications Record / Notice d'Archives des publications de CNRC:
https://nrc-publications.canada.ca/eng/view/object/?id=9936e1f0-58b1-4ebf-a638-2c165d85ce7d
https://publications-cnrc.canada.ca/fra/voir/objet/?id=9936e1f0-58b1-4ebf-a638-2c165d85ce7d
Ser
TH1
N21r
2
no.
111
c .
2
NATIONAL
RESEARCH
COUNCIL
BLDG
C A N A D AANALYZED
DIVISION OF BUILDING RESEARCH
RATIONALE FOR DETERMINING DESIGN WIND VELOCITIES
BY A. G. DAVENPORT P R O C E E D I N G S O F T H E A M E R I C A N S O C I E T Y O F C I V I L E N G I N E E R S J O U R N A L O F T H E S T R U C T U R A L D I V I S I O N V O L . 86, N O . S T 5 . M A Y 1960. P. 39 - 68. R E S E A R C H PAPER N O . 1 1 1 O F T H E
DIVISION OF BUILDING RESEARCH
P R I C E 5 0 C E N T S
OTTAWA OCTOBER 1960
This p u b l i c a t i o n i s being d i s t r i b u t e d by
t h e Division of Building Research of t h e National
Research Council a s a c o n t r i b u t i o n towards b e t t e r
b u i l d i n g i n Canada.
I t should not be reproduced
i n whole o r i n p a r t , without permission of t h e o r i -
g i n a l publisher.
The D i v i s i o n would be glad t o be
of a s s i s t a n c e i n o b t a i n i n g such permission.
P u b l i c a t i o n s of t h e Division of Building
Research may be obtained by m a i l i n g t h e a p p r o p r i a t e
remittance,
( a Dank, Eupress, o r Post Office Money
Order o r
acheque made payable a t par i n Ottawa,
t o t h e Receiver General of Canada, c r o d i t National
Research Council) t o +,he N a t i o ~ a l
Research Council,
Ottawa.
S t a m p a r e not a c c e p t a b l e .
A
coupon system has been trntroduced t o
make payments f o r p u b l i c a t i o n s r e l a t i v e l y simple,
Coupons a r e a v a i l a b l e i n denominations
of
5,
25,
and
50cents,
and may be obtained by making a re-
mittanco a s i n d i c a t e d above.
These coupons may be
used f o r t h e purchase of a l l National Research
Council p u b l i c a t i o n s i n c l u d i n g s p e c i f i c a t i o n s of
t h e Canadian Government S p e c i f i c a t i o n s Board.
A N A L Y Z E D
May, 1960 ST 5
Journal of
the
STRUCTURAL
DIVISION
Proceedings of
the
American
Society of
Civil
Engineers
RATIONALE FOR DETERMINING DESIGN WIND VELOCITIES
By A. G. ~ a v e n ~ o r t l
SYNOPSIS
This paper f i r s t justifies the use of the 'extreme wind velocity averaged over a mile o r minute" a s a "basic designwind velocity" in preference to abso- lute peakvelocities which cannot be considered independently of the s i z e of the structure, and of the dynamic response of anemometer, s t r u c t u r e , and s t r u c - tural materials.
An attempt i s , then, made to show f r o m published r e c o r d s that reasonably
systematic relationships exist between th s (as characterized
by such general qualitative descriptions a s "city," 'treed countryside," and "open p r a i r i e n ) and both the of the e x t r e m e windvelocities near the ground and i t s r a t e of increasew;Chhh-esht. T h i s allows approximate estimates of the r a t i o of a e-"-- velocity to gradient velocity to be made. By these means, , independent s e t s o f anemometer r e c o r d s taken a t locations differing in surface roughness can be compared.
By further introducing t h e extreme value theory a method is suggested whereby these s e t s of r e c o r d s may be numerically related taking into account the relative ground roughness, the number of y e a r s of r e c o r d , t h e quality and consistency of the records, and the height of the anemometer. This p r o c e s s a s s i s t s in minimizing the s y s t e m a t i c e r r o r s which a r e often introduced into individual anemometer r e c o r d s .
Some published extreme-value data f o r the British I s l e s a r e analyzed a c - cording to the described p r o c e d u r e and an example is given illustrating how design wind velocities can be determined in a manner which t a k e s into account
Note.-Discussion open until October 1, 1960. To extend the closing date one month, a written recluest lllust be filed with the Executive S e c r e t a r y , ASCE. T h i s paper i s p a r t of the copyrighted Journal of t h e Structural Division, Proceedings of t h e American So- ciety of Civil Engineers, Vol. 86, No. ST 5, May, 1960.
University of Bristol, Englancl, formerly with the Div. of Blclg. R e s e a r c h , Natl. R e - s e a r c h Council, Ottawa, Canada.
40 May, 1960 S T 5 the important influence of s u r f a c e roughness, the variability of useful l i f e of different s t r u c t u r e s , and the r i s k s involved if the wind velocity i s exceeded.
INTRODUCTION
One of the principal loads acting on above-ground engineering s t r u c t u r e s is that due to the wind. I t s a c c u r a t e determination, therefore, is of fundamental importance in deciding what degree of safety and economy c a n be achieved i n such a s t r u c t u r e .
F o r m e r l y , it was common practice to design s t r u c t u r e s to r e s i s t the high- e s t wind e v e r recorded by the instruments then in use. Although this did p r o - vide a s o r t of yardstick f r o m which design wind loads could be estimated, i t was unreliable and subject to the difficulty that most meteorological r e c o r d s will eventually be broken. A longer period of r e c o r d i n c r e a s e d the chances of recording a v e r y high wind velocity. Another problem was that instruments which responded rapidly to fluctuations in wind speed tended t o indicate higher velocities than those which w e r e m o r e sluggish. In other known instances, the highest wind had unfortunately blown away the instrument a n d the crucial in- formation w a s lost.
All thesedifficulties tended to throw theproblemof determiningdesign wind velocities into the lap of the statisticianwho, f r o m the r e c o r d s of several y e a r s , could e s t i m a t e the probability of a given wind velocity r e c u r r i n g . Such a r e the v a g a r i e s of climate that the s t r u c t u r a l engineer can never hope for infor- mation much m o r e c e r t a i n than this.
F u r t h e r problems e m e r g e f r o m other considerations. Because the velocity of the wind is continually fluctuating, r e c o r d e d peak velocities will depend largely on the sensitivity of the anemometer. The p r e s s u r e s exerted on
a
s t r u c t u r e will also fluctuate, leading to dynamic amplification of the a c t u a l s t r e s s e s i n the s t r u c t u r e . This dynamic amplification, a s w e l l a s being de- pendent on the intensity and power of the fluctuations, will a l s o depend o n the s i z e and s h a p e of the s t r u c t u r e (as they will determine the r a t e of build-up of gust p r e s s u r e s ) and on the r e s p o n s e of the s t r u c t u r e and i t s constituent m a - t e r i a l s to dynamically applied loads. The dynamic amplification will vary, therefore, with the s i z e and flexibility of the s t r u c t u r e .F o r these reasons, wind loads a r e p e r h a p s best considered in t e r m s of a steady, applied force, independent of the s t r u c t u r e ' s shape, s i z e , and dynamic c h a r a c t e r i s t i c s , together with a coefficient denoting the amplification which can a r i s e through the interaction of the superimposed p r e s s u r e fluctuations and the s t r u c t u r e ' s dynamic response. The resolving of this coefficient, how- ever, which is s i m i l a r in many r e s p e c t s to the "earthquake problem," is not discussed herein.
This paper is confined to the determination of what will be t e r m e d the b a s i c design wind velocity, which corresponds to the extreme sustained windvelocity giving r i s e to the steady component of the p r e s s u r e . It is, therefore, an a v e r - age velocity and the determination of a suitable averaging interval forms p a r t of this discussion.
An attempt is made, a l s o , to determine how r e c o r d s f r o m a wide variety of anemometers of differing exposures and periods of r e c o r d m a y be related to one another, thereby minimizing the s y s t e m a t i c e r r o r s which may a r i s e i n the r e c o r d s due to anemometer siting and to the improvementof their overall r e -
DESIGN WIND VELOCITIES 41 liability. T h i s r e q u i r e s that cognizance be taken of the important influence of s u r f a c e roughness both on the magnitude of the surface velocities and on the i n c r e a s e of velocity with height. Combining t h e s e r e s u l t s with the e x t r e m e - value theory leads to an exploratory method through which b a s i c design wind velocities of given probability of o c c u r r e n c e m a y be predicted f o r locations of differing s u r f a c e roughness.
STRUCTURE O F NATURAL WIND
The wind is caused by the atmospheric p r e s s u r e differentials which r i s e over the s u r f a c e of the e a r t h . The acceleration produced by t h e s e p r e s s u r e differentials is accompanied by other components of acceleration known a s the geostrophic acceleration, due to the c u r v a t u r e and rotation of the earth, a n d the centripetal acceleration. The resultant of these accelerations produces a motion i n the f r e e a i r , unaffected by friction n e a r the surface, which is p a r a l - l e l to the lines of equal b a r o m e t r i c p r e s s u r e (known a s i s o b a r s ) . The velocity of the f r e e a i r is known a s the gradient velocity.
Under steady s t a t e conditions the gradient velocity can be determined d i - rectly if the latitude, the r a d i u s of curvature of the isobars, a n d the p r e s s u r e gradient (or spacingof the i s o b a r s ) a r e known (11.2 F o r zones of cyclonic winds (associated with a low p r e s s u r e s y s t e m and with s t o r m s and high winds) the gradient velocity VG is given by
in which r is the radius of c u r v a t u r e of i s o b a r s , w denotes the rotational speed of the earth;X is the latitude, dp/dN r e p r e s e n t s the p r e s s u r e gradient, and p is the density of the a i r . Eq. 1 Iends itself ideally to simple nomographic solution, a s shown by W. J. Humphreys (11, and the gradient velocity m a y be estimated directly f r o m isobar c h a r t s . Accurate e s t i m a t e s of gradient velocity, how- e v e r , a r e difficult to obtainunless the grid of meteorological s t a t i o n s m e a s u r - ing s u r f a c e p r e s s u r e s i s close.
The velocity of the gradient wind is, however, attainedonly a t heights around 1,000 ft to 2,000 f t above the ground. Closer to the ground, the wind i s r e t a r d - e d by the frictional f o r c e s and obstructions at t h e surface and the virtual s t r e s s - e s produced by the vertical exchange of momentum by turbulence ; its direction, then, is no longer parallel to the i s o b a r s . Turbulence also c a u s e s rapid fluc- tuations in the velocity of a wide range of frequencies and amplitudes. T h e velocity of the wind at lower levels, therefore, is usefully e x p r e s s e d in t e r m s of its mean speed and the deviations f r o m this velocity.
The time o r distance interval over which t h e mean i s a v e r a g e d depends o n the purpose f o r which the wind velocity i s to be used.
Choice of a Sz~itable Averaging Irrtevva1.-In determining b a s i c windveloci- ties f o r the design of s t r u c t u r e s certain fundamental considerationsdetermine what averaging interval i s m o s t appropriate. T h e s e may be s t a t e d a s follows:
1. The interval should coincide, a s f a r a s possible, with s o m e natural p e r i - odicity of the wind.
42 May, 1960 ST 5 2. The interval should be "long" compared to both (a) the natural frequency of the s t r u c t u r e , and (b) the response time of the instrument; in this way t h e r e will be no dynamic interaction between the s t r u c t u r e and fluctuations in the mean wind; measured wind velocities will be independent of the instruments response.
3 . The interval should be s h o r t enough to record the 'peaks" of s e v e r e s t o r m s .
4. The interval should correspond to a body of a i r of sufficient s i z e to en- velop completely a s t r u c t u r e and i t s vortex regions.
The 'mile of wind" o r the 'minute of windn both r e p r e s e n t suitable, if not optimum, intervals f o r measuring high-wind velocities f o r purposes of s t r u c - tural design. Both these i n t e r v a l s satisfy the foregoing conditions for r e a s o n s now discussed:
1 . By means of auto-correlation coefficients, Durst (2) found that in s t o r m winds a m a j o r group of eddies, thermal in origin, had a wavelength of about 4,000 f t to 6,000 ft, corresponding closely to the mile interval or the minute interval in winds of 60 mph.
2. a. The natural period of most s t r u c t u r e s is of the o r d e r of 0.1 s e c to 3 s e c (3), with that f o r the Empire State Building of 8.14 s e c (4). With the damping p r e s e n t in most s t r u c t u r e s , fluctuations corresponding to one m i l e i n e x t r e m e winds would have infinitesimal dynamic action.
b. R. H. Sherlock and M. B. Stout (5), r e f e r r i n g to the response t i m e of commercial anemometers, wrote in 1937, "that because of the inertia of mov- ing p a r t s of the instruments the r e c o r d s could only be accepted a s accurate if they w e r e averaged over 10 seconds o r more." Thus, even a t 150 mph, the mile of wind (or the minute of wind) s a t i s f i e s the second requirement.
3. The m i l e of wind a l s o r e p r e s e n t s a body of a i r f a r l a r g e r than m o s t s t r u c t u r e s , s o that s t a t i c p r e s s u r e s a t l e a s t equivalent to t h i s average s p e e d can be anticipated.
4. The m i l e of wind will be of sufficiently s h o r t duration t o record the peak of a sudden s e v e r e local thunderstorm o r squall.
T h e s e arguments, justifying the u s e of the extreme mile o r minute of wind a s basic design velocities, a r e endorsed f u r t h e r in that the mile of wind has been recommended for u s e in the United S t a t e s (where r e c o r d s a r e available for many y e a r s ) a s the basis f o r design wind velocities and the minute of wind in the B r i t i s h ~ s l e s . ~
Increase of Velocity with Height: I?zflz~ence of Surface Rozghness ajzd Sta- bility.-One of the most important f a c t o r s to b e considered is the i n c r e a s e of this mean wind velocity with height; a c o r o l l a r y to this is the retarding effect of the s u r f a c e friction on the wind velocity n e a r e r the s u r f a c e .
3 Sincc writing thls, the existence of a gap in the energy s p e c t r u m of tvincl speed, cen- t e r e d at a freclucncy of ahout 1 cycle p e r h r , a p p e a r s to have heell cstahlishecl by Van cler Hovel1 (Journal of Meteorology, Vol. 14, 1957, pp. 160-164). T h i s , together with the r e s u l t s f r o m a recent study a t the University of B r i s t o l , of over 100 s p e c t r a of s t r o n g tvincls now s u g g e s t s that reliable predictions of the turbulence at higher frequencies (necessary in predicting m a s i i n u n ~ m i ~ ~ c l loads) c a n be 11lac1e from the average wincl s p e e d taken o v e r a longer periocl, such a s one hour. In many countries climatological r e c o r d s of mean hourly wind velocities a r e m o r e readily availablc. The cliscussion that follo\vs appliecl equally t o thesc nlean hourly wincl-speeds a s ~ v e l l a s t o t h o s e averagecl o v e r a r a t h c r s h o r t e r pcriocl.
ST 5 DESIGN WIND VELOCITIES 43 Various empirical, semi-empirical, and theoretical f o r m u l a s have been de- rived to r e p r e s e n t thevariation of windvelocity with height. T h r e e of t h e m o r e familiar f o r m s a r e the s p i r a l , logarithmic, and exponential profiles. F o r s t r u c t u r a l purposes, the exponential o r power law profile has been used m o s t widely because of i t s simplicity. It can be s t a t e d a s
where Vz is the velocity a t height z above ground, and k and a a r e constants. By suitable choice of exponent, Eq. 2 can be made to c o r r e s p o n d closely o v e r a considerable range to the other f o r m s of profile which a r e l e s s empirical. The power law is applicable only in the layer extending f r o m t h e ground up to the height a t which the gradient velocity is f i r s t attained (usually in the r a n g e of 1,000 f t to 2,000 ft). Above this height, the wind velocity m a y be regarded a s constant.
D. Brunt (6) h a s noted that "If the variation of wind with height be r e p r e s e n t - ed by a lower law zP it is found that p i s i n c r e a s e d by a n i n c r e a s e in either roughness o r stabilityn (z being the height above ground). H e r e Brunt r e f e r s specifically to a range of heights above approximately 10 m (33 ft), the height being of i n t e r e s t to s t r u c t u r a l engineers.
An attempt is now made to evaluate these influences of stability and surface roughness on f i r s t , the r a t e of i n c r e a s e of mean velocity with height; and second, the magnitude of the mean s u r f a c e velocity. Both of these v a l u e s a r e of p r i m e importance in estimating b a s i c design wind velocities f o r s t r u c t u r e s .
Stability.-The stability of a s t o r m is m e a s u r e d by the lapse r a t e o r r a t e of temperature variation with height. In s t o r m winds of long duration, in which turbulence c a u s e s thorough mixing, the lapse r a t e near t.h.e ~ r o p n d is invari- ably close to the adiabatic which corresponds to a s t a t e of
1?&r'21
stability (7,8). Rudolf Geiger (9) h a s stated that this condition is generally attained at veloci- ties g r e a t e r than 6 m p e r s e c (13 mph). Observations of h u r r i c a n e s Edna (1954) and Ione (1955) off the New England coast, r e p o r t e d by Edwin Kessler ( l o ) , apparently confirm the general assertion that t h e stability of m a t u r e and l a r g e - s c a l e s t o r m s , whether of the tropical o r extra-tropical variety, is close to being neutral.Exceptions may be found, however, in s e v e r e local s t o r m s s u c h a s thunder- s t o r m s and frontal squalls (and perhaps in l a r g e r s t o r m s s u c h a s hurricanes in their e a r l y incipient s t a g e s , before full m a t u r i t y is reached) which a r e nota- bly unstable, where a i r n e a r the ground is w a r m e r than that aloft. As a c o n - sequence of t h i s instability, e x t r e m e t h e r m a l interchange t a k e s place between the a i r n e a r the surface and the f a s t e r moving upper a i r which is unretarded by friction n e a r the surface. Under c i r c u m s t a n c e s of e x t r e m e instability, the value of the exponent 1 /a m a y attain the limiting value of z e r o , corresponding to z e r o i n c r e a s e in velocity with height. At Agra, Barkat Ali (11) measured an exponent of 0.02 (1/50) in v e r y unstable conditions and 0 . G. Sutton (7) s u g - gests a value of 1/100.
F r o m these r e m a r k s the following g e n e r a l inferences m a y be drawn with r e g a r d to the effects of stability on the profile:
a. Severe local s t o r m s , s u c h a s thunderstorms o r frontal squalls, a r e e x - tremely unstable and s o the i n c r e a s e of mean velocity with height i s very s m a l l ; the frictional c h a r a c t e r i s t i c s of the ground s u r f a c e may have a l m o s t negligible effects on the velocity profile.
44 May, 1960 S T 5 b. L a r g e - s c a l e mature s t o r m s of either tropical o r extra-tropical descrip- tion exhibit nearly neutral stability with no marked tendency f o r violent t h e r - mal interchange; the dominating influence on the velocity profile i n these s t o r m s is not the stability but the s u r f a c e roughness.
Surface Roughness.-The important question now a r i s e s a s to how g r e a t an effect s u r f a c e roughness h a s on the windvelocity profile in l a r g e -scale m a t u r e s t o r m s which a r e probably the most important. In comparison with the v a s t amount written in engineering p a p e r s on t h i s general subject, scant attention has been given to this p a r t i c u l a r question. It a p p e a r s to be of paramount i m - portance in the a c c u r a t e evaluation of wind velocities.
It should f i r s t be emphasized that what is r e f e r r e d to by the t e r m "surface roughness" is neither the shielding due to individual o b s t a c l e s nor the o r o - graphic effects influencing the airflow in mountain regions, but the cumulative statistical d r a g effect of many obstructions on the wind. The surface rough- ness, therefore, is c h a r a c t e r i z e d by the density, size, and height of the build- ings, t r e e s , vegetation, r o c k s , etc., on the ground, around, and over which the wind m u s t flow; i t will be a minimum over the ocean and a maximum in a l a r g e city.
F o r y e a r s the measurement of wind-velocity profiles has been of i n t e r e s t in the fields of meteorology, aviation, agriculture, and wind power a s well a s in civil engineering. Information has now accumulated f r o m which i t is p o s s i - ble to evaluate the influence of the surface roughness on the windvelocity p r o - file.
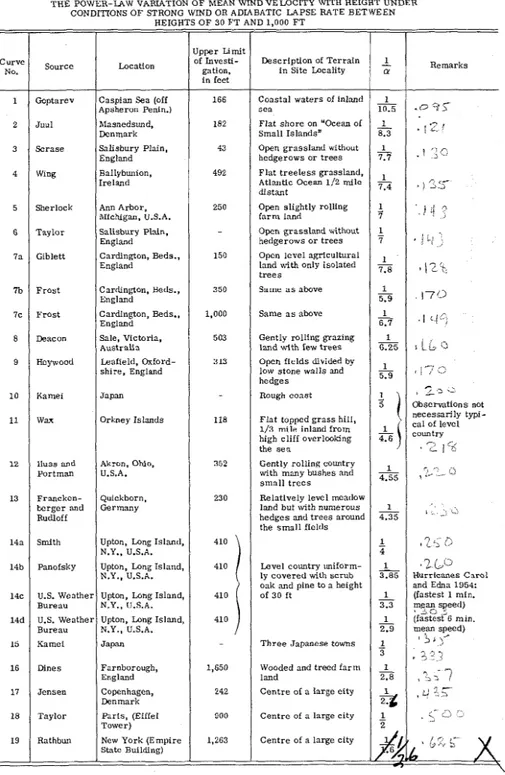
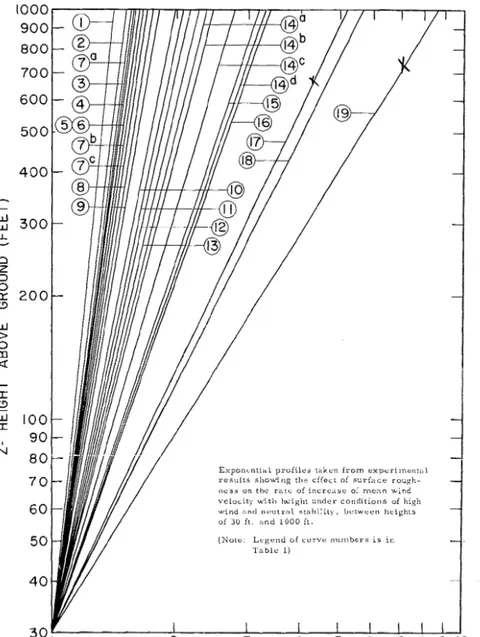
In Table 1 , the exponents l/cu corresponding to theaccumulatedexperiment- a1 r e s u l t s of a number of o b s e r v e r s a r e shown on a comparative basis and the corresponding power law p r o f i l e s plotted in Fig. 1. The r e c o r d s from which these exponents and equivalent power-law c u r v e s a r e derived a r e given in the Appendix. Where the r e s u l t s w e r e not explicitly stated a s a power law, i t was found that, in each case, a power law could be closely fitted to the records with only s m a l l deviations. It should be noted that the r e c o r d s r e f e r specifically to mean velocity profiles prevailing above a height of 30 ft in s t r o n g winds, o v e r flat ground s u r f a c e a t lapse r a t e s which, if not explicitly stated, from the n a - ture of t h e s t o r m s studied presumably could not have differedgreatly f r o m the adiabatic. The r e c o r d s , therefore, a r e homogeneous except that the nature of the ground roughness and the aggregate n a t u r e of obstructions vary widely, f r o m the smooth surface of the s e a to the rough obstructed s u r f a c e of a l a r g e city.
The exponent of the power law i n c r e a s e is s e e n to vary between 1/10.5 a n d 1, depending only on the s u r f a c e roughness c h a r a c t e r i s t i c s . It is seen that Curves 1 to 9 have exponents lying between 1/10.5and 1/5.9 and, in each c a s e , the surrounding t e r r a i n was characteristically flat and open. T h e average f o r the observations taken on land l i e s close to 1 /7 which is a f a m i l i a r exponent found a t the boundaries of pipes and wind tunnels in which mechanical turbu- lence predominates and the fluid is neutrally stable. The exponents of Curves 12 to 16 l i e between 1 /5 and 1 /2.8 and a v e r a g e 1/3.5. F o r these curves the t e r r a i n corresponded to the rougher c h a r a c t e r i s t i c s of t r e e d a n d wooded f a r m - land, towns, s c r u b t r e e s , e t c . Curves 17, 1 8 and 19 a r e derived from r e c o r d s obtained in l a r g e cities (Copenhagen, P a r i s a n d New ~ o r k ) which probably r e p r e s e n t conditions of e x t r e m e surface roughness; the corresponding exponents a r e 112.1 and 1/1.6. F o r a l l the curves (except 10 and 11 which a r e probably not typical of level country) the value of the exponent is s e e n to increase in a
S T 5 DESIGN WIND VELOCITIES 4 5
TABLE 1.-INFLUENCE OF SURFACE ROUGHNESS ON VALUES OF THE EXPONENT l/a IN
Remarks .O :i'T
.
;-.
1 '>C , )35-
' . - i i i 9 , > *;;;>, > . , 112'h.
17'3 .IL{:) 5i
L
0 ,,
,;T<>
fi , i 3.:.
Observations not necessarily typi- ~ ~ ~ ~ r ~ I , 2 1 % . . t ..> !-'- . "- 0,
,?
'; 13 ,2i0
Hurricanes Carol and Edna 1954: (fastest 1 min. ?!s;yed) (iastest G min. mean speed) 85;
,--
% .' ' . . , ~ > , % <7
, q 9; xy-
.. ,') -- )..
.__
- O F MEAN WINDVELOCITY WTH HEIGHT UNDER POWEH-LAW VARIATIONCONDITIONS O F STRONG HEIGHTS
Location
Caspian Sea (off Apsheron Penin.) hlasnedsund, Denmark Salisbury Plain, England Ballybunion, Ireland Ann Arbor, ivficNgan, U.S.A. Salisbury Plain, England Cardington, Beds., England Cardington, Beds.. England Cardington, Beds., England Sale, Victoria, Australia Leafield. Oxford- shire, England Japan O r h e y Islands Akron. Ohio, U.S.A. Quickborn, Germany
Upton, Long Island, N.Y., U.S.A. Upton, Long Island, N.Y., U.S.A. Upton, Long Island, N.Y., U.S.A. Upton, Long Island, N.Y., U.S.A. Japan Farnborough, England Copenhagen, Denmark Parls, (Eiiiel Tower)
New York (Empire Stiltc Building)
Cir
1 2 3 4 5 6 7a 7b 7c 8 9 10 11 12 13 14a 14b 14c 14d 15 16 17 18 19 \RID OR O F 30 F T Upper Limit gation. of Investi- i n feet 166 182 43 492 250 150 350 1,000 503 313 118 352 230 410 THE source Goptarev Juul Scrase Wing Sherlock Taylor Giblett F r o s t F r o s t Deacon Heywood Kamei Wax lluss and Portman Francken- berger and Rudloff Smith Panofsky U.S. Weather Bureau U.S. Weather Bureau Kamci Dines Jensen Taylor RathbunADIABATIC LAPSE RATE AND 1,000 F T
i n Site Locality Description of Terrain
Coastal waters 01 inland
sea
Flat shore on "Ocean of Small Islands" Open grassland without hedgerows o r trees Flat t r e e l e s s grassland, Atlantlc Ocean 1/2 milo distant
Open slightly rolling f a r m land
Open grassland without hedgerows o r trees Open level agricultural
land with only isolated t r e e s
Same a s nbove Same a s above Gently rolling grazing land with few t r e e s Open fields divided by low stone walls and hedges
Rough coast Flat topped g r a s s hill, 1/3 mile inland from high cliff overlooldng the s e a
Gently rolling country with many bushes and s m a l l t r e c s
Relatively level meadow land but with n u n ~ e r o u s hedges and t r e e s around the s m a l l fields BETWEEN
1
LY 2 10.5L
8.3L
7.7 7.4 1 7 1 7 7.8 -5t9
- : 71
6.25 1 - 5.9I
L
4.6 4.55 2 4.35 - 1 41
3.85 - 1 3.3 - 1 2.9 2 2 2.8I?z
1 2 410 ountry uniform-ly covered with scrub oak and pine to a height 410 410 1,650 242 000 1,263 T h r e e Japanese towns Wooded and treed farrn land
C e n t r e of a large city C e n t r e of a Large city
May, 1960
ST
5FIG. 1.-EFFECT O F SURFACE ROUGHNESS ON RATE O F INCREASE O F MEAN VELOCITY WITH HEIGHT
ST 5 DESIGN WIND VELOCITIES 4 7 manner which is remarkably consistent with the increase in the roughness of the t e r r a i n and the number of obstructions.
Effect of Velocity.-It should be noted that velocity can be expected to have a slight secondary effect on the profile in that thevalue of the s u r f a c e friction
FIG
i n c r e a s e s slightly with windvelocity. As a r e s u l t , the r a t e of i n c r e a s e of mean wind velocity with height i n c r e a s e s slightly with velocity. This is familiar i n
40
wind-tunnel work.
Numerical evidence of the indirect influence of thevelocity o n the velocity - height relationship i s furnished by G . F . Collins' investigations of nine s t o r m s (301, mainly at Brookhaven Laboratory, Long Island. He found ( ~ i g . 21, by examining the 5-minmean velocities a t different elevations up to 410 ft, that
3 0 IO
1 5
-
ro
25
30
40
50 60
7b
80
100
WIND SPEED
(M.P.
H.)
.
2.-OBSERVATIONS O F HURRICANES "CAROL" AND "EDNA" (1954) A T BROOKIIAVEN, LONG ISLAND. (TERRAIN: FLAT.COUNTRI' WITH SCRUB T R E E S ) -pp7pA
/
A
0
I
---- 0L-.-
- I48 May, 1960 S T 5 the exponent of the power -law profile increased by approximately 0.02 f o r e v e r y 10-mph i n c r e a s e in s u r f a c e wind ve1ocity;at 50 mph the value being 0.27 (that is, 1/3.7) and the extrapolated value a t 80 mph being 0.33 (1/3.0). These p r o - files, according to Collins, fitted the e x p e r i m e n t a l r e c o r d s extremely well with the value of the standard deviation equalling 1.26 mph. T h e s e results, how- e v e r , indicate that the effect of wind velocity (over the range of maxima e n - countered) is not nearly a s g r e a t a s that due to the differences in surface rough- n e s s .
Bearing in mind the influenceof the wind velocityon the r a t e of increase of wind velocity with height, it i s now possible to suggest the following approxi- matevalues f o r power law exponents corresponding to m o r e o r l e s s qualitative descriptions of the s u r f a c e roughness o r aggregate nature of the surface ob- structions:
Description of the Terrain F o r open country, flat coastal belts, s m a l l islands situated in l a r g e bodies of water, p r a i r i e grassland, tundra, etc. F o r wooded countryside, parkland, towns, o u t s k i r t s of l a r g e c i t i e s rough coastal belts
F o r c e n t e r s of l a r g e c i t i e s
1
Power-Law Exponent
T h e s e values r e f e r to the mean wind velocity over level ground, to l a r g e - s c a l e s e v e r e s t o r m s (which exhibit nearly n e u t r a l stability) and to heights b e - tween about 30 ft and the height a t which the gradientvelocity is f i r s t attained. If there a r e a r e a s in which the highest probable velocities o c c u r during s e v e r e l o c a l s t o r m s s u c h a s thunderstormsand frontal squalls (which s e e m s i m p r o b a - ble), no i n c r e a s e in velocity with height would s e e m appropriate.
Records. -If reliable long-term anemometer r e c o r d s w e r e available for a l l a r e a s exhibiting differing c h a r a c t e r i s t i c s of s u r f a c e roughness and incidence to s e v e r e s t o r m s , the discussion could p e r h a p s be left a t t h i s point; a b a s i c wind velocity could be determined for each geographical location based o n a statistical analysis of wind r e c o r d s over a period of 40 y r o r 50 yr, and then applied to a wind-velocity profile appropriate to the surface roughness of the vicinity. Unfortunately, t h e r e a r e s e r i o u s o b s t a c l e s to this approach (certain- ly, i n a s p a r s e l y populated country such a s Canada) since meteorological r e c o r d s a r e not always satisfactory enough for the following reasons:
Only a s m a l l number of stations in Canada will have r e c o r d s extending back a sufficient number of y e a r s . At some locations the anemometer will have been moved s e v e r a l times d u r i n g the period of record, affecting the exposure and the homogeneity of the r e c o r d s . Severe s t o r m s may have blown the a n e - mometer away o r r e n d e r e d i t inoperative, thus losing crucial information. The anemometer may also give readingswhich a r e not representative of level coun- t r y due to the siting of the anemometer on o r near a building. Hugh L. Dryden and George C. Hill, for example, suggest that the well-exposedanemometer on top of the E m p i r e State Building, situated m o r e than 200 ft above the roof, r e a d s 23% higher than the approaching flow, due to the p r e s e n c e of the build- ing (31). If, a t a i r p o r t s , a n e m o m e t e r s w e r e r a i s e d high enough to be f r e e f r o m the influence of the buildings they would p r e s e n t a hazard to a i r c r a f t . In win- ter, the periodof worst s t o r m s , Dines a n e m o m e t e r s sometimes clog withblow-
ST 5 DESIGN WIND VELOCITIES 49 ing snow. Ice accretions s o m e t i m e s f o r m on cup anemometers. Anemometer readings taken in mountains, in valleys, and on coastal cliffs a r e subject to orographic effects s o m e t i m e s resulting in noticeably higher velocities.
All of these considerations add emphasis to Sherlock's (32) recommendation, s h a r e d by many others, that design velocities should be based "on a s t a t i s t i - c a l analysis of wind r e c o r d s o v e r a period of 40 to 50 years." Also the r e - sults obtained f r o m the r e c o r d s of one station should be r e l a t e d to those f r o m other neighboring stations by a suitable s t a t i s t i c a l method. Only in this way can spurious and systematic e r r o r s arising in the r e c o r d s of a n individual s t a - tion be minimized.
The next s t e p , therefore, i s to explore a suitable method whereby the a c - cumulated r e c o r d s of all meteorological wind r e c o r d s might b e correlated. Since it i s not desirable to r e s t r i c t the admissible r e c o r d s to those obtained f r o m anemometers situated in "open level country" (this, in c e r t a i n regions of Canada, f o r example, would decimate the available records), it i s f i r s t neces- s a r y to investigate m o r e fully the effects of s u r f a c e roughness on the veloci- t i e s measured n e a r the s u r f a c e o v e r level ground.
It has already been noted that there i s s o m e height a t which t h e influence of the ground friction transmitted upwards through eddy viscosity, h a s a negligi- ble effect on the velocity of the wind a s it responds to the p r e s s u r e gradient.
If
the velocity a t this height i s denoted by VG (the gradient velocity), and t h e height a t which this velocity i s f i r s t attained by z ~ , then by r e f e r e n c e to t h e power-law i n c r e a s e of velocity with heightIn o r d e r to determine the r a t i o of the velocity at height z above the ground to the gradient velocity, it i s f i r s t necessary to determine v a l u e s of zG c o r r e - sponding to the various s u r f a c e roughness categories already discussed. An attempt i s now made to do this on the basis of the pertinent experimental r e c o r d s that a r e available.
Examinationof Sherlock's (16) investigations a t Ann Arbor, Mich., indicates that f o r these conditions of flat open country, the value of ZG (the height a t which the gradient velocity is f i r s t attained) i s of the o r d e r of 900 ft. This value a g r e e s reasonably well with that obtained by Taylor, a t Salisbury Plain, (discussed by W. W. Pagon (17)) f o r s i m i l a r t e r r a i n in which a v e r a g e values of ZG f o r s t r o n g winds w e r e 1,250 ft i n s u m m e r and 885 ft inwinter. An approxi- mate value of 900 ft, therefore, i s chosen for the value of ZG in flatopen coun- try.
In l a r g e cities, Pagon (171, citing Taylor's studies at the Eiffel Tower i n P a r i s , suggests a value of ZG f o r strong winds in a l a r g e city of 2,020 ft i n s u m m e r and 1,420 ft in winter. An approximate average value of 1,700 ft is adopted for the present. The value of 1,300 f t i s chosen for t h e intermediate conditions of rough wooded country. These values of ZG of 900 f t , 1,300 ft, a n d 1,700 f t (together with the appropriate exponents), corresponding to the three types of roughness conditions, give the t h r e e c u r v e s of Fig. 3.
It i s not suggested a t this s t a g e that these c u r v e s a r e highly accurate. I n - deed, the qualitative aspects of the problem do not permit g r e a t accuracy. It should be noted that in these c u r v e s the values of l/cr a r e founded on a r e l a - tively g r e a t e r amount of information than a r e t h e values of z ~ ; the e r r o r s i n - volved in the l a t t e r , however, (which may differ by 200 ft) a r e of less conse- quence.
'10
OF GRADIENT VELOCITY
FIG. 3.-INCREASE O F VELOCITY WITH HEIGIIT OVER L E V E L GROUND F O R T H R E E D I F F E R E N T T Y P E S O F S U R F A C E ROUGIINESS ACCORDING T O T H E POWER LAW
ST 5 DESIGN WIND VELOCITIES 5 1 Some confirmationof the rough accuracy of these c u r v e s is afforded by the comparison of the surface velocities over t e r r a i n of different s u r f a c e rough- n e s s e s . In their study of the climate of Central Canada, W. G. Kendrew and D. C u r r i e (33) observe that "the mean (annual wind speed in the p r a i r i e s is between 12 and 16 mph. The speed is appreciably l e s s in parklands with means of 9-12 mph and, again, l e s s in f o r e s t s 5-9 mph; the increased friction among the t r e e s is the main cause." T h e s e reductions i n wind velocity, compared to the archetypal flat open country of the p r a i r i e s , a r e entirely compatible with those suggested by Fig. 3.
A comparison of mean wind speed in nine Canadian cities (34) and a t a i r - p o r t s on their outskirts indicates that the s p e e d in the city is 65% of that n e a r the outskirts (the value suggested by Fig. 3 is 59%). Elevation, shielding, a n d siting of the anemometers a n d periods of observation vary in e v e r y case, but the trend is obvious. A study of hurricane winds a t Lake Okeechobee, Florida, by the U.S. C o r p s of Engineers (351, indicated that the windoff the land (ever- glades, covered with s c r u b c y p r e s s , etc.)averaged 60% of the wind over water when the l a t t e r was 50 mph, and 74% when the l a t t e r was 80 mph.
H. Ferrington (36), discussing the wind velocities found i n Great Britain (in general t e r m s , a t e r r a i n c h a r a c t e r i z e d by t r e e d , rolling country and s t r a g g - ling urban a r e a s ) , has made the following interesting note:
"On one occasion when the whole of the B r i t i s h Isles was covered with parallel i s o b a r s running n e a r l y west to e a s t , a l l stations on t h e western side gave the wind a s f o r c e 8 (42 mph) while those on the e a s t e r n side gave force 5 (21 mph) s o that the velocity w a s reduced by one-half in con- sequence of the "friction" of the land. If the velocity a t t h e exposed westernstations be t a k e n a t two-thirds thevelocity of the wind f r e e f r o m friction, we get the following i n t e r e s t i n g r e s u l t which is probably correct enough for practical use;one-third of the velocity is lost by t h e s e a f r i c - tion on the western side, and one-third m o r e by the land friction of the country between west and east."
In a s e r i e s of measurements made a t Valentia, N. Ireland, L. H. G. Dines (37) found that for this locality (flat open lowlands verging on the s e a ) the ratio of the surface wind to the gradient wind f o r 27 occasions on which the s u r f a c e wind exceeded 1 5 m p e r s e c , (34 mph) w a s 0.58. S. P. Wing (15) a t a s i m i l a r locality found a n identical value f o r a l l directions taken together.
N. C a r r u t h e r s (38), quoting a n unpublished note by C. E. P. Brooks, gives the following values f o r the r a t i o of the wind velocity at 10
m
(33 ft) above ground to the gradient wind W/G:Exposure W/G, i n %
Open s e a Low islands
Windward c o a s t s and neighboring lowland Leeward coasts, neighboring lowland and s e a Open land, unsheltered
Sheltered land and townsites
All thesevalues a r e a g a i n r e m a r k a b l y close to thevalues suggested by Fig. 3. Design Velocities. -It is now possible to r e t u r n to the p r o b l e m of determin- ing design velocities appropriate to different geographical r e g i o n s . The p r e - diction of probabilitiesand r e t u r n periods of e x t r e m e wind velocities has been
5 2 May, 1960 S T 5 suggested many times. In 1932, S. P. Wing (39) used the n o r m a l distribution curve to obtain the distribution curves f o r e x t r e m e wind velocities in s e v e r a l l a r g e American cities. M o r e recently, Arne L. Johnson (40) has r e m a r k e d that this type of distribution "gives a significant deviation from observed values." Since the date of $ling's correspondence, the extreme-value d i s t r i - bution (due largely to E. J. Gumbel (41)) h a s been developed. Johnson, who analyzed the anemometer r e c o r d s for both e x t r e m e indicated gusts and hour- ly mileages a t thirteen stations in Sweden and s i x i n the B r i t i s h Isles, s t a t e s that "the r e s u l t s obtained do not contradict the assumption that the distribution of extreme values of type No. 1 is in close agreement with t h e distribution of the actual wind velocities," (p. 119 (40)). Arnold Court (42) analyzed the r e c - o r d s of twenty five weather stations in the United States, having 37 y r of s a t i s - factory r e c o r d s , according to the s a m e theory and s t a t e s "all of the wind data s e e m s to follow the theory."
This distribution function takes the f o r m (41)
The reduced variate
where a is the s c a l e factor and u the mode of the extreme value data.
Suppose that a l l a n e m o m e t e r r e c o r d s a r e analyzed to obtain t h e p a r a m e t e r s a and u (in t e r m s of which the r e t u r n periodof extreme s u r f a c e velocities can be completely determined according to the e x t r e m e value theory). Then, an estimate of the distribution of e x t r e m e gradient velocities a t this location is given by the p a r a m e t e r s l / k , a, and ku w h e r e k is a "roughness coefficientn defined by
l / o
. . .
(6)ZA being the height of the anemometer and ZG and l / c ~ being given approxi- mately by Fig. 3.
The object now is to t r y to c o r r e l a t e these e s t i m a t e s of the gradient veloci- ties in o r d e r to reduce the systematic e r r o r s which may have occurred in the anemometer r e c o r d s , to i m p r o v e the estimate of extreme-wind velocities o c - curring a t stations with s h o r t e r periods of r e c o r d s , and to minimize the s u b - jective elements involved in the determination of design-wind velocities.
Suppose that anemometer n situatedat latitude
4,
and longitude Anpossesses r e c o r d s extending back a p e r i o d of Nn y r which, by extreme-value analysis, yields v a l u e s f o r the s c a l e f a c t o r and mode of a n and un. Suppose that the b e s t estimateof the "roughness factor" is kn, then t h e correspondingvalues of s c a l e factor and modal value r e f e r r i n g to the gradient velocity a t this point a r e l / k n ; an = a', and kn un = u',.It i s now a s s u m e d that these p a r a m e t e r s follow s o m e mth degree contour s u r f a c e (where m is l e s s than the total number of r e c o r d s being analyzed) of the f o r m s
DESIGN WIND VELOCITIES 5 3
ST 5 and
The values of the coefficients Aij and Bij a r e now obtained by fitting the ob- served values to these s u r f a c e s by the method of least squares. This problem is one well suited to electronic computation. In fitting the values, it would be appropriate to weight them f i r s t , by the factor
fi
which puts m o r e reliance on the r e c o r d s of longer period and, second, by a factor Q determined un- avoidably, by a subjective evaluation of the quality of the r e c o r d s , with r e g a r d to the siting of the anemometer, the number of times it h a s been moved, and the possible amplification effects of mountains, valleys, etc. F o r example, a f i r s t - c l a s s weather station, where the anemometer is situated on level ground away f r o m shielding and has not been moved, might be given a weighting of 9 o r 10 (out of a possible 101, w h e r e a s an anemometer situated c l o s e to the roof of a building, in a shielded a r e a o r in a valley, might be weighted by a factor of only 1 o r 2. The least-squares p r o c e s s minimizes the e r r o r s in a' and u' due to the many c a u s e s cited, on the assumption that the weighted e r r o r s a r e nor- mally distributed.This p r o c e s s leads directly to the contours of a' and u' for the territory considered. If it is now desired to e r e c t a s t r u c t u r e at a c e r t a i n location to last a periodof T y r (T
>
10) with a riskof q that the basic design wind velocity V will be exceeded within this time, the r e t u r n period R of this wind velocity V is given by- T
R =
-
T
if q i s s m a l l.
.
.
.
.
.
. .
. .
loge ( 1 - q) 4 (9 )
This r e p r e s e n t s a probability of 1/R. By e x t r e m e value theory, the value of the required gradient velocity
where a ' and u' a r e determined from the contours.
The values of the velocity n e a r e r the surface corresponding to this gradient velocity a r e determined f r o m Fig. 3 according to the appropriate roughness conditions.
If the s t r u c t u r e is to be e r e c t e d on a hill o r in a valley, a suitable amplifi- cation factor should be used. Examples of t h e s e a r e given by Pagon (17) and P. C. Putnam (43). The.only way to determine this will often be by actual ob- servation of wind velocities a t the s i t e for a s h o r t period and then comparing their value with those at a nearby anemometer on level terrain.
In this way, it becomes possible to r e l a t e the "basic design wind velocityn for each s t r u c t u r e to the roughness c h a r a c t e r i s t i c s of the ground surrounding it, the anticipated span of the s t r u c t u r e s useful life, and the r i s k s consequent on the design wind velocity being exceeded. Any system which does not take into account the wide variation in those factors which a r e to b e encountered obviously doesnot permit either a full m e a s u r e of safety o r economy to be ef- fected.
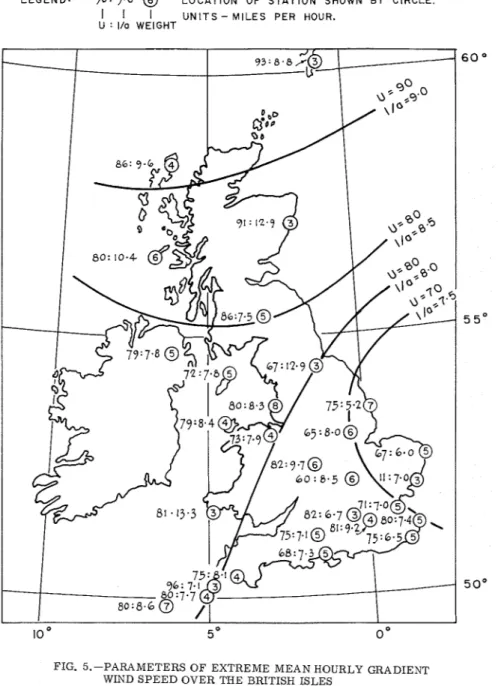
Extreme Wind Speeds Over the British Isles.-To study their practicality, the methodand procedures d e s c r i b e d w e r e applied to some extremevalue data
5 4 May, 1960 ST 5 obtained by H. C . Shellard (Table 3). Of the forty eight stations whose anemo- graph r e c o r d s have been analyzed by Shellard, only those described in "The Gazetteer of British Meteorological Stations," (H.M.s.o., London, 1931), a r e r e f e r r e d to h e r e since the essential s i t e descriplions of the o t h e r stations a r e no1 available i n published f o r m and, in any case, consist largely of those stations with only s h o r t periods of r e c o r d .
Values of U and l / a w e r e calculated f r o m Shellard's values f o r the 'once in ten y e a r s ' and 'once in a hundred y e a r s ' e x t r e m e wind s p e e d s and these a r e
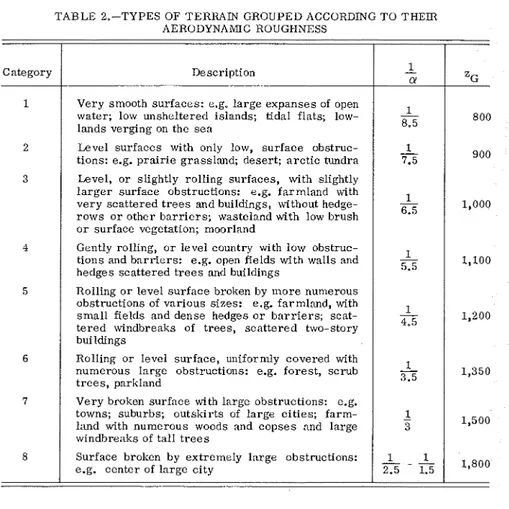
Very smooth surfaces: e.g. large expanses of open water; low unsheltered islands; tidal flats; low- lands verging on the s e a
TABLE 2.-TYPES OF TERRAIN GROUPED ACCORDING TO THEIR AERODYNAMIC ROUGHNESS
Level surfaccs with only low, surface obstruc- tions: e.g. p r a i r i e grassland; desert; a r c t i c tundra Category
Level, o r slightly rolling surfaces, with slightly l a r g e r surface obstructions: e.g. farmland with v e r y scattered t r e e s and buildings, without hedge- r o w s o r other b a r r i e r s ; wasteland with low brush o r surface vegetation; moorland
Gently rolling, o r level country with low obstruc- tions and b a r r i e r s : e.g. open fields with walls ,and hedges scattered t r e e s and buildings
Description
Rolling o r level surface broken by m o r e numerous obstructions of various sizes: e.g. farmland, with small fields and dense hedges o r b a r r i e r s ; scat- t e r e d windbreaks of trees, scattered two-story buildings
Rolling o r level surface, unifornlly covered with numerous lnrge obstructions: e.g. f o r e s t , scrub t r e e s , parkland
1
-
N
Very broken surface with large obstructions: e.g. towns; suburbs; outskirts of large cities; farm- land with numerous woods and copses and large windbreaks of tall t r e e s
z~
Surface broken by extremely large obstructions: e.g. center of lnrge city
recorded in T a b l e 3. T h e s e values w e r e also checked against Shellard's o r i g i - nal computation sheets, with h i s kind p e r m i s s i o n .
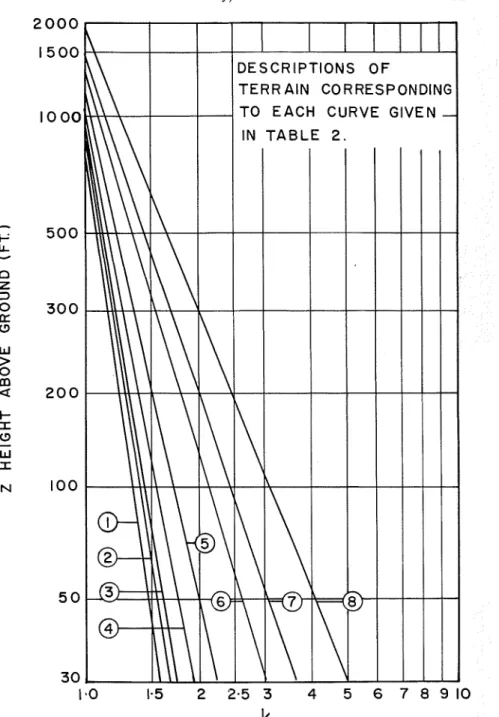
The roughness category of each station w a s a s s e s s e d by comparing the photographs and descriptions of the a n e m o m e t e r stations given in the "Gazet- teer" (op. cit.) with the descriptions given in Table 2. ( ~ h e s e roughness c a t e - gories for each station a r e given in Table 3). Knowing the roughness category and the height of the anemometer (zA) the roughness factor (kA) was found from Fig. 4, and recorded in Table 3. The anemometer height givenin Table 3
stationsb Lat. -N Long. Cate- U gradient with
O t
IIgory
Ijiq
I
k~1)
i
(rnpb)
)IkAxl
a k ~ m p h ) x u11
/
/ W t . a Q V T j
TABLE 3.-ANALYSIS OF EXTREME MEAN HOURLY WIND SPEEDS OVER THE BRITISH I S L E S ~
11
Larwick Stornoway T i r e e Aberdeen E skdalemuir Aldergrove Pt. of Ayre Holyhead Southport Sealand Catterick Spurnhead Cranwell Birmingham Cardington Gorleston Felixstowe Shoeburyness Manston Kew Obs'vty Croydon Ly mpne Boscornbe Down Calshot St. Ann's Hd. Scilly Lizard Pendenni s Plymouth a Shellard, H.2
11
Established1
rnpp. 257-265. b Stations a r e grouped according to general geographic locality. u1
ul 60 09 1 0 8 W 5 8 11 6 21W 56 32 6 55W 57 10 2 06W 55 19 3 12W 5 4 39 6 13W 5 4 25 4 2 2 W 53 1 9 4 3 7 W 53 38 3 0 0 W 53 1 3 3 OOW 5 4 22 1 3 7 W 53 3 5 0 07E 53 02 0 30W 52 29 1 5 6 W 52 07 0 25W 52 3 5 1 4 3 E 5 1 37 1 2 0 E 5 1 32 0 49E 5 1 2 1 1 2 1 E 5 1 28 0 19W 5 1 2 1 0 07W 5 1 05 1 OlE 5 1 10 1 4 5 W 50 49 1 1 8 W 5 1 4 1 5 11W 49 56 6 18W 49 57 5 12W 50 09 5 0 3 W 50 22 4 08W
C., "Extreme Wind Speeds 2 2 2 6 4 4 1 2 2 4 4 1 3 7 3 3 4 4 5 8 7 4 4 2 1 1 2 3 2 over 39 40 42 4 1 35 42 40 38 33 42 3 3 3 4 33 118 135 3 4 40 89 46 75 105 48 33 42 70 57 60 42 65 Great 1.65 1.60 1.60 2.75 1.88 2.05 1.50 1.60 1.65 1.80 1.90 1.55 1.68 2.40 1.40 1.60 1.70 1.57 2.00 2.75 2.15 1.75 1.90 1.60 1.40 1.45 1.50 1.65 1.55 Britain and 5.30 56.4 6.00 54.2 6.52 50.1 4.69 32.9 3.97 45.5 3.79 38.5 5.21 47.7 5.28 49.4 5.02 48.3 4.41 40.8 6.80 35.4 3.58 48.5 4.78 38.5 4.06 34.2 6.06 42.9 3.77 42.1 4.10 41.9 4.49 44.9 3.70 39.9 2.42 29.7 4.26 37.4 3.72 42.7 3.74 39.4 4.55 42.3 9.51 57.8 5.92 55.2 5.13 53.0 4.30 58.2 5.22 48.4 Northern Ireland." 8.75 93.1 9.60 86.4 10.40 80.2 12.90 91.0 7.50 85.6 7.77 78.9 7.82 71.6 8.45 79.0 8.28 79.7 7.94 73.4 12.92 67.3 5.24 75.2 8.05 64.7 9.75 82.0 8.48 60.1 6.03 67.4 6.97 71.2 7.05 70.5 7.40 79.8 6.65 81.7 9.16 80.5 6.51 74.7 7.10 74.9 7.28 67.7 13.31 80.9 8.58 80.0 7.70 79.5 7.10 96.0 8.09 75.0 Meteorological 7 9 12 9 9 10 11 8 12 1 0 1 0 1 3 12 1 0 1 2 9 9 10 1 3 7 9 10 10 10 8 12 8 7 7 Magazine, 24 1 8 28 1 5 32 25 1 9 1 9 42 19 10 29 23 3 1 23 36 1 7 29 1 2 24 23 27 22 24 1 4 28 17 20 30 vol. 87, 3 4 6 3 5 5 5 4 8 4 3 7 6 6 6 5 3 5 5 3 4 5 5 5 3 7 4 3 4 Sept. 1958,
5 6 May, 1960
ST
52 0 0 0
1 5 0 0
TERR AlN CORRESPONDING
I 0
00
TO E A C H CURVE GIVEN
IN T A B L E 2 .
C5 0 0
LL Yn
Z 3 0300
E
C3 W>
0m
42 0 0
t-
I C3-
W I N100
5 0
@
30
1.0
1.5
2
2 - 5
3
4
5
6 7
8 9 1 0
FIG. 4.-ROUGHNESS FACTORS ( k ~ ) FOR DETERMINING THE RATIO O F GRADIENT TO SURFACE WIND SPEEDS OVER DIFFERENT TYPES O F TERRAIN
ST 5 DESIGN WIND VELOCITIES 57 is either the so-called 'effective height' of the anemometer or the actual height given in the "Gazetteer ;" in s o m e c a s e s , owing to poor exposure, neither height is entirely satisfactory.
F r o m the s a m e descriptions given in the Gazetteer, a Q-factor was d e t e r - mined f o r the anemometer s i t e , based upon an a s s e s s m e n t of the absence ( o r presence) of (a) possible orographic influences, (b) buildings a n d other local shieldingand amplifying influences, and (c) the uniformity of the roughness f o r different wind fetches (particularly in a generally westerly direction, the d i - rection of prevailing winds). Unfortunately, i t w a s not possible to a s s e s s a n - other important influence on the r e c o r d s , namely, the number of times the an- ometer had been moved during the period of r e c o r d .
These values of Q ( a s s e s s e d out of a possible total of fifteen) w e r e multiplied by the s q u a r e r o o t of the number of y e a r s of r e c o r d
(m,
and a 'weight' p r o - portional to t h i s product (in round numbers) is recorded in Table 3. On t h i s basis, stations with higher weights were judged to be m o r e r e l i a b l e than those with relatively lower weights. It was found that estimates of U and l / a devi- ating substantially from the a v e r a g e can always be associated with unsatis- factory anemometer exposures (such a s cliff o r hill-top sites), partially shield- ed s i t e s , o r stations with only s h o r t period records;consequently, weights a r e low. The l a r g e proportion of coastal and u r b a n s i t e s indicates that, in many c a s e s , the exposure leaves much to be desired.In o r d e r not to bias the r e s u l t s , a s s e s s m e n t s of the roughness categoryand Q-factor w e r e made, a s f a r a s possible, without reference to t h e already de- termined values of l / a and U. In a m o r e detailed analysis, r e f e r e n c e to mean annual wind speeds and direction r o s e t t e s would, perhaps, a s s i s t in a s s e s s i n g roughness categories and in revealing any anomalous directional properties of the s u r f a c e winds.
The estimated values of l / a and U for the gradient wind, obtained from the roughness factor and the s u r f a c e values of t h e s e p a r a m e t e r s a r e recorded i n Table 3 and a r e s u m m a r i z e d graphically in Fig. 5.
Also shown i n Fig. 5 a r e contours of U and l / a ; these a r e drawn by eye and a r e based on the assumption that the average p r o p e r t i e s of the gradient wind f i e l d a r e not subject to widevariation o v e r a n a r e a thesize of the British Isles. The map shown in Fig. 5 might form the b a s i s for determining design wind velocities.
nlustrative Example.-If, f o r example, it i s desired to e r e c t a s t r u c t u r e a t s o m e locality on the (U = 80 mph; l / a = 8.0 mph) contour to have an anticipated lifetime T = 10 y r with a r i s k q = 10% that thedesign wind velocity is exceeded during this period, then the r e q u i r e d r e t u r n p e r i o d for this design wind speed
T 10
is R = - = - = 100 y r . The 'design gradient wind velocity' (vG) i s then given q 0.1
= 80 + 8.0 x 4.6 = 117 mph
This, in fact, gives the e x t r e m e mean hourly velocity for the gradient wind. Recent unpublished information indicates that t h e mean minute wind velocity
58 May, 1960
L E G E N D : 9 0 : 9 . 0
@
L O C A T I O N OF S T A T I O N SHOWN BY CIRCLE.I
I I U N I T S - M I L E S P E R H O U R .U : l/o WEIGHT
FIG. 5.-PARAMETERS O F EXTREME MEAN HOURLY GRADIENT
ST 5 DESIGN WIND VELOCITIES 5 9 (advocated in this r e p o r t ) is on the average 25O/0 g r e a t e r than t h i s and s o the e x t r e m e 'mean minuteJ speed is 117 x 1.25 = 146 mph.
If, now, the s t r u c t u r e is to be erected in a town, f o r which (from Table 3) ZG is 1,500 ft and l / a = 1/3, the design wind velocity a t height z (ft) is given
and V ~ O O = 59 mph.
F o r open country without obstructions the expression would b e
and V ~ O O = 106 mph.
Finally, if the s t r u c t u r e is to be erected i n the center of a l a r g e city, the design wind velocity would be given by
and VIOO = 46 mph.
The f u r t h e r difficult and largely unresolved problems of a s s e s s i n g the marked influence of the wind velocity profile on the p r e s s u r e distribution, a n d of determining what dynamic amplification may a r i s e due to the unsteady flow of gusts, l i e outside the province of this paper which h a s attempted merely t o discuss the derivation of a basic design mean velocity to which, i t is felt, these other f a c t o r s can then be related.
ACKNOWLEDGMENTS
The w r i t e r wishes to e x p r e s s h i s thanks to H. C. Shellard, Head of the Cli- matological S e r v i c e s Division of the Meteorological Office, London, England, f o r allowing the w r i t e r to examine his calculation sheets. The w r i t e r also ex- p r e s s e s h i s appreciation to W. R. Schriever and D. W. Boyd of t h e Division of Building Research, National R e s e a r c h Council, Ottawa, Canada, for helpful c r i t i c i s m and a s s i s t a n c e in the preparation of the paper.
This is a contributionfrom the Division of Building Research, National Re- s e a r c h Council of Canada, and is published with the approval of t h e Director of the Division.
APPENDIX I.--BIBLIOGRAPHY
1. "Physics of the Air," by W. J. Humphreys, McGraw-Hill Book Co., Inc., New York, 3 r d edition, 1940, pp. 129-136.
2. "Structure of Wind over Level Country," by M. A. Giblett, e t al.,Geophys. Mem. No. 54, Met. Office, London, 1932.
3. "Vibrations of Structures," by Franklin P. Ulrich and Dean S. Carder, Proceedings of Symposium on Earthquake and Blast, Los Angeles, Calif., June, 1952, p. 130.
60 May, 1960 S T 5 4. 'Wind F o r c e s on a T a l l Building," by J. Charles Rathbun, Transactions,
ASCE, Vol. 105, 1940, pp. 1-41.
5. 'Wind Structure in Winter Storms," by R. H. Sherlock and M. B. Stout, Journal of Aeronautical Sciences, Vol. 5, No. 2, December, 1937, pp. 53- 61.
6. "Physical and Dynamical Meteorology," by D. Brunt, Cambridge Univ. P r e s s , 2nd edition, 1952, p. 114.
7. "Atmospheric Turbulence," by 0 . G. Sutton, Methuen and Co., Ltd., 1949, p. 20.
8. "Relation of Gustiness to Other Meteorological P a r a m e t e r s ,
"
by I. I. Singer and M. E. Smith, Journal of Meteorology, Vol. 10, April, 1953,pp. 121-124. 9. "The Climate Near the Ground," by Rudolf Geiger, H a r v a r d Univ. P r e s s ,1950.
10. "Outer PrecipitationBands of Hurricane Ednaand Ione," by EdwinKessler, Bulletin of the A m e r . Meteorological Soc., Vol. 38, No. 6, June, 1957, p. 335.
11. "Variation of Wind with Height," by B a r k a t Ali, Quarterly Journal, Royal Meteorological Soc., London, Vol. 58, 1932, pp. 285-288.
12. "Some Results of the Investigation of Gradients i n the Vicinity of Oil- drilling Derricks," by N. P . Goptarev, Trudy Gosudarst venny. okeano- grafichesky institut, Moscow, Vypusk 36, 1957, p. 128.
13. "Measuring Wind Velocities a t Varying Heights Above Ground," by J. Juul, Organizationfor European Economic Co-operation, Final Report of work- ing group No. 2, "Wind Power," 1954.
14. "Some C h a r a c t e r i s t i c s of Eddy Motionin t h e Atmosphere," by F. J. S c r a s e , Geophys. Mem. No. 52, Met. Office, London, 1930.
15. "Wind P r e s s u r e s and the Designof Radio and High T r a n s m i s s i o n T o w e r s , " by S. P . Wing, Electrician, Vol. 87, No. 2250, July 1, 1921, pp. 6-10. 16. "Variation of Wind Velocity and Gusts With Height," by R . H. Sherlock,
Transactions, ASCE, P a p e r 2553, 1953.
17. "Wind Velocity i n Relation to Height Above Ground," by W. W. Pagon, Engineering News-Record, Vol. 114, No. 21, May 23, 1935, pp. 742-51. 18. "The Velocity Profile i n the Lowest 400 Ft," by R. F r o s t , Meteorological
Magazine, Vol. 76, 1947, p. 14.
19. UMicrometeorology, A Study of Physical P r o c e s s e s in the Lowest L a y e r s of the E a r t h ' s Atmosphere," by 0. G. Sutton, McGraw-Hill Book Co., Inc., New York, 1953, p. 238.
20. "Gust Variation with Height up to 150 M e t r e s , " by E . L. Deacon, Q u a r t e r - ly Journal, Royal Meteorological Soc., Vol. 81, London, 1955, p. 562. 21. "Wind Structure Near the Ground and i t s Relation to T e m p e r a t u r e Gradi-
ent," by G. S. P . Heywood, Quarterly Journal, Royal Meteorological Soc., Vol. 57, London, 1931, p. 433.
ST 5 DESIGN WIND VELOCITIES 61 22. "Studies on Natural Wind P r e s s u r e on Buildings and Other Structures," by I. Kamei, Building R e s e a r c h Inst. of Japan, Vol. 1, No. 16, March, 1955. 23. "An Experimental Study of Wind Structure with Reference to the Design and Operationof Wind Driven Generators," by M. P . Wax, B r i t i s h Electri- cal and Allied Ind. Res. Assoc., Tech. Report C/T114, 1956.
24. Daniel Guggenheim Airship Inst. Report No. 156, by P . 0. H u s s and D. J Portman, Akron Univ., Ohio, 1949.
25. "Wind messungen an den Quickborner Funkmasten 1947 -8," by E. Francken- b e r g e r and W. Rudloff, Met. Amt. fiir N. W. Deutsch, Hamburg, 1949. 26. Discussion of R.H. Sherlock's "Variation of Wind Velocity and Gusts with
Height," by I. I. Singer and M. E. Smith, Transactions, ASCE, Vol. 118, 1953, p. 493.
27. "Survey of Meteorological F a c t o r s Pertinent to Reduction of Loss of Life and P r o p e r t y in Hurricane Situations," by U. S. Weather Bur., Nat. H u r r i - cane R e s e a r c h Proj., Washington, D. C., Report no. 5, March, 1957. 28. "Statistical P r o p e r t i e s of the Vertical Flux and Kinetic Energy a t 100
Metres," by H. A. Panofsky, Pennsylvania State College, Mineral Indus- t r i e s Exp. Station, Div. of Meteorology, Scientific Report No. 2, 1953. (AFCRC Contract No. A F 19(604) -166).
29. "4th Report on Wind Structure," by J . S. Dines, Aeronautical Research Council, R e p o r t s and Memoranda, Report 1912 -1913, London, pp. 310-330. 30. "Determining Basic Wind Loads," by G. F. Collins, Proceedings, ASCE,
Vol. 81, November, 1955.
31. "Wind P r e s s u r e on a Model of the E m p i r e State Building," by Hugh L. Dryden and George C. Hill, Journal of R e s e a r c h of the Natl. Bur. of Stan- dards, Vol. 10, 1933, pp. 493-523.
-
,
32. "The Nature of the Wind," by R. H. Sherlock, Proceedings, ASCE, Vol. 84, No. ST4, July, 1958.33. "Climate of Central Canada," by W. G. Kendrew and D. C u r r i e , Edmond Cloutier, Queen's P r i n t e r , Ottawa, 1955, p. 150.
34. "Climatic S u m m a r i e s f o r Selected Meteorological Stations i n Canada," by C. C. Boughner and M. K. Thomas, Vol. 11, Dept. of T r a n s p o r t , Meteoro- logical Division, Toronto, May, 1948, pp. 1-88.
35. " C h a r a c t e r i s t i c s of United States H u r r i c a n e s Pertinent to Levee Design for Lake Okeechobee, Fla.," by U. S. Weather Bur., H ~ d r o m e t e o r o l o g i c a l Report, No. 32, 1954.
36. "Wind Loads on Buildings," by H. Ferrington, Structural Engineer, Vol. 21, No. 12, December, 1943, pp. 497-526; Vol. 22, No. 1, January, 1944, pp. 15-40.
37. "Comparison of Surface and Upper Winds a t Valentia," by L. H. G. Dines, Professional Notes, Meteorological Office, Vol. 6, No. 83, London, 1938. 38. "Variations in Wind Velocity Near the Ground," by N. C a r r u t h e r s , Q x -