HAL Id: hal-02069465
https://hal.archives-ouvertes.fr/hal-02069465
Submitted on 15 Mar 2019
HAL is a multi-disciplinary open access
archive for the deposit and dissemination of
sci-entific research documents, whether they are
pub-lished or not. The documents may come from
teaching and research institutions in France or
abroad, or from public or private research centers.
L’archive ouverte pluridisciplinaire HAL, est
destinée au dépôt et à la diffusion de documents
scientifiques de niveau recherche, publiés ou non,
émanant des établissements d’enseignement et de
recherche français ou étrangers, des laboratoires
publics ou privés.
Chemical and Biological Pretreatments on Sugarcane
Bagasse to Enhance its Enzymatic Hydrolysis.
Christian Hernández, Fabio Ziarelli, Isabelle Gaime, Anne Marie Farnet da
Silva, Gabriela García, José García-Pérez, Beatriz Gutierrez-Rivera, Enrique
Alarcón
To cite this version:
Christian Hernández, Fabio Ziarelli, Isabelle Gaime, Anne Marie Farnet da Silva, Gabriela García, et
al.. Chemical and Biological Pretreatments on Sugarcane Bagasse to Enhance its Enzymatic
Hydrol-ysis.. ChemistrySelect, Wiley, 2017, 2 (15), pp.4213-4218. �10.1002/slct.201700425�. �hal-02069465�
z
Energy Technology &
& Environmental Science
Chemical and Biological Pretreatments on Sugarcane
Bagasse to Enhance its Enzymatic Hydrolysis.
Christian A. Herna´ndez,
[a]Fabio Ziarelli,
[b]Isabelle Gaime,
[c]Anne Marie Farnet Da Silva,
[d]Gabriela Garcı´a,
[e]Jose´ A. Garcı´a-Pe´rez,
[f]Beatriz Gutie´rrez-Rivera,
[g]and Enrique Alarco´n*
[e]Alkaline and biological lignocellulose pre-treatments are com-monly used to enhance enzymatic hydrolysis and improve ethanol production. In this study,13C CPMAS NMR spectroscopy was used to describe changes in sugarcane bagasse (SCB) pre-treated with NaOH, Ca(OH)2 and with Pycnoporus sanguineus. Changes in the contents of alkyl C, Carboxyl C, Aromatic C (tertiary, quaternary and p-hydroxyphenyl C), O-alkyl C, amino acids, ergosterol and chitin, as well as in the crystallinity index of cellulose were observed. Through a multivariate analysis, relations between changes in the chemical composition of SCB and enzymatic hydrolysis were established. P. sanguineus promotes better lignin decay, glucose release and hydrolysis yields than chemical pre-treatments, and increases the amount
of amino acids and ergosterol in SCB, while NaOH increases the cellulose crystallinity index. The hydrolysates were fermented with Saccharomyces cerevisiae for 96 h, and analysed through HPLC. The initial composition of the hydrolysates [mg.ml@1] and biomass production (cells.ml@1) were then related to the ethanol production and fermentation yields. We found that ethanol production and fermentation yields were negatively correlated with cell growth in Saccharomyces, but positively correlated with glucose consumption in the P. sanguineus pre-treatment. We conclude that the biological pre-treatment using P. sanguineus in the conditions hereby described, has a potential to increase ethanol productivity.
Introduction
Sugarcane bagasse (SCB) is a promising source of raw material for bioethanol production[1]through enzymatic hydrolysis. The efficiency of this method depends on a pre-treatment aimed at reducing the crystallinity of the raw material, as well as its hemicellulose and lignin content, lignin being a cellulase adsorbent.[2,3]Thus, for an efficient lignocellulose hydrolysis, a pretreatment is necessary in order to decrease lignin, the cellulose-crystallinity index, and the hemicellulose content.
A good pre-treatment includes alkaline agents like NaOH, Ca(OH)2 and KOH.[4] Alkali attacks lignin via saponification of ester-linkages between cellulose and hemicellulose with lig-nin,[5] although it may generate alkaline-cellulose by ion exchange.[6] Also, as opposed to acids, alkaline agents for biomass delignification rarely generate compounds that are harmful to microorganisms.[7]
Biological pre-treatments using live fungi, on the other hand, have been found to enhance enzymatic hydrolysis.[8] Fungi (mainly white-root fungi) can oxidize lignin via phenolox-idase enzymes (i.e., laccases, Mn-peroxphenolox-idases, lignin perox-idases) and produce cellulases and hemicellulases (e.g. xyla-nases), decreasing the stock of polysaccharides and, consequently, the production of bioethanol. And since fungi also transform some lignocellulose material into fungal bio-mass, the outcome is a different raw material altogether. The structural characterization of SCB fibres pre-treated with live fungi is key to the understanding of how fungal enzymes affect fibre composition, and how this structural composition affects in turn the hydrolysis/fermentation processes downstream. Classical methods for fibre analysis based in subsequent
[a] Dr. C. A. Hern#ndez
Universidad Polit8cnica de Huatusco, Unidad Acad8mica de Orizaba
Calle Oriente 4A, C.P. 94740, Orizaba, Veracruz, Mexico; [b] Dr. F. Ziarelli
Aix Marseille Universit8, Facult8 des Sciences et Techniques de Saint-J8r-ime
Spectropole, PO box 512,
Avenue Escadrille Normandie Ni8men, 13397 Marseille cedex 20, France [c] Dr. I. Gaime
Equipe Ecotechnologies et Bioremediation,
IMBE, UMR CNRS 7263, IRD 237, Facult8 des Sciences et Techniques de St. J8rime,
Aix Marseille Universit8, Marseille, France. [d] Dr. A. M. Farnet Da Silva
Equipe SystHmes Microbiens IMBE, UMR CNRS 7263, IRD 237,
Facult8 des Sciences Techniques de St. J8rime, Aix Marseille Universit8, Marseille, France.
[e] G. Garc&a, Dr. E. Alarcjn
Instituto de Biotecnolog&a y Ecolog&a Aplicada (INBIOTECA), Universidad Veracruzana,
Av. de las culturas veracruzanas 101, Col. Emiliano Zapata, C.P. 91090, Xalapa Veracruz, Mexico
E-mail: enalarcon@uv.mx [f] Dr. J. A. Garc&a-P8rez
Faculty of Biology, Universidad Veracruzana,
Cto. Gonzalo Aguirre Beltr#n s/n, Col. Emiliano Zapata, Xalapa, Veracruz 91090, Mexico.
[g] Dr. B. Guti8rrez-Rivera
Instituto Tecnoljgico Superior de Tierra Blanca, Tierra Blanca, Veracruz 95180, Mexico.
Supporting information for this article is available on the WWW under https://doi.org/10.1002/slct.201700425
Full Papers
DOI: 10.1002/slct.201700425
4213
detergent hydrolysis (e.g. Van Soest and Wine[9]) are not enough to explain the complex modifications of lignocellulose fibre by fungi or chemical pre-treatments. Thus, for lignocellu-lose characterization, the use of other techniques, such as near infrared spectroscopy (FTIR) and 13C solid-state nuclear mag-netic resonance (NMR), are preferred.
13C CPMAS NMR spectroscopy is a powerful technique of analysis, successfully used on soil litter,[10] the lignification process,[11] and the extent of condensation in lignin character-isation,[12]and can also be used to evaluate changes in fungal biomass.[13]Solid-state NMR allows for chemical analysis to be carried out in a natural state, and is an excellent choice for samples with restricted solubility, as are lignin residues, or when the physical structure of cellulose is to be examined.[14] Therefore, the aim of this study was to characterize SCB fibre by 13C CPMAS NMR spectroscopy after a biological pre-treat-ment, using the fungus Pycnoporus sanguineus and two alkaline pre-treatments with NaOH and Ca(OH)2. For more details see SI. After that, pre-treated SCB was hydrolysed with Aspergillus niger cellulases and fermented with Saccharomyces cerevisiae, and the yields of both steps were related to their structural composition using multivariate statistical methods.
Results and Discussion
Chemical shifts in SCB submitted to different pre–treatments Both chemical and biological pre-treatments lead to changes in the chemical composition of SCB. The O-alkyl C signal (45-110 ppm) corresponds to the carbohydrate (i.e., holocellulose) content of SCB, indicating that the original composition of SCB had 79.76% holocellulose, and that after an alkaline pre-treatment the proportion increased to 88.86% with NaOH, and to 84.13% with Ca(OH)2 (Figure 1). Conversely, biological
pre-treatment decreased the amount of holocellulose to 50.65%. The aromatic C region, which corresponds to lignin, had an original proportion of 12.87 %, and the pre-treatments de-creased this value as follows: Ca(OH)2 to 10.26%, NaOH to 7.03%, and P. sanguineus to 6.53%. All treatments led to a decrease in aromatic C content, but the highest lignin decay was achieved with P. sanguineus (Table 1).
The values of the regions Carboxyl C and Alkyl C are associated to proteins and lipids, and their peaks correspond to the acetate groups in the hemicellulose that appears in this region. Taking them together, they were very low in the original composition of SCB (3.57% and 2.45%, respectively). Alkaline pre-treatments diminish the amount of Carboxyl C to 1.48% (NaOH) and 1.60% [Ca(OH)2], and in general they did not affect the Alkyl C region. On the other hand, the pre-treatment with P. sanguineus strongly increased both regions: Carboxyl C in-creased to 9.31%, and Alkyl C to 33.49% (Figure 1).
The signals corresponding to the Ca, Cb and Cd of amino acids increased with the treatments with P. sanguineus from 5.61% to 18.38% (as did the signals corresponding to chitin and the Cg of amino acids, from 3.47% to 8.49%), whereas alkaline treatments diminished or did not change those signals (Figure 1). The ergosterol signal was near to 0 in the original composition of SCB, and remained the same after the alkaline pre-treatments. However, when P. sanguineus was used, ergo-sterol increased from 0.24% to 4.33 %. Thus, P. sanguineus transformed a portion of SCB into fungal biomass, as was hypothesized at the beginning.
The proportion of amorphous cellulose and crystalline cellulose, estimated by the signal position of the C4 of pyrano-glucose,[20]indicates that SCB has an original crystallinity index (CI) of 0.29. This value changed slightly according to the pre-treatments employed: SCB pre-treated with NaOH increased its CI to 0.32, decreased to 0.27 when Ca(OH)2 was used, and
Figure 1. 13C CPMAS NMR spectra of sugarcane bagasse before after pretreatments (indicated with colours). Important regions are shown.
remained unchanged with the P. sanguineus pre-treatment. This indicates that NaOH promotes amorphous cellulose removal, which may affect the performance of hydrolysis. Finally, the signals of aromatic carbons decreased in all treatments, P. sanguineus being the treatment that obtained the highest decrease of aromatic carbons, followed closely by the SCB pre-treated with NaOH, and then by the SCB pre-pre-treated with Ca (OH)2.
Hydrolysis step
In all treatments, cellulase activity decreased rapidly within the first 24 hours, while total sugar content increased within the first 24 hours, remaining almost unchanged afterwards (Fig-ure 2).
The area under the curve of FPU activities showed that when SCB pre-treated with P. sanguineus (99.21 FPU for 96 h) and NaOH (115 total FPU for 96 h) was hydrolysed, the enzymatic stability was higher. Conversely, less FPU activity was registered in treatments with SCB pre-treated with Ca(OH)2 (56.91 total FPU in 96 h), and with untreated SCB (57.33 total FPU for 96 hours). Cellulase stability was positively correlated with O-alkyl C, Xylan C4 and Cellulose crystallinity, and negatively correlated with Alkyl C, Carboxyl C, carbon amino acids, chitin and ergosterol (Table 2).
Like total reducing sugars release, glucose production was faster within the first 24 h of hydrolysis. SCB pre-treated with P. sanguineus produced the highest amount of glucose (29.76 :
Table 1. Regions of13C CPMAS NMR spectra utilized for assess chemical
shifts in SCB
Component Position (ppm) Reference Alquil-C region
Aminoacids carbon g Aminoacids carbon b CH3of quitin
Ergosterol and deri-vates C4, C24, C20, C13, C10 O-alquil C Region Cellulose crystallinity index Aminoacids carbon a Aminoacids carbon d Xylane C4 Aromatic C Region Aromatic tertiary C Aromatic quaternary C p-hydroxyphenyl Carboxil-C Region Quitin C=O
Carbon of COOH from aminoacids 0-45 16.1-24.7 28-37.6 23.32 37.05-42.85 45-110
Is calculated by dividing the total area of the crystalline peak (87 to 93 ppm) by the total area assigned to the C4peak (80 – 93 ppm). 53.5-61.3 47.5-49.2 81.2 – 81.7 110 – 160 110-123 123-160 157-162 160-190 173.7 170.9-174.5 [15] [15] [15] [16] [17,18,19] [20] [15] [15] [21] [22] [22] [22] [16] [15]
Figure 2. Kinetics of the different parameters measured during the hydrolysis phase. a) glucose released, b) cellulase activity (FPU), c) saccharose released, d) total reducing sugars released. Different colours indicate different pretreat-ments. Middle points represent the means, and bars the standard error.
Full Papers
4215
2.2 mg.ml@1), followed by SCB pre-treated with Ca(OH) 2(28.19 : 0.45 mg.ml-1), NaOH (23.84 : 2.0 mg.ml@1), and the un-treated SCB (9.95 : 15.93 mg.ml@1) (Figure 2). Saccharose content decreased slightly during SCB hydrolysis in all treat-ments (Figure 2), reaching a final concentration of 4.38 : 0.36 mg.ml@1 when pre-treated with Ca(OH)
2, 4.26 : 0.4 mg.ml@1 when pre-treated with P. sanguineus, 3.66 : 0.3 mg.ml@1 when pre-treated with NaOH, and 1.48 : 2.4 mg.ml-1 when untreated (Figure 2).
The glucose released was positively correlated with alkyl C, carboxyl C, amino acids content, chitin and ergosterol. These variables positively affected the hydrolysis yield too (Table 2). Meanwhile, cellulose crystallinity, aromatic C, and tertiary, quaternary and p-hydroxyphenyl aromatic C, negatively af-fected glucose release and the hydrolysis yield. Saccharose was positively correlated with the variables associated to the presence of fungal biomass, and negatively correlated with lignin compounds (aromatic carbons) (Table 2).
The treatment that promoted the highest glucose and hydrolysis yield was P. sanguineus.
The highest hydrolysis yield was achieved when SCB was pre-treated with P. sanguineus, followed by pre-treatments with Ca(OH)2 and NaOH. The lowest yield was obtained with untreated SCB. The fungal biomass gain did not negatively affect enzymatic hydrolysis. In fact, the highest hydrolysis yield was obtained with SCB pre-treated with P. sanguineus. The effect of proteins or lipids on cellulase catalysis is not well documented, but it is known that some lipids can act as surfactants, and avoid the absorption of cellulases by cellulose, increasing the hydrolysis yield.[23,24]Some proteins, like bovine serum albumin, can perform the same role.[25]
Thus, the enrichment of proteins and ergosterol by the pre-treatment with P. sanguineus lead to a decrease in the absorption of cellulase by the SCB fibre, improving enzymatic hydrolysis. The decay in the aromatic C and O-alkyl C regions in this pre-treatment are mainly due to the production of laccases
and cellulases (as previously reported[27]). Many authors suggest that this fungus is a good producer of laccase,[26,28] and therefore an excellent choice for delignification processes.[29]
According to our Principal Component Analysis, the hydrolysis yield was mainly affected by the content of aromatic C and xylan C4, which, as previously reported,[2]corresponds to the content of lignin and hemicellulose. The cellulose crystal-linity index (CI) was negatively related to the hydrolysis yield, according to Mussato et al..[3] In this study, the pre-treatment with NaOH increased CI, which is related to lower hydrolysis, compared to the SCB pre-treated with P. sanguineus. Pre-treatments with NaOH and Ca(OH)2 (of less effect) increased cellulose crystallinity, but also increased the O-alkyl region and cellulase stability. Untreated SCB had the highest amounts of lignin compounds, and was negatively associated to the release of glucose and the hydrolysis yield (Figure 3).
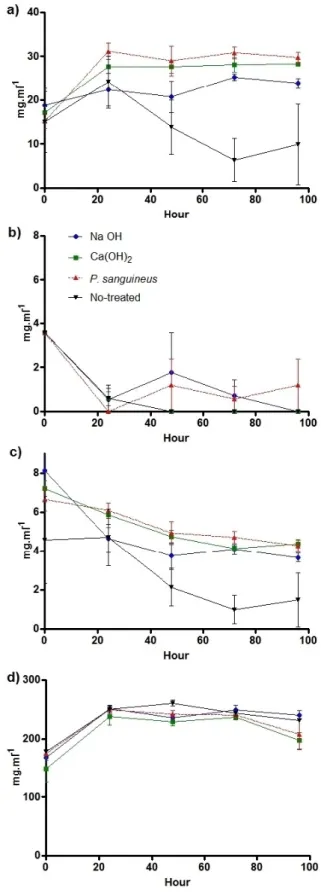
Fermentation step
As with enzymatic hydrolysis, SCB pretreated with P. sanguineus had the highest fermentation yield and the second highest production of ethanol. Differences in the hydrolysis yield led to differences in the initial glucose content of the fermentation cultures (Figure 3). Glucose decreased near to 0 mg.ml@1 in all treatments after 48 h of culturing with S. cerevisiae, while saccharose metabolized more slowly (Figure 3).
On the other hand, S. cerevisiae biomass (Figure 4) and ethanol increased after 96 h. S. cerevisiae cell growth (biomass) was positively correlated with the glucose consumed, but negatively related with the fermentation yield and ethanol production (Table 3).
A negative effect of hydrolysates pretreated with P. sanguineus on S. cerevisiae biomass was observed, which could be related to a secondary metabolite produced by fungus during the pretreatment. Cinnabarin and poliporin, produced by P. sanguineus, have antimicrobial properties;[30,31] however, non-antifungal metabolites have been reported for this fungus. In fact, hydrolysed SCB pre-treated with P. sanguineus does not completely inhibit the growth of S. cerevisiae, although it does induce cell compilation. This interesting phenomenon needs further study.
SCB hydrolysates pre-treated with NaOH (3.26 : 0.3 mg-ml@1) and P. sanguineus (2.99 : 0.2 mg.ml@1) were the ones that produced more ethanol, followed by untreated SCB (2.11 : 0.8 mg.ml@1) and SCB pre-treated with Ca(OH)
2 (1.50 : 0.3 mg.ml@1) (Figure 3). The highest fermentation yield was attained from the hydrolysate of SCB pre-treated with P. sanguineus, followed by untreated SCB, SCB pre-treated with NaOH, and, finally, SCB pre-treated with Ca(OH)2.
No strong relations were observed between those variables measured with ethanol production and fermentation yields. Nevertheless, a PCA biplot indicates that the hydrolysed composition resulting from SCB pre-treated with P. sanguineus reached better ethanol and fermentation yields (Figure 4), while the least efficient pre-treatment was that with Ca(OH)2.
Having examined the effects of alkaline and biological pre-treatments on the downstream process, we suggest that when
Table 2. Pearson correlations (r) between chemical components of pre-treated SCB and hydrolysis products/enzymatic activity. Compounds Cellulase
stability Glucosereleased Hydrolysisyield Saccharose fi-nal content Alkyl C -0.592 0.746 0.923 0.435 Carboxyl C -0.500 0.545 0.786 0.158 Aromatic C 0.117 -0.653 -0.668 -0.739 O-alkyl C 0.597 -0.634 -0.847 -0.254 Aag+chitin -0.478 0.489 0.742 0.087 aaCbda -0.675 0.797 0.950 0.483 Ergosterol -0. 99 0.762 0.932 0.459 Xyl ne C4 0.497 -0.593 -0.823 -0.232 Cellulose CI 0.793 -0.311 -0.268 -0.036 Tertiary aromatic C 0.257 -0.757 -0.740 -0.833 Quaternary aro-matic C 0.057 -0.604 -0.632 -0.694 p-hydroxyphenyl aromatic C 0.247 -0.736 -0.633 -0.908
Full Papers
the aim is to produce ethanol, the use of P. sanguineus is preferable to the use of NaOH or Ca(OH)2, since it leads to higher hydrolysis and fermentation yields than alkali treat-ments. Further studies will focus on the effect of ergosterol and fungal proteins on cellulase catalysis, and the use of other fungus in the SCB pre-treatment.
Conclusions
In summary, both alkaline and biological pre-treatments were able to decrease the intensity of aromatic C (lignin) signals. However, biological pre-treatments converted a portion of the O-alkyl C (carbohydrates) into fungal biomass (lipids and proteins). The ergosterol and protein gained by the SCB fibre by the pre-treatment with P. sanguineus might be a positive factor to enhance the hydrolysis yield. These beneficial effects include better fermentation yields than the ones obtained by hydrolysates from SCB pre-treated with alkaline solutions.
Supporting Information Summary
For experimental details, such as chemical and biological treatments, enzymatic hydrolysis and fermentation, and ana-lytical methods (13C CPMASNMR), and statistics, please refer to the Supporting Information (SI).
Acknowledgements
The authors would like to thank the anonymous reviewers of this paper, as well as the Universidad Veracruzana for its support, the academic group Structure and Functioning of Ecosystems (CAUVER-324), and also to the biologist F. Ramı´rez-Guille´n, from INECOL A.C., Xalapa, Mexico, for the taxonomical identification of the fungus. Finally, authors would like to thank to the ECOS-NORD-CONACYT-ANUIES project (M13 A02) for the financial support.
Conflict of Interest
The authors declare no conflict of interest.
Figure 3. Kinetics of the different parameters measured during fermentation. a) glucose consumption, b) S. cerevisiae cell growth, c) ethanol production, d) saccharose consumption. Different colours indicate different pretreatments. Middle points represent the means, and bars the standard error.
Figure 4. Principal component analysis. The biplot shows the relationship between the different pre-treatments (qualitative variables) with all the parameters measured during hydrolysis and fermentation.
Full Papers
4217
Keywords: alkaline pretreatment · bioethanol · cellulose crystallinity · Pycnoporus sanguineus
[1] C. A. Cardona, J. A. Quintero, I. C. Paz. Bioresour. Technol. 2010, 101(13), 4754–4766.
[2] M. Hall, P. Bansal, J. H. Lee, M. J. Realff, A. S. Bommarius. FEBS Journal 2010, 277, 1571–1582.
[3] S. I. Mussato, M. Fernandes, A. M. F. Milagres, I. C. Roberto. Enzyme Microb. Technol. 2008, 43(2), 124–129 doi:10.1016/j.enzmic-tec.2007.11.006
[4] R. Maryana, D. Ma’rifatun, A. Wheni, K. W. Satriyo, W. Angga. Energy Procedia 2014, 47, 250–254.
[5] Y. Sun and J. Cheng. Bioresour. Technol. 2002, 83, 1–11.
[6] H. Bahar, H. Vu–Manh, T. Bechtold. Lenzinger Berichte 2009, 87, 142–150. [7] O. Yemis, G. Mazza. Bioresour. Technol. 2011, 102, 7371–7378.
[8] F. Nazarpour, D. K. Abdullah, N. Abdullah, R. Zamiri. Materials 2013, 6, 2059–2073.
[9] P. J. Van Soest, R. H. Wine. J. Assoc. Off. Anal. Chem. 1968, 51, 780–785. [10] E. Alarcjn-Guti8rrez, C. Floch, C. Augur, J. Le Petit, F. Ziarelli, S. Criquet.
Pedobiologia. 2009, 52, 387–399.
[11] N. Terashima, R. H. Atalla, D. L. Vanderhart. Phytochemistry 1997, 46(5), 863–870.
[12] T. Liiti-, S. L. Maunu, J. Sipil-, B. Hortling. Solid State Nucl. Magn. Reson. 2002, 21(3-4), 171–186
[13] O. Fricˆov#, M. Koval’akov#. ISRN Analytical Chemistry 2013, DOI /10.1155/ 2013/248164
[14] S. L. Maunu. Prog. Nucl. Magn. Reson. Spectrosc. 2002, 40, 151–174. [15] S. K. Straus, T. Bremi, R. R. Ernst. J. Biomol. NMR. 1997, 10, 119–128. [16] K. Van de Velde, P. Kiekens. Carbohydr. Polym. 2004, 58, 409–416. [17] J. M. Yue, S. N. Chen, Z. W. Lin, H. D. Sun. Phytochemistry. 2001, 56, 801–
806.
[18] F. Wang, Y. Fang, M. Zhang, A. Lin, T. Zhu, Q. Gu, W. Zhu. Steroids. 2008, 73, 19–26.
[19] R. L. Toh Choon, M. Sariah, M. N. Siti Mariam. J. Basic Microbiol. 2012, 52, 608–612.
[20] S. Park, J. O. Baker, M. E. Himmel, P. A. Parrilla, D. K. Johnson. Biotechnol. Biofuels 2010, 3,10 http://www.biotechnologyforbiofuels.com/content/ 3/1/10
[21] K. Wickholm, P. T. Larsson, T. Iversen. Carbohydr. Res. 1998, 312, 123– 129.
[22] H.B. B. Hallac, P. Sannigrahi, Y. Pu, M. Ray, R. J. Murphy, A. J. Ragauskas. J. Agric. Food. Chem. 2009, 57, 1275–1281.
[23] S. Helle, S. J. B. Duff, D. G. Cooper. Biotechnol. Bioeng. 1993, 42(5), 611– 617.
[24] T. Eriksson, J. Bçrjesson, F. Tjemeld. Enzyme Microb. Technol. 2002, 31(3): 353–364.
[25] B. Yang, C. E. Wyman. Biotechnol. Bioeng. 2006, 94(4), 611–617. [26] S. B. Pointing, E. B. G. Jones, L. L. P. Vrijmoed. Mycologia 2000, 92(1),
139–144.
[27] J. Schaefer, E.O.R. , Stejskal. J. Am. Chem. Soc. 1976, 98, 1031–1032. [28] S. Vikineswary, N. Adbullah, M. Renuvathani, N. Sekaran, A. Pandey,
E. B. G. Jones. Bioresour. Technol. 2006, 97, 171–177.
[29] A. Lomascolo, Uzan-Boukhris, I. Herpo[l-Gimbert, J@C. Sigoillot, L. Lesage-Meessen. Appl. Microbiol. Biotechnol. 2011, 92, 1129–1149 [30] E. F. A. Sm.nia, A. Sm.nia, C. Loguercio-Leite, M. L. Gil. J. Chem. Tec.
Biotechnol. 1997, 70, 57–59.
[31] L. H. Rosa, K. M. Gomes, C. C. Jacob, M. Capelari, C. A. Rosa, C. L. Zani. Mem Inst Oswaldo Cruz, Rio de Janeiro 2003, 98(7), 967–974.
Submitted: February 28, 2017 Accepted: May 9, 2017