HAL Id: hal-00316196
https://hal.archives-ouvertes.fr/hal-00316196
Submitted on 1 Jan 1997
HAL is a multi-disciplinary open access archive for the deposit and dissemination of sci-entific research documents, whether they are pub-lished or not. The documents may come from teaching and research institutions in France or abroad, or from public or private research centers.
L’archive ouverte pluridisciplinaire HAL, est destinée au dépôt et à la diffusion de documents scientifiques de niveau recherche, publiés ou non, émanant des établissements d’enseignement et de recherche français ou étrangers, des laboratoires publics ou privés.
Effect of equatorial ionization anomaly on the
occurrence of spread-F
P. T. Jayachandran, P. Sri Ram, V. V. Somayajulu, P. V. S. Rama Rao
To cite this version:
P. T. Jayachandran, P. Sri Ram, V. V. Somayajulu, P. V. S. Rama Rao. Effect of equatorial ionization anomaly on the occurrence of spread-F. Annales Geophysicae, European Geosciences Union, 1997, 15 (2), pp.255-262. �hal-00316196�
Effect of equatorial ionization anomaly on the occurrence of spread-F
P. T. Jayachandran1, P. Sri Ram1, V. V. Somayajulu2, P. V. S. Rama Rao11
Space Research Laboratory, Department of Physics, Andhra University, Visakhapatnam - 530 003, India
2Space Physics Laboratory, Vikram Sarabhai Space Centre, Trivandrum - 695 022, India
Received: 12 January 1996 / Revised: 20 May 1996 / Accepted: 22 July 1996
Abstract. The unique geometry of the geomagnetic field
lines over the equatorial ionosphere coupled with the E– W electric field causes the equatorial ionization anomaly (EIA) and equatorial spread-F (ESF). Ionosonde data obtained at a chain of four stations covering equator to anomaly crest region (0.3 to 33 °N dip) in the Indian sector are used to study the role of EIA and the associated processes on the occurrence of ESF. The study period pertains to the equinoctial months (March, April, September and October) of 1991. The ratios of critical frequency of F-layer ( f0F2) and electron densities
at an altitude of 270 km between Ahmedabad (33°N dip) and Waltair (20 °N dip) are found to shoot up in the afternoon hours on spread-F days showing strengthening of the EIA in the afternoon hours. The study confirms the earlier conclusions made by Raghava Rao et al. and Alex et al. that a well-developed EIA is one of the conditions conducive for the generation of ESF. This study also shows that the location of the crest is also important in addition to the strength of the anomaly.
1 Introduction
The sunset in the equatorial and low latitude ionosphere is characterised by a rapid rise in the height of the F-layer due to the enhancement of the eastward electric field before it reverts to westward, which forms a platform for the generation of various plasma irregula-rities. These irregularities which manifest themselves as diffuse echoes on ionograms are known as equatorial spread-F (ESF), and have a wide spectrum of scale sizes. The equatorial spread-F (ESF) shows significant longitudinal, latitudinal and seasonal dependence (Mar-uyama and Matuura, 1984; Tsunoda, 1985; Aarons, 1993; Rama Rao et al., 1996) in its occurrence
chara-cteristics. Tsunoda (1985) explained the seasonal varia-tion of spread-F in terms of the alignment of the solor terminator with the geomagnetic flux tube. Maruyama and Matuura (1984) explained the occurrence of ESF in terms of magnetic declination. But both the theories have their own limitations in explaining the ESF occu-rrence in any particular season. Maruyama and Ma-tuura (1984) and Mendillo et al. (1992) have shown that the presence of trans-equatorial wind inhibits the occurrence of spread-F.
Raghava Rao et al. (1988) reported that the ratio of electron densities at a fixed height of 270 km between a crest region station, Ahmedabad (dip 33°N) and a low latitude station, Waltair (dip 20 °N) increases from a factor of 8 to 30 at 18:30 on spread-F days. Recent day-glow studies made at Waltair (Sridharan et al., 1994) showed that prediction of spread-F is possible three hours in advance by using the day-glow intensity variation from the zenith over Waltair and those at 20 ° off the zenith pointing towards Ahmedabad (crest region). They inferred that a well-developed EIA provides the necessary conditions for ESF to occur. Raghava Rao et al. (1991) reported an equatorial temperature and wind anomaly (ETWA) at the thermo-spheric altitude characterised by the formation of two latitudinal regions of enhanced temperature on either side of a prominent trough at the equator. The zonal wind reaches maximum near the equator with two minima on either side of it. The trough in temperature and maximum in zonal wind are collocated with the trough of the EIA. The two maxima in temperature and the two minima in zonal wind are collocated at the crests. The configuration develops vertical wind that triggers the spread-F.
The theories and observations to date show that varied combinations of the background electron density, electric field (E–W), neutral wind and the presence of gravity waves play a significant role in the day-to-day variability in the spread-F occurrence.
In the present study, an attempt is made to show the role of a well-developed EIA on the occurrence of
equatorial spread-F (ESF) by using the ionosonde data from a chain of four ionosonde stations covering the region from equator to the northern crest of the equatorial anomaly in the Indian sector.
2 Data
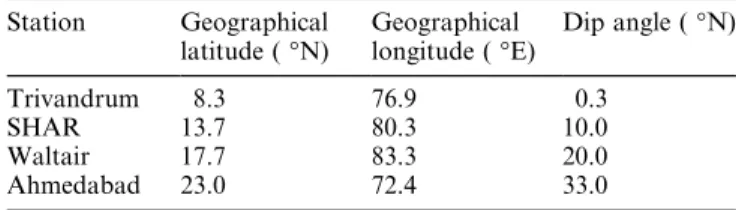
Ionosonde data from four Indian stations namely Trivandrum (an equatorial station), SHAR and Waltair (two low-latitude stations) and Ahmedabad (a station situated at the northern crest of the anomaly) are used for the present study. The geographic coordinates and the dip angles of these four stations are given in Table 1. The ionogram data used in the present study concerns the four equinoctial months (March, April, September and October) of the year 1991. Simultaneous data is limited to 34 days distributed during these four months. The ionograms from each of these stations are scaled for the critical frequency of the F-layer (f0F2) and
the minimum virtual height (h′F) of F-layer and also for the occurrence of spread-F. The data of these ionograms are also used for reducing the N-h profiles by using SPOLAN method proposed by Titheridge (1985).
3 Results
The occurrence of spread-F shows marked seasonal and solar cycle dependence. Further, in a given season and
for a given solar epoch, under identical ionospheric conditions, ESF might occur one day and might not on another day, making the day-to-day variability a complex problem. The nocturnal variation of h′F for four typical days is presented in Fig. 1. Even though the peak value of h′F for all the four days are at the same level ( 420 kms) spread-F was present only on 4th March and 16th March (Fig. 1a, c) while on the other two days i.e., on 6th March and 12th October (Fig. 1b, d) spread-F did not occur. The day-to-day variability in the occurrence of spread-F is explained in this study by taking into consideration of the strength of the equatorial ionization anomaly (EIA).
In the low-latitude regions, it is known that the critical frequency of the F-layer and thus the electron density vary significantly as a function of local time, influenced by the phenomenon of equatorial ionization anomaly (EIA). Therefore, a study of the ratio of the two parameters obtained from two different locations, one inside the anomaly crest and the other near the anomaly crest region allows us to determine the changes in the strength of the anomaly. Thus, in the present case, the changes in the strength of the anomaly during spread-F and no spread-F conditions is studied using the data of f0F2 and electron density of Ahmedabad
(anomaly crest region) and Waltair (station inside the anomaly crest region).
The ratios of f0F2 and electron densities computed
for Ahmedabad and Waltair on both spread-F and no spread-F days are presented separately in Fig. 2a and b. Here it is shown that the ratio of f0F2 gradually
increases from 07:00 both on F and no spread-F days. spread-From around 14:00 it is seen that there is a gradual decrease of the ratio of f0F2during no spread-F
days, while there is a sharp increase in the ratio during the spread-F days. This typical feature indicates that the strength of the anomaly during spread-F days is much higher, while during non-spread-F days the anomaly is weak. Further, the ratio of electron densities (Fig. 2b) at
Table 1. Locations of the observing stations
Station Geographical latitude (°N) Geographical longitude (°E) Dip angle (°N) Trivandrum 8.3 76.9 0.3 SHAR 13.7 80.3 10.0 Waltair 17.7 83.3 20.0 Ahmedabad 23.0 72.4 33.0
Fig. 1a–d. Nocturnal variation
of h′F for a 4th March, b 6th March; c 16th March and d 12th October 1991
an altitude of 270 km shoots up from a value of 1 to 25 over (14:00 to 20:00) on spread-F days, while the ratios remained more or less constant ( 1), at their lowest level, during non-spread-F days.
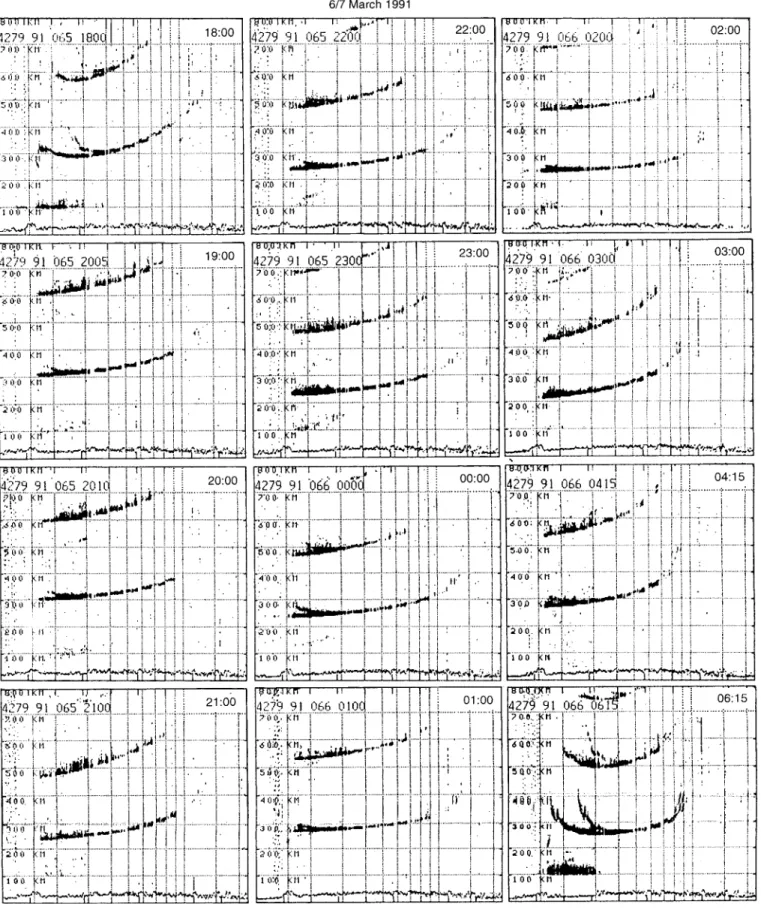
Figure 3 shows the latitudinal variation of electron density on a typical spread-F day, the 4th March 1991. This shows a well-developed anomaly centred around 23°N dip at 14:00 and a post-sunset strengthening of the anomaly around 22:00. The nocturnal variation of h′F on this day shows a sharp rise and fall (pre-reversal enhancement) (with a peak value of h′F on this day shows a sharp rise and fall (pre-reversal enhancement)) with a peak value of h′F of 420 kms (Fig. 1a). The sequence of ionograms recorded on this day at Waltair showing the presence of spread-F is presented in Fig. 4. spread-F appeared at 19:15 and continued upto 02:00 on this day. In Fig. 5 a latitudinal variation of electron density on a non-spread-F day, 6th March 1991, is presented, which shows a weak anomaly around 14:00 at 18°N dip. The peak value of h′F (Fig. 1b) is the same as that of 4th March 1991 (420 kms). But spread-F did not occur on this day as may be seen from the corresponding sequence of ionograms presented in Fig. 6.
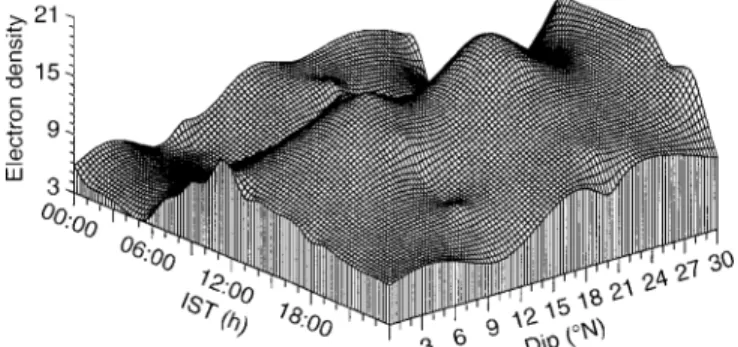
In Fig. 7 the variation of electron density as a function of altitude at the four different stations is presented for specific local times i.e. at (a) 6:00, (b) 12:00 (c) 18:00 and (d) 00:00 of a typical day, the 10th April 1991, which happens to show the presence of spread-F at all four stations. This figure shows the movement of the height of peak electron density towards higher latitudes as time progresses (Fig. 7a, c) followed by its
reverse movement during nighttime hours (Fig. 7d). These plots, thus, show the development and forward movement of EIA and the reverse fountain phenomen-on. In Fig. 8a–d, the variation of peak electron density with latitude at the different chosen local times (06:00, 12:00, 18:00 and 00:00) on 16th March 1991 is presented, which also happens to be a spread-F day. It is seen that at 06:00 a weak anomaly occurs around 10 °N. At 12:00 (Fig. 8b), the anomaly is seen beyond 30°N and at 18:00 (Fig. 8c) it is seen around 30°N and at 00:00 (Fig. 8d) it returns to 20 °N. The nocturnal variation of h′F presented in Fig. 1c wherein the peak value of h′F is 430 kms. Similarly, in Fig. 9 the variation of electron density as a function of dip angle on a typical non-spread-F day (12th October 1991) is presented. This shows that there is no indication of post-sunset strengthening of EIA even though the variation of h′F (Fig. 1d) peaks at 410 kms.
4 Discussion and conclusions
It is known that the occurrence of equatorial plasma instabilities although quite frequent during the evening hours, do not occur every day, as one would expect if it were due to the gravitational drift alone. Extensive experimental as well as theoretical work carried out in the recent past (Kelley and McClure, 1981; Ossakow, 1982; Maruyama and Matuura, 1984; Tsunoda, 1985; Aarons, 1993) have thrown some light into the under-standing of the complex phenomenon of equatorial spread-F. Farley et al. (1970) pointed out that the irregularities occur when the base of the F-layer, rises to higher altitudes in the evening hours and attains a threshold value (Abdu et al. 1983). In the present case from Fig. 1 it may be seen that although the F-layer peak altitudes are almost the same spread-F occurred only on two days showing that there are other factors which effect in the generation of spread-F.
Raghava Rao et al. (1988) proposed two mechanisms for the enhancement of the ratios of the electron densities (at a fixed height) between Ahmedabed (crest station) and Waltair (low latitude station during the evening hours on spread-F days. They are (1) the
Fig. 2a, b. Ratios of a critical frequency of F-layer (f0F2) and b
elec-tron density at an altitude of 270 km between Ahmedabad (dip 33°N) and Waltair (dip 20°N) on spread-F and non-spread-F days
Fig. 3. Latitudinal variation of electron density on a typical spread-F
Fig. 4. Sequence of ionograms showing the presence of spread-F at Waltair on 4th March 1991
redistribution of ionization brought-about by the latitu-dinal variation in the eastward electric field, and (2) a strong trans-equatorial meridional wind which can increase the ratios during evening hours. The results obtained in the present case (Fig. 2) pertain to equinoc-tial months during which period the trans-equatorial component of meridional wind is almost zero and the only mechanism that can increase the ratios of electron densities is the latitudinal variation in the electric field. The results reported by Raghava Rao et al. (1988) shows that the increase in the ratios of electron density between Ahmedabad and Waltair during the evening hour is limited to narrow altitude region between 270 and 300 kms. But in the present study the increase is seen as well in the critical frequency also with less intensity. This may be due to the change in the solar activity.
Further, the results obtained in the present study also substantiate the earlier conclusions of Raghava Rao
et al. (1988) for the Northern Hemisphere, Alex et al.
(1989) for the Southern Hemisphere and Sridharan et al. (1994) that the development of a strong EIA during daytime is conducive to a post-sunset generation of ESF. However, Alex et al. (1989) showed a significant change in the values of minimum virtual height of F-layer for spread-F and no spread-F days, which feature is absent in the case of present observations (Fig. 1). This shows that a change in the virtual height induced by the electric field is almost same for both spread-F and non spread-F days. Raghava Rao et al. (1993) indicated that significant vertical winds are associated with the development of a strong equatorial temperature and wind anomaly (ETWA), which is generated due to the ion drag at the location of the crests of the EIA. Downward winds have also been recorded over the magnetic equator (Biondi and Sipler 1985). It is suggested that a possible meridional circulation cell forms, with upward winds at the crests, and downward winds over the equator. The circulation cells must be closed with return flow at lower altitude. It has been demonstrated by linear theories and also by non-linear numerical simulations of ESF that vertical winds (downward/upward) are capable of altering (enhan-cing/inhibiting) the growth of the primary R–T in-stability (Sekar and Raghava Rao, 1987; Sekar et al., 1994). Therefore, a possibility exists that EIA and ESF
are linked through the meridional circulation cells and the associated vertical winds. Hysell et al. (1990) showed that the effect of vertical wind in the development of ESF is important only in the presence of finite field line integrated Pederson conductivity. The wind system proposed by Raghava Rao et al. (1993) has an impor-tant consequence on the thermosphere-ionosphere as a whole. At a location equatorward of the crest strong equatorward winds would occur, that would oppose the normal trans-equatorial winds in the winter hemisphere and add up to the inter-hemispheric wind in the summer hemisphere, having significant influence on the occurrence of spread-F. But the present study pertains to the equinoctial months when the trans-equatorial component of the meridional wind is zero (Maruyama and Matuura, 1984). However, the local wind generated by the EIA can play a role in the generation of spread-F.
The results obtained from the present study are in conformity with those obtained by Raghava Rao et al. (1988), Alex et al. (1989) and Sridharan et al. (1994) and show that a well-developed EIA is a condition conducive for the generation of irregularities and thus the occurrence of spread-F. The study also shows that the location of the crest is important in addition to the strength of the anomaly. The other related mechanism that can trigger the onset of spread-F are the vertical winds proposed by Raghava Rao et al. (1993). Local wind generated by the EIA and the asymmetry in the hemispheric distribution of ionization, which increases the E-region Pederson conductivity (caused by the EIA) may also be one of the reasons for the generation of ESF during the equinoctial months where the trans-equator-ial wind component is zero.
Acknowledgements. The authors thank Prof. Harish Chandra,
PRL, Ahmedabad for providing the ionosonde data. Two of the authors (PTJ and PS) thank CSIR (Government of India) for awarding research fellowships.
Topical Editor D. Alcayde’ thanks R.T. Tsunoda and another referee for their help in evaluating their paper.
Fig. 5. Latitudinal variation of electron density on a typical non
Fig. 6. Sequence of ionograms showing the absence of spread-F at Waltair on 4th March 1991
density with height at a 06:00;
b 12:00; c 18:00 and d 00:00 IST on
a typical spread-F day (10th April 1991)
Fig. 8a–d. Variation of peak
electron density with dip at
a 06:00. b 12:00; c 18:00 and d 00:00 IST on a typical spread-F
day (16th March 1991)
Fig. 9a–d. Variation of peak
elec-tron density with dip at a 06:00;
b 12:00; c 18:00 and d 00:00 IST on
a non spread-F day (12th October 1991)
References
Aarons J., The longitudinal morphology of equatorial spreadF
-layer irregularities relevant to their occurrence, Space. Sci. Rev.,
63, 209–243, 1993.
Abdu M. A., R. T. de Medeiros, J. A. Bittencourt, and J. S. Batista,
Vertical ionization drift velocities and range type of spread-F in the evening equatorial ionosphere, J. Geophys. Res., 88, 399– 402, 1983.
Alex S., P. V. Koparkar, and R. G. Rastogi, Spread-F and
ioniza-tion anomaly belt, J. Ainos. Terr. Phys., 51, 371–379, 1989.
Biondi M. A., and D. P. Sipler, Horizontal and vertical winds and
temperatures in the equatorial thermosphere-measurments from Natal Brazil during August-September 1982, Planet. Space.
Sci., 33, 817–823, 1985.
Farley D. T., B. B. Balsley, R. F. Woodman, and J. P. McClure,
Equatorial spread-F, implications of VHF radar observations,
J. Geophys. Res., 75, 7199–7208, 1970.
Hysell D. L., M. C. Kelley, W. E. Swartz and R. F. Woodman,
Seeding and layering of equatorial spread-F by gravity waves, J.
Geophys. Res., 95, 17257–17260, 1990.
Kelley M. C. and J. P. McClure, Equatorial spread-F: a review of
recent experimental results, J. Ainos. Terr. Phys., 43, 437–452, 1981.
Maruyama T., and T. Matuura, Longitudinal variability of annual
changes in activity of equatorial spread-F and plasma bubbles.
J. Geophys. Res., 89, 10903–10912, 1984.
Mendillo M., J. Baumgardner, P. Xiaoquing, P. J. Sultan, and R. J. Sumoda, Onset conditions for equatorial spread-F. J.
Geophys. Res. 97, 13865–13876, 1992.
Ossakow S. L., Spread-F theories and review, J. Ainos. Terr. Phys., 43, 427–435, 1982.
Raghava Rao R., W. R. Hoegy, N. W. Spencer, and L. E. Wharton.
Neutral temperature anomaly in the equatorial thermosphere – a source of vertical winds. Geophys. Res. Lett. 20, 1023–1026, 1993.
Raghava Rao R., M. Nageswara Rao, J. H. Sastri., G. D. Vyas, and M. Srirama Rao. Role of equatorial ionization anomaly in the
initiation of equatorial spread-F, J. Geophys. Res., 93, 5959– 5964, 1988.
Raghava Rao R., L. E. Wharton, N. W. Spencer, H. G. Mayr and L. H. Brace an equatorial temperature and wind anomaly
(ETWA), Geophys. Res. Lett., 18, 1193–1196, 1991.
Rama Rao P. V. S, P. Sri Ram, P. T. Jayachandran, and D. S. V. V. D. Prasad, Seasonal variation in ionospheric electron content
and irregularities over Waltair – a comparison with SLIM model, Adv. Space Res., 18, 259–262, 1996.
Sekar R., and R. Raghava Rao, Role of vertical winds on the
Rayleigh-Taylor mode instabilities of the nighttime equatorial ionosphere, J Ainos. Terr. Phys., 49, 981–985, 1987.
Sekar R., R. Raghava Rao and R. Suhasini, Effect of vertical winds
and electric fields in the non-linear evolution of equatorial spread-F, J. Geophys. Res., 99, 2205–2214, 1994.
Sridharan R., D. Pallam Raju, R. Raghava Rao, and P. V. S. Rama Rao, Precursor to equatorial spread-F on OI 630.0 nm dayglow,
Geophys. Res. Lett., 21, 2797–2800, 1994.
Titheridge J. E., Ionogram analysis with the generalised program
Polan, Rep UAG-93, 1985.
Tsunoda R. T., Control of the seasonal and longitudinal occurrence
of equatorial scintillations by longitudinal gradient in the integrated E-region Paderson conductivity, J. Geophys. Res., 90, 447–456 1985.