HAL Id: hal-01464215
https://hal-amu.archives-ouvertes.fr/hal-01464215
Submitted on 10 Feb 2017
HAL is a multi-disciplinary open access
archive for the deposit and dissemination of
sci-entific research documents, whether they are
pub-lished or not. The documents may come from
teaching and research institutions in France or
abroad, or from public or private research centers.
L’archive ouverte pluridisciplinaire HAL, est
destinée au dépôt et à la diffusion de documents
scientifiques de niveau recherche, publiés ou non,
émanant des établissements d’enseignement et de
recherche français ou étrangers, des laboratoires
publics ou privés.
during an Instructed-Delay Reach-to-Grasp Task
Emiliano Torre, Pietro Quaglio, Michael Denker, Thomas Brochier, Alexa
Riehle, Sonja Grün
To cite this version:
Emiliano Torre, Pietro Quaglio, Michael Denker, Thomas Brochier, Alexa Riehle, et al.. Synchronous
Spike Patterns in Macaque Motor Cortex during an Instructed-Delay Reach-to-Grasp Task. Journal of
Neuroscience, Society for Neuroscience, 2016, 36, pp.8329-8340. �10.1523/JNEUROSCI.4375-15.2016�.
�hal-01464215�
Systems/Circuits
Synchronous Spike Patterns in Macaque Motor Cortex
during an Instructed-Delay Reach-to-Grasp Task
X
Emiliano Torre,
1X
Pietro Quaglio,
1X
Michael Denker,
1Thomas Brochier,
2Alexa Riehle,
2,3,5and
X
Sonja Gru¨n
1,4,5 1Institute of Neuroscience and Medicine and Institute for Advanced Simulation and JARA Brain Institute I, Ju¨lich Research Centre, 52425 Ju¨lich, Germany, 2Institut de Neurosciences de la Timone, UMR 7289, CNRS, Aix-Marseille Université, 13005 Marseille, France,3Institute of Neuroscience and Medicine, Jülich Research Centre, 52425 Jülich, Germany,4Theoretical Systems Neurobiology, RWTH Aachen University, 52062 Aachen, Germany, and5RIKEN Brain Science Institute, 351-0198 Wako Shi, JapanThe computational role of spike time synchronization at millisecond precision among neurons in the cerebral cortex is hotly debated.
Studies performed on data of limited size provided experimental evidence that low-order correlations occur in relation to behavior.
Advances in electrophysiological technology to record from hundreds of neurons simultaneously provide the opportunity to observe
coordinated spiking activity of larger populations of cells. We recently published a method that combines data mining and statistical
evaluation to search for significant patterns of synchronous spikes in massively parallel spike trains (
Torre et al., 2013
). The method
solves the computational and multiple testing problems raised by the high dimensionality of the data. In the current study, we used our
method on simultaneous recordings from two macaque monkeys engaged in an instructed-delay reach-to-grasp task to determine the
emer-gence of spike synchronization in relation to behavior. We found a multitude of synchronous spike patterns aligned in both monkeys along a
preferential mediolateral orientation in brain space. The occurrence of the patterns is highly specific to behavior, indicating that different
behaviors are associated with the synchronization of different groups of neurons (“cell assemblies”). However, pooled patterns that overlap in
neuronal composition exhibit no specificity, suggesting that exclusive cell assemblies become active during different behaviors, but can recruit
partly identical neurons. These findings are consistent across multiple recording sessions analyzed across the two monkeys.
Key words: cell assemblies; massively parallel spike trains; motor cortex; spike synchrony; temporal coding
Introduction
The computational relevance of spike synchronization at
milli-second precision among neurons in the cerebral cortex has been
hotly debated during the last two decades. The efficacy of
syn-chronous compared with asynsyn-chronous input in triggering a
spike response was explored in theoretical studies that led to the
notion of the coincidence detector (
Abeles, 1982
;
Rudolph and
Destexhe, 2003
) and was supported by experimental evidence
(
Softky and Koch, 1993
;
Azouz and Gray, 2000
,
2003
). Pairwise
or low-order correlations have been shown to be related to
be-Received Dec. 2, 2015; revised May 13, 2016; accepted June 18, 2016.
Author contributions: E.T., P.Q., M.D., T.B., A.R., and S.G. designed research; E.T., P.Q., T.B., and A.R. performed research; E.T., P.Q., and M.D. contributed unpublished reagents/analytic tools; E.T. and P.Q. analyzed data; E.T., P.Q., M.D., T.B., A.R., and S.G. wrote the paper.
This work was supported by Helmholtz Portfolio Supercomputing and Modeling for the Human Brain, Brain-ScaleS (EU Grant 269912), Human Brain Project (EU Grant 604102), and Collaborative Research Agreement RIKEN-CNRS, ANR GRASP. We thank Ivan Balansard for surgical help, the INT animal house team for animal care, Joel Baurberg and Xavier Degiovanni for technical assistance, and Lyuba Zehl for help in managing the meta-data and for providing Figure 1 in this manuscript.
This article is freely available online through the J Neurosci Author Open Choice option.
Correspondence should be addressed to Sonja Gru¨n, Institute of Neuroscience and Medicine and Institute for Advanced Simulation and JARA Brain Institute I, Ju¨lich Research Centre, Wilhelm-Johnen-Straße, 52425 Ju¨lich, Germany. E-mail:[email protected].
DOI:10.1523/JNEUROSCI.4375-15.2016 Copyright © 2016 Torre, et al.
This is an Open Access article distributed under the terms of the Creative Commons Attribution License Creative Commons Attribution 4.0 International, whichpermitsunrestricteduse,distributionandreproductioninany medium provided that the original work is properly attributed.
Significance Statement
Neurons in the brain communicate via electrical impulses called spikes. How spikes are coordinated to process information is still
largely unknown. Synchronous spikes are effective in triggering a spike emission in receiving neurons and have been shown to
occur in relation to behavior in a number of studies on simultaneous recordings of few neurons. We recently published a method
to extend this type of investigation to larger data. Here, we apply it to simultaneous recordings of hundreds of neurons from the
motor cortex of macaque monkeys performing a motor task. Our analysis reveals groups of neurons selectively synchronizing
their activity in relation to behavior, which sheds new light on the role of synchrony in information processing in the cerebral
cortex.
havior (
Vaadia et al., 1995
;
Riehle et al., 1997
;
Hatsopoulos et al.,
1998
;
Jackson et al., 2003
). However, the limited size of the data
used in these studies, often comprising just a few simultaneously
recorded neurons, raises a subsampling issue that makes these
findings difficult to interpret and to generalize to larger
popula-tions of neurons.
Recent advances in electrophysiological technology provide
the possibility to record hundreds of neurons simultaneously
(
Buzsa´ki, 2004
;
Schwarz et al., 2014
). The high dimensionality of
these data raises severe computational and statistical (multiple
testing) problems due to the explosion of the number of possible
synchronous spike patterns to be analyzed for significance. We
recently developed a method that overcomes these issues by
ex-ploiting frequent item set mining to count pattern occurrences
efficiently (
Picado-Muin
˜o et al., 2013
) and by assessing pattern
significance on the basis of a hierarchy of statistical tests (
Torre et
al., 2013
).
Borgelt and Picado-Muin
˜o (2014)
introduced a
mod-ification of this method to define synchrony in continuous time
rather than by time binning, which outperforms the latter when
synchrony is jittered by a few milliseconds. This approach was
embedded in the data mining and statistical framework of the
synchronous pattern detection and evaluation (SPADE) analysis
for an efficient and statistically effective pattern detection.
In this study, we used the time-continuous SPADE analysis on
simultaneous recordings from two monkeys engaged in an
instructed-delay reach-to-grasp task to determine the occurrence
of significant synchronous spike patterns in relation to
beha-vior. Single-neuron spiking activity was recorded using a
100-electrode Utah array chronically implanted in motor cortex. The
task involved two grip modalities (side grip or precision grip) and
two force levels (high or low) (
Riehle et al., 2013
). To perform a
time-resolved analysis, we defined six successive temporal
win-dows, or epochs, within each trial, from start until reward. We
analyzed each epoch and trial type separately. Our analysis
re-vealed a multitude of significant synchronous spike patterns,
emerging more frequently during movement execution than
during the instructed delay. The neuronal composition of
pat-terns was specific to the grip modality, but only weakly related to
the force level required. Patterns partially overlapped in neuronal
composition. Clusters of overlapping patterns did not exhibit
high specificity, suggesting that similar but not identical cell
as-semblies were active during different behaviors and that one
neu-ron could participate in multiple assemblies.
Finally, neurons involved in significant patterns were aligned
along a preferential mediolateral orientation in both monkeys.
The neuronal composition of significant patterns was highly
spe-cific to the behavioral epoch and grip modality, indicating that
different behaviors were related to the synchronization of
differ-ent groups of neurons, which we interpret as the activation of
different cell assemblies. These findings were consistent across
the two monkeys and provide new insights on the functional role
of spike synchronization in motor cortex.
Materials and Methods
Data
Experimental protocol and experimental setup. We analyzed
electrophysi-ological data recorded from the motor cortex of two monkeys (Macaca
mulatta), Monkey L (female) and Monkey N (male), during repeated
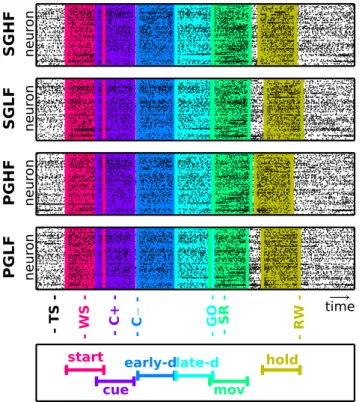
execution of an instructed-delay reach-to-grasp task. The experimental protocol is described inRiehle et al. (2013). In summary, the monkey used one of two grips, either a full-hand side grip (SG) or a two-fingers precision grip (PG), to grasp and pull a cubic object along the horizontal axis. The object load was computer-controlled and was either 1 N for low force (LF) or 2 N for high force (HF) trials, respectively. The monkey had to hold the object in a narrow position window for 500 ms to obtain a food reward (drop of apple juice). Task instructions were provided by five LEDs (four red LEDs placed at the corners of a square and a yellow LED in the center) located just above the object. The task is illustrated in Figure 1. The monkey had to close a switch located at waist level to self-initiate the trial. After 400 ms from trial start, the yellow LED was illuminated as a warning signal (WS) for the cue occurring 400 ms later. The cue (illumination of the two right or the two left LEDs) was pre-sented for 300 ms and instructed the monkey about the type of grip to be used to grasp the object. After a preparatory delay of 1000 ms, a second cue (illumination of the two top or the two bottom LEDs) indicated the object load and also represented the GO signal instructing the monkey to execute the movement. Therefore, the monkey could perform one of four possible trial types: SGHF, SGLF, PGHF, and PGLF. The four trial types were presented in random succession within a recording session lasting for⬃15 min, which consisted of a sequence of ⬃130 successful trial executions.
Both monkeys were chronically implanted in motor cortex with a 100-electrode Utah array (Blackrock Microsystems) covering part of the dorsal premotor (PMd) and primary motor (M1) cortex (seeFig.
6A for the array locations). The length of the electrodes was 1.5 mm,
with an interelectrode distance of 400m. Data were recorded using the 128-channel Cerebus acquisition system (Blackrock Microsys-tems). The signal from each active electrode (96 of the 100 electrodes were connected) was preprocessed by a head stage with unity gain and then amplified with a gain of 5000. The signal was sampled at 30 kHz (1 data point every 1/30 ms) and filtered in two different frequency bands to be split into local field potentials (LFP, 0.3–250 Hz) and spiking activity (0.5–7.5 kHz in Monkey L and 0.25–7.5 kHz in Mon-key N). The potential spike times were identified online on every channel by a threshold-crossing criterion and the corresponding waveforms saved in the Blackrock Central Suite as snippets of 1.6 ms (10 data points before the time of threshold crossing and 38 data points after) in Monkey L and 1.3 ms (10 data points before threshold crossing and 28 data points after) in Monkey N around the spike time. The threshold for spike selection was set online by the experimenter
Figure 1. Reach-to-grasp experimental protocol. The trial start (TS) was self-initiated by the monkey by closing a home switch. A WS prepared the monkey for the visual cue (C⫹ until C⫺) providing instruction about the grip type to use: SG or PG. One second later, a second visual cue turned on (GO), specifying the force needed to pull the object (HF or LF) and requesting movement initiation. The movement onset is marked by the switch release (SR). After object touch (OT), the monkey pulled the object and held it for 500 ms in a narrow position window until it was rewarded (RW). The timing of the behavioral events SR, OT, and RW, which follow the GO signal, varied depending on the monkey’s reaction time and movement speed.
separately on every channel at the beginning of each recording day and controlled (and if necessary reset) at the beginning of each ses-sion. All behavioral data, such as stimuli, switch release, force traces for thumb and index fingers, and object displacement, were fed into the Cerebus system, sampled at 1 kHz, and stored for offline analysis.
Data preprocessing. The waveforms of the potential spikes were sorted
offline separately on each electrode using the Offline Spike Sorter (ver-sion 3.3, Plexon) into the single-unit spiking activity (SUA) as described inRiehle et al. (2013). A preliminary analysis of the data revealed the presence of synchronous spikes across multiple SUAs at the sampling resolution of the recording system␦ ⫽ 1/30 ms, a phenomenon often invisible to the bare visual inspection of the population raster plots. These spikes survived both the online and automatic artifact-rejection procedure provided by the Blackrock system and the offline spike-sorting procedure detailed inRiehle et al. (2013). The number of SUAs involved in these hypersynchronous events ranged from 2 to⬎30. A statistical analysis showed that the frequency of their occurrence largely exceeded the value expected under the observed population firing rate. Further-more, fine-scale temporal correlation in the activity of the recorded neu-rons cannot explain these hypersynchronous events because it is not expected at submillisecond precision. Assuming that these events, the presence of which heavily affects any analysis of spike synchronization, are artifacts of unknown origin, we adopted a conservative approach and removed all of them from the data, which we then analyzed for synchro-nous spike patterns. This may have resulted in the removal of real syn-chronous spikes, which may lead to false-negative results. However, we privileged this compromise over the risk to have false-positive (FP) pat-tern detections. A time histogram of the population spiking activity trig-gered around the occurrence times of all hypersynchronous events and calculated using bins of width␦ ⫽ 1/30 ms revealed an increased spike count in the bins immediately preceding or after those events compared with other bins. Therefore, we additionally removed all spikes, even if isolated, occurring within a time interval␦ ⫽ 1/30 ms before or after any hypersynchronous event because they may as well reflect noise. For the analysis of spike patterns, we selected only SUAs with waveforms of high spike-sorting quality; that is, with a signal-to-noise ratio⬎2.5, as sug-gested byHatsopoulos et al. (2004).
SPADE analysis of spike synchrony
We used the SPADE analysis (Picado-Muin˜o et al., 2013;Torre et al., 2013;Borgelt and Picado-Muin˜o, 2014) to search in massively parallel spike trains for patterns of synchronous spikes occurring more often than expected by chance under the null hypothesis H0of independence.
SPADE overcomes the severe computational problem of counting pat-tern occurrences in massively parallel data characterized by an exponen-tial explosion of the number of existing patterns and the consequent multiple testing problem of assessing the statistical significance of each such pattern.
Occurrence count of non-trivial patterns. SPADE defines synchronous
spike patterns either by discretizing the time into bins of a given width w and by considering spikes falling into the same time bin as synchronous (Picado-Muin˜o et al., 2013;Torre et al., 2013) or in continuous time by centering a window of width w around each spike and collecting the spikes of all neurons falling inside that window (Borgelt and Picado-Muin˜o, 2014). We used the time-continuous version, which more reli-ably finds spike patterns with synchrony characterized by a small temporal jitter, using a window of width w⫽ 3 ms. The total number of synchronous patterns that occur in massively parallel spike train data is large (up to several millions), so counting the occurrences of each of these patterns by brute force algorithms is computationally not feasible. How-ever, the large majority of these patterns occur only once; that is, they are “infrequent.” Infrequent patterns can be discarded because either they would not be statistically significant after performing a statistical test or because their single repetition could not be associated with repeated behavior, as in the data we aim to analyze. Of the frequent patterns, i.e., the patterns that repeat at least two times, it is possible to discard all of those that repeat only as subsets of a larger pattern; that is, those that are “not closed.” SPADE exploits a frequent item set mining algorithm (FP-growth;Han et al., 2004) to restrict the search for patterns to those that
are frequent and closed. This approach greatly speeds up the search for patterns and the counting of their occurrences. Details can be found in Torre et al. (2013).
Significance of pattern signature. Closed frequent patterns are evaluated
for the statistical significance of their size z (the number of spikes con-tained in the pattern) and their number of occurrences c, that is, of their signature⬍z, c⬎. The probability of having patterns with signature ⬍z,
c⬎ under H0is evaluated for any signature⬍z, c⬎ using surrogate data.
The surrogates are generated from the original data in such a way that correlations are destroyed while other features of the data are preserved to the largest extent possible. Among the many surrogate generation techniques known in the literature (see, e.g.,Gru¨n, 2009;Louis et al., 2010), we opted for spike dithering, which well preserves the firing rate profiles of individual units. Spike dithering generates surrogate data by displacing each individual spike around its original occurrence time by a random amount up to⫾␦j. We set␦j⫽ 25 ms, which is sufficiently larger
than the synchrony precision w to destroy synchronous patterns in the original data (Pipa et al., 2008) while preserving the rate profiles. The
p-value of each signature⬍z, c⬎ is then determined based on K surrogate
datasets (here, K⫽ 10000) as the fraction of surrogates that contain patterns with that signature. Signatures of patterns in the original data with a p-value that is lower than a significance threshold␣ are classified as statistically significant. We set␣ ⫽ 0.01 and applied the false discovery rate correction (Benjamini and Hochberg, 1995) for the number of dif-ferent signatures—typically a few dozens—found in all surrogates. Be-cause the surrogate data have the same firing rate profiles as the original data, these features are incorporated properly into the null hypothesis. Data with higher firing rates yield decreased statistical significance for pattern signatures compared with data characterized by lower rates. In-deed, the same pattern signature will be more likely to occur in surrogates obtained from higher-rate data due to the increased probability of chance synchronization (see Fig. 4 inTorre et al., 2013). Therefore, the evalua-tion of statistical significance is more conservative when applied on data of higher firing rates. Because the surrogates capture rate changes, the method is robust to sudden, simultaneous jumps in the neuronal firing rates (see Fig. 8 inTorre et al., 2013), which is a more extreme (and therefore more error-prone) version of the comodulation of firing rates observed in the data that we analyze here.
Pattern significance. InTorre et al. (2013), we showed on synthetic data that the presence of a real pattern A tends to increase the size or the occurrence count (and thus the signature significance) of patterns that partially overlap with A. Pattern spectrum filtering is prone to classifying these patterns erroneously as significant themselves. To eliminate these FPs, we developed inTorre et al. (2013)a procedure named pattern set reduction, which evaluates the conditional significance of each pattern detected by pattern spectrum filtering given the occurrences of any other pattern overlapping with it and also returned as significant by pattern spectrum filtering.Borgelt and Picado-Muin˜o (2014)introduced a ver-sion of pattern set reduction compatible with the definition of synchrony in continuous time. For both the discrete and the continuous versions of SPADE, several variants of pattern set reduction exist (Torre et al., 2013). Among them, we opted for combined filtering, which tests for pattern significance given both pattern’s supersets (superset filtering) and subsets (subset filtering) and retains only mutually significant patterns. Given two closed patterns A and B with signatures⬍zA, cA⬎ and ⬍zB, cB⬎ such that
B傺 A (so that zB⬍ zAand cB⬎ cA), combined filtering assesses the
condi-tional significance of B given A and of A given B. A is considered significant given B if the signature具zA ⫺ zB ⫹ k, cA典is significant (k⫽ 2 here). B is
considered significant given A if the signature具zB, cB⫺ cA ⫹ h典is
signifi-cant (h⫽ 1 here). Each pattern that is still significant given the other is retained. If neither is, given that both have significant signatures and there-fore at least one should be a true pattern, the pattern with the largest z䡠 c score, that is, covering the largest number of spikes, is kept.
Pattern specificity to behavior
Our data consisted of parallel spike trains recorded during four different trial types (resulting from the combination of two grip modalities and two force levels). To associate the occurrence of significant patterns to behavior, we split each trial into six temporal epochs of 500 ms each (see
Results) and searched for significant patterns separately in each combi-nation of epoch and trial type. This resulted in 24 datasets analyzed for each session (one per epoch and trial type). We additionally defined four behavioral contexts: trial epoch, trial type, grip modality, and force level, each having multiple instances (six epochs, four trial types, two grip modalities, and two force levels, respectively). To determine whether specific ensembles of neurons were active in the different behavioral contexts, we investigated whether the significant patterns found during each instance of a behavioral context (e.g., during the start epoch) occur exclusively during that instance or whether instead they also occur dur-ing other instances of the same behavioral context (e.g., durdur-ing other epochs).
Formally, given a context with n instances letPibe the ensemble of
significant patterns found by SPADE during the i-th instance, i⫽ 1, . . . ,
n. (For example, letPi, i⫽ 1, 2, . . . , 6 be the ensembles of patterns found
during each of the 6 epochs). For each instance containing at least one significant pattern (i.e.,Pi⫽ A), we defined its pattern specificity as the
fraction of patterns inPithat do not occur in any otherPj, j⫽ I, as
follows:
Si⫽
兩Pi共 艛j⫽iPj兲兩 兩 Pi兩
(1) (for example, the fraction of patterns found during the start epoch that do not occur in other epochs). Sitakes values in the interval [0, 1]. It takes
value 1 (or: 0) if all patterns found in the associated instance do not occur in any (or occur in at least one) other instance of the same context.
Pattern clustering
Clustering n patterns into k clusters. Patterns found as significant by the
SPADE analysis may overlap in their neuronal composition. We charac-terized their similarity by performing a clustering analysis based on their neuronal composition. We first defined the distance d( A, B) between any two patterns A and B as their Ochiai distance (Ochiai, 1957) as follows:
d共 A, B兲 ⫽ 1 ⫺ 兩 A 艚 B 兩 /
冑
兩 A 兩 · 兩 B兩 ,which takes values between 0 (identical sets) and 1 (disjoint sets). We then employed the matrix D of distances d( A, B) between any two pat-terns as the metric in a classical k-medoids clustering algorithm ( Kauf-man and Rousseeuw, 1987). By fixing the number k of clusters into which
n patterns have to be grouped, the algorithm selects k points (here,
pat-terns) as possible cluster centers (medoids) and builds clusters Cj, j⫽
1, . . . , k, by assigning patterns to their closest medoid. The algorithm then computes the distancediⴱof each pattern from its closest medoid
according to the metric D. The overall sum冱i⫽1n d 1
ⴱgives an indication of
the total “dispersion” of patterns around their closest medoid. The algo-rithm searches for the combination of k medoids yielding the lowest dispersion⌬k⫽ 冱id1ⴱ, and returns the associated configuration of
clus-ters as the optimal k-clusclus-ters configurationCk(having optimal dispersion
⌬k). Given the discrete nature of the elements to be clustered (sets of
points), a k-medoids algorithm is more suitable than algorithms com-puting averages of the elements, such as classical k-means clustering techniques.
Determining the optimal number k of clusters.⌬kis a non-increasing
function of k: a configuration with k⫹ 1 clusters and having a dispersion lower than or equal to⌬kalways exists, as long as k⬍ n. A trivial example
consists in considering a cluster with at least two patterns in the k-clusters configuration and removing from it one non-medoid pattern into a new isolated cluster. This operation removes an addendum from the disper-sion of the first cluster and creates a 1-pattern cluster which has neces-sarily a dispersion equal to 0, yielding an overall lower dispersion. To quantify the optimal number of clusters for a set of n patterns, we thus penalized the total dispersion of a configuration by the number of its clusters, defining its cost byRk ⫽ ⌬k ⫹ · k, k⫽ 1, . . . , n. We then
determined the optimal number of clusters askⴱ ⫽ arg mink兵Rk其and
grouped the patterns into the configurationCkⴱ. A configurationCk⫹1has
a lower cost than Ck and is therefore to be preferred only if
Rk⫹1 ⱕ Rk(or equivalently, if⌬k⫹1 ⫹ ⱕ ⌬k); that is, if adding a
cluster makes the cost drop by an amount that is not smaller than the
penalty coefficient. We set ⫽ 1, which also represents the maximum distance between two patterns. This choice ensures that any two patterns in the same cluster share at least one neuron id. Indeed, whenever a cluster Cjin the configurationCkcontains a pattern A disjoint from all
other patterns in Cj(and thus contributing a⫹ 1 to the dispersion of Cj), there will exist at least one configuration of k⫹ 1 clusters having a lower cost thanCk: the one in which A is an individual cluster separated from Cj.
Specificity of pattern clusters to behavior. Analogously to what was done
for individual patterns, we defined the specificity of the ensembleQiof
clusters found during the instance i (e.g., epoch movement) of a behav-ioral context (e.g., epochs) as the fraction of clusters inQiwhich
oc-curred only in the instance i, and in no other instance j⫽ i (e.g., other epochs), by the following:
Si⫽
兩Qi共 艛j⫽iQj兲兩 兩Qi兩
. (2)
As well as pattern specificity, cluster specificity varies between 0 and 1 (all/no clusters found in the behavioral instance also occurred in other instances of the same behavioral context, respectively).
Results
Pattern significance across epochs and trial types
We analyzed spike data from multiple single neurons (up to
⬎100) recorded simultaneously during an instructed-delay
reach-to-grasp task (see Materials and Methods, Data) with
SPADE (see Materials and Methods, SPADE analysis of spike
synchrony) to detect statistically significant patterns of
synchro-nous spikes. Patterns were significant if they repeated more
fre-quently than expected given the firing rates of individual neurons
under the null hypothesis of independence. For each monkey, we
sorted one session per day, which was typically the first session of
the day because there the monkey worked best (performed the
largest number of correct trials). This resulted in 10 sessions from
10 different recording days. Each session lasted for
⬃15 min and
contained trials of four different types presented in random
suc-cession: SGHF, SGLF, PGHF, PGLF (see Materials and Methods,
Data for more details on the experimental protocol). Within each
behavioral trial, we identified six time windows, or epochs, of 500
ms duration each, related to specific triggers and thus behavioral
contexts. Each epoch starts at time t
prebefore a specific trigger
and ends at time t
postafter the trigger, as summarized in
Table 1
and illustrated in
Figure 2
. Epoch start is centered around the
appearance of the WS during a waiting period before the
presen-tation of the visual cue. Epoch cue covers the time around the
appearance of the visual cue providing prior information about
the grip type. Epoch early delay captures the first half of the
preparatory period after the offset of the visual cue, whereas
ep-och late delay covers the second half of this preparatory period
until the presentation of the GO signal. Epoch movement is
cen-tered around the movement onset indicated by the switch release.
Finally, epoch hold covers the 500 ms time period when the
mon-key holds the object in a fixed position to get the reward. Each
epoch thus reflects a moment during the trial when different
Table 1. Definition of trial epochs
Epoch name Trigger tpre(ms) tpost(ms)
Start WS 250 250 Cue C⫹ 250 250 Early delay C⫺ 0 500 Late delay GO 500 0 Movement SR 200 300 Hold RW 500 0
The table summarizes the six different epochs defined for the analysis. Each epoch is a 500 ms time window starting at time tprebefore a trigger and ending at time tpostafter that trigger (tpre⫹ tpost⫽ 500 ms).
cognitive processes are supposed to take place: paying attention
while waiting for the cue (start), receiving and/or processing
in-structions (cue, early delay, movement), preparing the correct
grip and waiting for further instruction about the force level
(early delay, late delay), performing the correct grasp
(move-ment), and keeping the position of the object until reward (hold).
Figure 2
illustrates these epochs as colored windows during one
selected trial for each of the four trials types, along with the spike
times recorded in parallel from all single neurons during the
respective trials (black dots). As apparent from the figure, some
epochs partially overlapped (e.g., start and cue or movement and
hold). For epochs after the GO signal, this overlap varied from
trial to trial with respect to the reaction and movement time of
the animal.
With the goal of relating synchronous spike patterns to
be-havior, we separated each session into 24 different datasets
corresponding to each combination of trial type and epoch.
Spe-cifically, each such dataset was obtained by concatenating all
seg-ments of spike trains corresponding to the same epoch (e.g.,
start) across all trials of the same type (e.g., SGHF) separately for
each neuron. On average, a single session contained
⬃130 trials,;
that is,
⬎30 trials of each type. For each session, the individual
datasets (e.g., SGHF start) were concatenated and then analyzed
separately with SPADE for significant patterns of synchronous
spikes of any size (i.e., number of neurons involved) and
neuro-nal composition. A single session contained, on average,
record-ings from 70
⫾ 13.76 single neurons in Monkey L and 142.6 ⫾
14.6 single neurons in Monkey N, resulting in millions of
differ-ent possible patterns that SPADE reduced to a small number of
significant patterns. The outcome of the analysis was a collection
of 24 sets of significant patterns per session, one per trial type and
epoch.
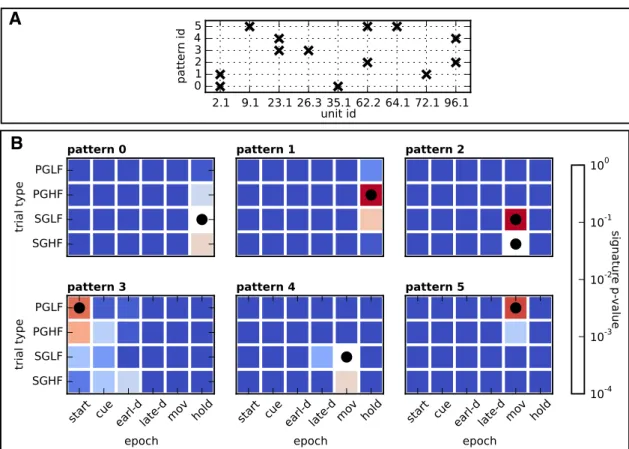
Figure 3
shows the results of a representative session from
Monkey N.
Figure 3
A illustrates the composition of neuron
iden-tities (horizontal axis) of each significant pattern in this session.
Six patterns were found by SPADE, marked with labels 0 to 5
(vertical axis).
Figure 3
B shows for each pattern the p-value (color
coded) of the pattern signature in each epoch and trial type
(log-arithmic scale). White color corresponds to the significance
threshold
␣ ⫽ 0.01 for pattern signatures before application of
the false discovery rate correction (signatures with a lower
p-value may eventually still not be significant due to the statistical
correction procedure). Squares with a black dot indicate the trial
types and epochs in which the pattern was classified as statistically
significant after correction.
Pattern statistics across sessions
Pattern size and occurrences
We performed the analysis outlined above separately for each
session.
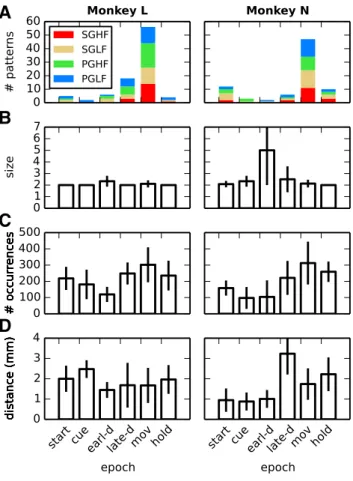
Figure 4
A shows the total number of significant patterns
found in the different epochs (horizontal axis; colors mark the
contribution of each trial type) summed across the 10 sessions
analyzed for each monkey. The highest number of significant
patterns occurred during movement in both monkeys, but all
epochs contained significant patterns. No relevant difference was
observed between trial types.
Figure 4
, B and C, shows the average
size and the average number of occurrences of the significant
patterns detected during each epoch and trial type. Whiskers
in-dicate the SD, revealing a lower variability in pattern size across
sessions compared with the number of pattern occurrences. Most
patterns were composed of two neurons and repeated 100 –300
times in each dataset. The largest pattern was found in PGLF trials
during the early-delay epoch, comprising eight neurons and
oc-curring twice. The remaining patterns had a size
ⱕ3 for Monkey
L and
ⱕ4 for Monkey N. Typically, the number of occurrences
needed for a pattern to become significant dropped exponentially
with pattern size, as shown by
Torre et al. (2013)
.
Spatial arrangement of neurons involved in patterns
The interelectrode distance on the recording array was 400 and
566
m in the horizontal/vertical and the diagonal direction,
respectively. The vast majority of neurons forming significant
patterns were recorded from electrodes located 0.4 –2.4 mm apart
(
Fig. 4
D), corresponding to a separation of 1– 6 electrodes on the
array along the horizontal/vertical direction (
Fig. 5
A).
A number of experimental studies showed a decay of spike
correlation among neurons placed at increasing distances (
Kwan
et al., 1987
;
Gray et al., 1989
;
Murthy and Fetz, 1996
;
Berger et al.,
2007
;
Smith and Fetz, 2009
). SPADE makes it possible to test such
a relation on massively parallel spike train data. Here, we studied
how the fraction of neuron pairs belonging to any significant
pattern varies with the distance between the two neurons in the
pair. To this end, we extracted from each pattern (of any size)
found as significant in any session, epoch, and trial type all pairs
of neurons composing the pattern, and calculated the distance
between the neurons in each pair. Next, we built the histogram of
the number of pairs recorded at a given distance (0.4- 5.4 mm in
steps of 1 mm) and, finally, we corrected the values taken by each
bar in the histogram by the overall number of recorded neuron
pairs at that distance, which varied with distance. The results are
shown in
Figure 5
. For both monkeys, the fraction of pairs of
neurons involved in the same pattern and recorded within a given
Figure 2. Trial types and epochs. Each panel shows the simultaneous spiking activity of all neurons (vertical axis) over time (horizontal axis) for four example trials (one per panel) of different types from a representative session in Monkey N. Each dot indicates one spike. The trials are aligned to trial start (TS). The six colored windows represent the position of the six epochs in the trials. The trigger associated to each epoch and the corresponding epoch name are shown at the bottom (for details, seeTable 1). The movement (green) and hold (yellow) epochs are centered around triggers with occurrence times that changed from trial to trial depending on the reaction of the monkey to the GO signal and the movement time.
distance range, corrected by the total number of recorded neuron
pairs placed at that distance, decayed with distance, in agreement
with previous findings (
Berger et al., 2007
). The trend was
stron-ger for Monkey N than for Monkey L, but was present in both
animals. Summing across sessions, trial types, and epochs, the
data from Monkey L contained 71 pairs of SUAs involved in the
same pattern of 24,905 recorded pairs (⬇0.29%), whereas the
data from Monkey N contained 101 of 101,204 correlated pairs
(⬇0.1%). Note that these seemingly low numbers are still
con-siderably higher than the effective significance threshold used in
the analysis (1%, corrected for false discovery rate over the
num-ber of pattern signatures found in the data, several hundreds, and
further decreased by pattern set reduction, which removes
chance overlapping patterns, leading to an effective significance
level approximately equivalent to 0.01% or lower; see Materials
and Methods, SPADE analysis of spike synchrony for details).
The overall statistical analysis was very conservative compared
with similar studies performed on recordings involving only a
few simultaneously recorded neurons, which was necessary to
avoid FPs.
Although up to four single units (but typically one or two)
were recorded from individual electrodes, the significant patterns
found never involved more than one SUA per electrode. This is
partly due to the properties of the recording system we used to
collect the data. To identify the spikes recorded at each electrode,
data snippets of 1.6/1.3 ms duration in Monkey L/N, respectively,
were centered around the time points of threshold crossing. Each
snippet contained 10 data points (one every 1/30 ms) before and
38/28 data points after in Monkey L/N, respectively. These
wave-forms were then sorted offline. The spike times were set to the
threshold crossing times. During each time window used to
iso-late a spike waveform, no subsequent overlapping waveforms
could be detected on the same electrode. Therefore, these
addi-tional waveforms, if occurring, were missed, thereby leading to a
missed detection of synchronous events. For this reason,
al-though we defined synchrony by allowing for a maximum
tem-poral jitter of 3 ms, no synchronous events composed of neurons
recorded on the same electrode occurred often enough to become
statistically significant. As shown above, the probability for
neu-rons to be involved in a synchronous spike pattern decayed with
their distance. This suggests that many more patterns are likely to
have occurred among the neurons close to the same electrode
than those we detected.
To relate the spatial organization of synchrony to behavior, we
additionally investigated the location on the array of neurons
involved in synchrony.
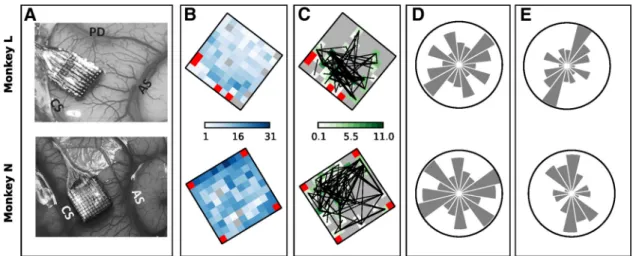
Figure 6
A shows, for Monkeys L and N,
the location of the array on motor cortex with respect to central
sulcus, arcuate sulcus, and precentral dimple (compare Fig. 1 in
Riehle et al., 2013
).
Figure 6
B shows the total number of SUAs
recorded on each electrode summed over all sessions (color
coded). In total, 700 SUAs were considered in Monkey L and
1426 in Monkey N. All selected sessions were recorded on
sepa-rate days, typically with several days in between the recordings.
Based on previous studies (
Dickey et al., 2009
;
Vaidya et al.,
2014
), we expect the fraction of identical cells across sessions to
be small. To verify this, we investigated whether patterns that
occurred in more than one session resulted from identical
under-lying neurons. To this end, we identified patterns that were found
A
B
Figure 3. Significant patterns in one representative session. A, Composition of neuron identities (horizontal axis) of each significant pattern in the session (vertical axis, pattern IDs 0 –5). B, Each panel shows one color map associated to a specific significant pattern. The color map shows the uncorrected p-value of the pattern’s signature in each trial type and epoch (color progression in logarithmic scale). Squares with the black dot indicate the session’s trial type and epoch where the pattern was classified as statistically significant.
in more than one session on the same electrodes (regardless of the
ID associated with each participating SUA in each session) and
found only six such patterns in Monkey L and two in Monkey N.
None of these patterns occurred in
⬎2 sessions. The inspection of
the SUAs recorded at these electrodes revealed, based on their
waveforms, their interspike-interval histograms and their activity
profiles obtained during each of the four trial types, that the two
repetitions always consisted of different neurons.
Figure 6
C
shows the color-coded number of SUAs recorded on each
elec-trode and involved in a significant pattern summed over sessions
and normalized by the number of SUAs recorded on that
elec-trode and shown in
Figure 6
B. Neurons involved in significant
patterns did not exhibit any spatial arrangement specific to the
trial type or to the epoch (data not shown). We also investigated
the spatial orientation of pairs of neurons involved in
synchro-nous spiking activity and computed their orientation on the grid
as angles between
⫺/2 and ⫹/2, where 0 degrees correspond
to the anterior–posterior orientation and
⫾/2 to the
mediolat-eral one. The pattern orientations are shown in
Figure 6
C as
overlaid black lines between any two electrode positions from
which the two respective neurons were recorded. Visual
inspec-tion did not reveal a clear preferred orientainspec-tion.
However, when building the orientation histogram in polar
coordinates by pooling the angles of all pattern orientations
found in 8 ranges of amplitude
/8 each, and by normalizing each
bar by the total number of recorded neuron pairs that could have
formed a pattern orientation in that range (
Fig. 6
), we found for
both monkeys a preferred orientation of neuron pairs involved in
significant patterns in the mediolateral orientation (see
Fig. 6
E
for patterns detected during the movement epoch). Indeed, the
number of such pairs is significantly higher ( p
⬍ 0.05 in both
monkeys) than expected on the basis of the fraction of recorded
neuron pairs placed along that orientation. This orientation was
shown previously to subserve the tight functional coupling
be-tween proximal and distal representations of the upper limb
dur-ing the performance of complex reach-to-grasp movements
(
Riehle et al., 2013
). We also explored whether the pattern
orien-tation was specific to the trial types or the behavioral epochs, but
we did not find any qualitative differences to the result found for
the overall average (data not shown).
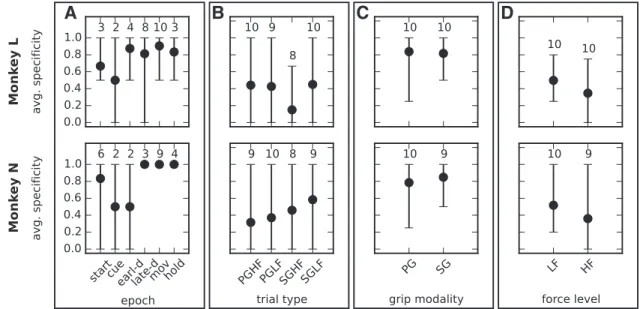
Specificity of patterns to behavioral context
To assess whether patterns are specific to behavior, we considered
four behavioral contexts: epoch, trial type, grip modality and
force level. Each behavioral context has multiple instances: six
trial epochs, four trial types, two grip modalities, and two force
levels, respectively. For each instance i, we quantified its pattern
specificity S
iby the fraction of patterns found in that instance
(e.g., start epoch) and not in other instances of the same context
(e.g., other epochs), as defined in Equation 1. S
i⫽ 1 implies
maximal specificity and S
i⫽ 0 no specificity.
Starting with the six different epochs from start to hold, we
determined separately for each session the ensemble P
iof
signif-icant patterns found in that session during each epoch i, pooling
across all trials regardless of the trial type. For instance,
Figure 3
B
shows that, in our representative session, the hold epoch
con-tained 2 patterns, named with IDs 0 and 1, and these patterns
were only significant in this epoch, which yields pattern
specific-ity 1. Similarly, the start epoch and the movement epoch
con-tained 1 and 3 patterns, respectively, occurring in those epochs
only and yielding again specificity 1. The other epochs of this
session contained no significant pattern and no pattern
specific-ity value could be assigned to them. For each epoch, we then
averaged its pattern specificity across sessions. The results,
illus-trated in
Figure 7
A separately for each monkey, indicate that
most epochs exhibited a high (
⬎0.6) or very high (⬎0.8) pattern
specificity; that is, they contained a majority of patterns that did
not occur in other epochs. An exception is represented by the cue
epoch in both monkeys and by the early-delay epoch in Monkey
N, which show specificity 0.5. However, all 3 cases resulted from
an average computed across 2 sessions only, taking values 0 and 1,
whereas the other sessions did not contain significant patterns in
that epoch. Therefore, we could not draw a conclusion on pattern
specificity for these epochs. In contrast, the late-delay, the
move-ment, and the reward epochs exhibited pattern specificity 1 or
close to 1 in both monkeys. Interpreting significant patterns as
the signatures of cognitive processing that involves the activation
of specific cell assemblies, these results suggest that assemblies
become selectively active with respect to specific behavioral
demands.
We analogously computed pattern specificity for each of the
four trial types regardless of the epochs during which they were
found. In our example from
Figure 3
B, the pattern specificity for
the different trial types in the representative session was 0 for
SGHF, 0.67 for SGLF, and 1 for PGHF and PGLF. The pattern
specificity for the different trial types averaged across sessions,
shown in
Figure 7
B, ranged between 0.15 (low) and 0.6 (high).
Because each trial type was defined as the combination of the grip
modality and the force level required to accomplish the task, we
A
B
C
D
Figure 4. Pattern statistics across sessions. Various statistics of the significant patterns de-tected across the 10 selected sessions separately for each monkey (columns). A–C, Total num-ber of significant patterns in each epoch (colors mark the contribution of each trial type; A), their average size (B), and their average number of occurrences (C). D, Average distance between electrodes on which neurons are recorded that are involved in the same pattern. Whiskers in panels B–D indicate the SD when it is⬎0.
disentangled the two aspects by further computing the pattern
specificity for the grip modality (SG vs PG) regardless of the force
level and the epoch (
Fig. 7
C) and for the force level (HF vs LF)
regardless of the grip modality and the epoch (
Fig. 7
D). The
results show high or very high grip-type specificity (⬎0.8) and
low force-type specificity (
⬍0.5). The combination of both
ex-plains the moderate specificity values found for the trial types.
Following the same line of argument as before, we concluded
that, in our data, specific grip modalities, but not specific force
levels, were associated with the activation of specific cell
assemblies.
Specificity of pattern clusters
Individual neurons often participated in multiple significant
pat-terns (
Fig. 3
A). When interpreting patterns as signatures of cell
assemblies associated with a specific behavior or condition,
dif-ferent but overlapping patterns may reflect either a common cell
assembly with an activation that recruits each time only a subset
of its composing neurons, or different cell assemblies that share
some of the composing neurons. To distinguish between these
two hypotheses, we investigated whether different but
overlap-ping patterns were found during the same behavioral context or
not, which support the first and the second hypothesis,
respec-tively. To this end, for each session, we first grouped by means of
a clustering algorithm all patterns found during that session
(across all trial types and epochs) into ensembles characterized by
a similar neuronal composition (for details, see Materials and
Methods, Pattern clustering). Given n total patterns in a session,
the clustering algorithm evaluates for each integer k
⫽ 1, 2, . . . , n
how well these patterns can be separated into a configuration of k
clusters by assigning a cost to that configuration, as illustrated in
Figure 8
B. The algorithm selects the optimal number
k
ⴱof
clus-ters and the associated optimal configuration based on the lowest
cost.
A
B
Figure 5. Dependence of synchrony on electrode distance. A, Distance of the electrodes on the recording array (white dots) from one reference electrode (cross at the bottom left corner). Dark to light shaded areas cover regions at progressively larger distances from the reference electrode from 0.4 mm up to 5.4 mm in steps of 1 mm. B, Histogram showing, for each distance range, the ratio between the number of neuron pairs involved in the same pattern and placed within that range from each other (summed across patterns found in any session, epoch and trial type) and the total number of recorded neuron pairs placed at that distance (vertical axis). The numbers inside each bar represent the relative height of each bar with respect to the sum of all bars; that is, the relative fraction of neuron pairs involved in the same patterns placed at a given distance.
Figure 6. Spatial arrangement of neurons participating in significant patterns. A, Locations of the electrode arrays in the motor cortex in the right hemisphere of the two monkeys. CS, Central sulcus; AS, arcuate sulcus; PD, precentral dimple. B, Color maps of the total number of SUAs recorded on each electrode of the recording array summed across all selected sessions. Red squares indicate the four unconnected electrodes. C, Color maps showing, for each electrode, the total number of patterns found that involved neurons recorded on that electrode. The number is obtained separately for each session (summing across all epochs and trial types) divided by the total number of single neurons recorded on the electrode in the session and finally summed across sessions. The final value can exceed the number of sessions (10) if, for instance, in each session there were more significant patterns involving the electrode than neurons recorded by that electrode. Gray squares correspond to a value of 0 and indicate electrodes that never recorded single neurons involved in significant patterns. Black lines connect electrode pairs extracted from each significant pattern found. D, Number of all possible pairs of recorded neurons placed along each orientation. Each panel shows a bar chart in polar coordinates. The direction of each bar corresponds to one orientation on the recording array, whereas the length of the bar represents the total number of neuron pairs placed along that direction computed for each session and summed across sessions. The circles have a diameter of 5000 for Monkey L and of 18,000 for Monkey N. E, Spatial orientation of all pairs of neurons involved in significant patterns found during movement as a fraction over the total number of recorded neuron pairs with that orientation shown in D.
Figure 8
A illustrates, for the already discussed representative
session of Monkey N (compare
Fig. 3
A), how its n
⫽ 6 patterns
are optimally clustered into
k
ⴱ⫽ 3 clusters. Each cluster is
iden-tified by a different color.
Figure 8
B shows the cost of each
con-figuration of k
⫽ 1, 2, . . . , 6 clusters with a minimum at k* ⫽ 3.
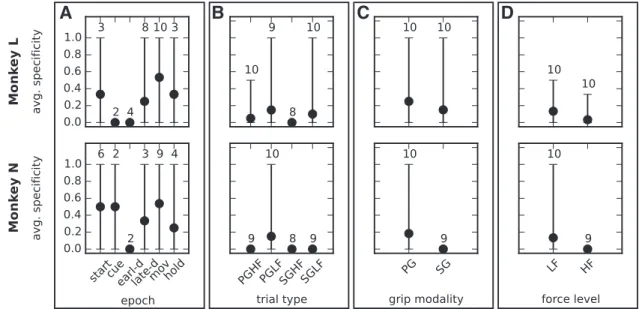
Moreover, for each session we computed the cluster specificity
of each behavioral context (Eq. 2), which was analogous to what
was done for pattern specificity. For instance, the cluster
specific-ity of one epoch reflects the fraction of clusters found in that
epoch (regardless of the trial type) and in that epoch only. By
definition of specificity, no values can be assigned to datasets
containing no significant patterns and for which no cluster can
therefore be identified.
We performed the pattern clustering and computed the
clus-ter specificity of each behavioral context (epoch, trial type, grip
modality, and force level) separately on each session.
Figure 9
shows the results averaged across all sessions for each monkey.
Epochs have an overall cluster specificity of 0.3 to 0.5 (
Fig. 9
A),
which drops to
⬍0.2 for trial types (
Fig. 9
B), grip modalities (
Fig.
9
C), and force levels (
Fig. 9
D). These results indicate that groups
of similar patterns are not specific to any of the defined
behav-ioral contexts, unlike individual patterns. This finding supports
the second hypothesis outlined above, namely that different cell
assemblies, as identified by different patterns, are associated with
different behavioral contexts despite involving partially identical
neurons.
Discussion
In this study, we examined the emergence of patterns of precise
synchronous spiking activity in massively parallel recordings
from macaque motor cortex during execution of an
instructed-delay reach-to-grasp task (
Riehle et al., 2013
). We used the
SPADE analysis (
Torre et al., 2013
), which combines a frequent
item-set mining approach to find repeating patterns of
synchro-nous spikes efficiently in large datasets with a hierarchy of
statis-tical tests to determine their significance without incurring severe
multiple testing issues.
We found significant patterns in both monkeys, occurring
mainly, but not exclusively, during movement (
Fig. 4
A). In
pre-vious studies (
Riehle et al., 1997
;
Kilavik et al., 2009
;
Denker et al.,
2011
), we found excess spike synchrony preferably during the
preparatory period in epochs related to expected events. In our
current study, all epochs were aligned to expected cues and,
in-deed, we found patterns during all of these epochs. Interestingly,
we found more patterns in Monkey L before the GO signal
com-pared with Monkey N, despite having recorded significantly less
neurons in the first animal. Monkey L also exhibited shorter
re-action times, which may be interpreted as a better anticipation of
the GO signal and may explain the larger number of patterns
A
B
C
D
Figure 7. Pattern specificity for different behavioral contexts. The four panels show the pattern specificity at each instance of the four behavioral contexts: epochs (A), trial types (B), grip modalities (C), and force levels (D). The values were calculated for each monkey across all sessions. The bars extend between the minimum and maximum value across sessions. The numbers above each bar indicate the number of sessions that actually contained significant patterns in that instance (e.g., in that epoch). When this number is 2, then the values taken by the 2 corresponding sessions are the ends of the range. The other sessions did not contain significant patterns, so a pattern specificity value could not be calculated.
A
B
Figure 8. Outcome of clustering for one representative session. A, Crosses indicate the neu-ron IDs (horizontal axis) of each pattern detected in the session (vertical axis; as inFig. 3A). Red,
blue, and green colors identify the membership of each pattern to one of k*⫽3clusters.B,Cost associated with each number k of clusters, k⫽ 1, 2, . . . , 6.
found during the delay epochs. In addition, the movement task
requested in the current experiment was more complex and
re-quired more concentration by the subjects compared with our
former studies. This may explain the larger amount of patterns
found during the movement period compared with the other
epochs.
The found patterns involved primarily two, but also three or
more neurons (
Fig. 4
B). These numbers were likely reduced by
the fact that we preprocessed the data by removing all spikes
forming hypersynchronous events at sampling precision
␦ ⫽ 1/30 ms, which we assumed to be artifacts because they
occurred beyond the chance level determined by the firing rates
and at a too high temporal precision to be explained by true
correlations. By removing hypersynchronous spikes, we also
likely removed real spikes from some of the synchronous events
that we found.
Each significant pattern occurred up to hundreds of times
(
Fig. 4
C). Even though the neurons forming one pattern typically
belonged to non-neighboring electrodes (
Fig. 4
D), the
probabil-ity that two neurons belonged to the same pattern decreased with
their distance (
Fig. 5
B). Previous studies also reported spike
syn-chrony decaying with distance within a similar (
Berger et al.,
2007
) or shorter (
Kwan et al., 1987
;
Gray et al., 1989
;
Murthy and
Fetz, 1996
;
Smith and Fetz, 2009
) spatial range.
We further determined whether patterns were specific to the
behavioral context such as behavioral epoch, trial type, grip
mo-dality, and force level. Pattern specificity for a behavioral context
was defined such to take a large value when a majority of the
patterns were detected as significant only in that context (e.g.,
during the start epoch or during side grip trials). High pattern
specificity for one behavioral context may indicate that the
asso-ciated patterns are involved in information processing for that
specific context. Our results revealed for both monkeys a high
pattern specificity for epochs (in particular start, late-delay,
movement, and hold;
Fig. 7
A) and grip modality (
Fig. 7
C), but
not for force level (
Fig. 7
D). The high specificity for individual
epochs matches earlier studies showing that distinct populations
of neurons are involved in movement preparation and execution
in instructed-delay motor tasks (
Wise et al., 1983
;
Riehle and
Requin, 1989
; for review, see
Riehle, 2005
;
Confais et al., 2012
).
The present observation suggests that synchronous spiking
activ-ity may play a critical role in the processing of information in
motor cortex. The contrasting degree of specificity between grip
types and force levels is likely to reflect functional properties of
the cortical location at which the array was implanted. In a
pre-vious study (
Milekovic et al., 2015
), we demonstrated that grip
types could be precisely decoded from the neuronal data, whereas
force-level decoding was less precise. It seems therefore plausible
that synchronous spiking activity may contribute to the fine
tun-ing of neuronal activity for different types of movements, for
example, by engaging an assembly of neurons targeting similar
sets of muscles (
Jackson et al., 2003
).
Some of the patterns found in the data partly shared the same
neurons. We investigated whether overlapping patterns may be
associated to a common cell assembly that required only a subset
of its neurons to fire synchronously each time. Otherwise, the
presence of overlapping patterns would suggest that the same
neuron participates in different assemblies at different times. To
discriminate between these two cases, we grouped similar
pat-terns and computed the specificity of behavioral contexts in
terms of pattern clusters rather than individual patterns. The
results, shown in
Figure 9
, indicate a very low cluster specificity
for all behavioral contexts, supporting the second hypothesis that
overlapping patterns indeed reflect the activation of different
as-semblies.
We also investigated the spatial organization of significantly
correlated pairs of neurons in the forelimb area of monkey motor
cortex and found a preferential alignment of the patterns along
the mediolateral axis. This orientation is perpendicular to the
dominant orientation reported for traveling waves of beta
oscil-lations in the local field potential (
Rubino et al., 2006
) or the
orientation of information flow between individual neurons as
revealed by Granger analysis (
Takahashi et al., 2015
). The
medio-lateral alignment is, however, consistent with the dominant
alignment of synchronized pairs of neurons in the motor cortex
along the central sulcus (
Kwan et al., 1987
). This alignment may
subserve the tight functional coupling between proximal and
dis-tal representations of the upper limb during the performance of
complex reach-to-grasp movements, as already shown in
Riehle
et al. (2013)
. In that study, we demonstrated that the first
com-A
B
C
D
Figure 9. Cluster specificity for different behavioral contexts. The four panels show the cluster specificity value for epochs (A), trial types (B), grip modalities (C), and force levels (D) analogous to Figure 7for pattern specificity.