HAL Id: hal-00304748
https://hal.archives-ouvertes.fr/hal-00304748
Submitted on 1 Jan 2002HAL is a multi-disciplinary open access archive for the deposit and dissemination of sci-entific research documents, whether they are pub-lished or not. The documents may come from teaching and research institutions in France or abroad, or from public or private research centers.
L’archive ouverte pluridisciplinaire HAL, est destinée au dépôt et à la diffusion de documents scientifiques de niveau recherche, publiés ou non, émanant des établissements d’enseignement et de recherche français ou étrangers, des laboratoires publics ou privés.
at farm and catchment scale
M. G. Hutchins, S. G. Anthony, R. A. Hodgkinson, P. J. A. Withers
To cite this version:
M. G. Hutchins, S. G. Anthony, R. A. Hodgkinson, P. J. A. Withers. Modularised process-based modelling of phosphorus loss at farm and catchment scale. Hydrology and Earth System Sciences Discussions, European Geosciences Union, 2002, 6 (6), pp.1017-1030. �hal-00304748�
Modularised process-based modelling of phosphorus loss at farm
and catchment scale
M.G. Hutchins
1, S.G. Anthony
1, R.A. Hodgkinson
2and P.J.A. Withers
31ADAS Wolverhampton, “Woodthorne”, Wergs Rd, Wolverhampton, WV6 8TQ, UK 2ADAS Gleadthorpe, Meden Vale, Mansfield, Nottinghamshire, NG20 9PF, UK 3ADAS, Sunnyhill House, 1 Thistlebarrow Rd, Salisbury, Hampshire, SP1 3RU, UK
E-mail for corresponding author: [email protected]
Abstract
In recent years, a co-ordinated programme of data collection has resulted in the collation of sub-hourly time-series of hydrological, sediment and phosphorus loss data, together with soil analysis, cropping and management information for two small (< 200 ha) headwater agricultural catchments in the UK Midlands (Rosemaund, Herefordshire and Cliftonthorpe, Leicestershire). These data sets have allowed the dynamics of phosphorus loss to be characterised and the importance of both storm runoff and drainflow to be identified, together with incidental losses following manure and fertiliser additions in contributing to total annual loss. A modularised process-based model has been developed to represent current understanding of the dynamics of phosphorus loss. Modules describing runoff and sediment generation and associated phosphorus adsorption/desorption dynamics are described and tested. In the model, the effect of a growing crop on sediment detachment processes is represented and the stability of topsoil is considered so that, overall, the model is responsive to farm management factors. Importantly, using data sets available from national-scale survey programmes to estimate model parameters, a transferable approach is presented, requiring only sub-hourly rainfall data and field-specific landcover information for application of the model to new sites. Results from application of the model to the hydrological year 1998–99 are presented. Assessment of performance, which suggests that the timing of simulated responses is acceptable, has focused attention on quantifying landscape and in-stream retention and remobilisation processes.
Keywords: phosphorus, erosion, process-based modelling, agriculture
Introduction
The loss of phosphorus from agricultural fields into water courses is of environmental concern as such losses, although agriculturally insignificant, may be environmentally damaging by encouraging eutrophication (Foy and Withers, 1995). Soil erosion, an important mechanism of phosphorus loss, contributes to the siltation of river beds used as spawning grounds for fish species. Furthermore, the cumulative effect of successive erosion events has adverse implications for the agricultural sustainability of soil reserves. Past and current research shows that losses of adsorbed soil-bound phosphorus are closely linked to particulate mobilisation and erosion loss from fields. In winter when heavy rainfall is most prevalent, tilled fields unprotected by cover crops are particularly vulnerable to such sediment losses (Chambers et al., 2000). For many years, data from numerous studies (e.g. Ryden et al., 1973;
Johnson et al., 1976; Heathwaite et al., 1989) have revealed that phosphorus is transferred from agricultural land predominantly during intense and short-lived storm events which result in significant concomitant sediment fluxes in stream waters.
The problem of eutrophication is acknowledged by scientists and policy makers as a catchment-scale issue. Because of the unpredictable and acute nature of phosphorus loss mechanisms, researchers have adopted a pragmatic approach, concentrating on the development of input-driven export coefficient approaches (Beaulac and Reckhow, 1982; Johnes et al., 1996; McGuckin et al., 1999), which focus on annual predictions. The seasonal variability of processes, mechanisms of phosphorus release and position in the landscape (e.g. hillslope processes) are typically not represented explicitly; the effects of these factors are included in a set of coefficients, the values of which may
vary between catchments. However, actions necessary to reduce agricultural inputs must be optimised within individual farm units so that the scope for inducing change is influenced by “whole farm” economics and by the range of land use within a farm and its interaction with the features inherent in the landscape. Therefore, losses at field and farm scales have to be predicted and the processes within the chosen model have to be represented explicitly. At the same time, model development must recognise the need to develop methods relying on data available at the national scale (from surveys etc.) to enable application at ungauged sites for predictive purposes.
If the chosen model is to respond to management decision-making, accurate sub-hourly characterisation of both dissolved and particulate P loss from agricultural land is an essential precursor to the prediction of annual fluxes. Losses of P have been observed in both phases. Whilst much of the bioavailable fraction of total P is in the dissolved form (Heckrath et al., 1995), particulates may still make a significant contribution to total P concentrations (Sibbesen and Sharpley, 1997), particularly in lowland river systems (Muscutt and Withers, 1996; Jarvie et al., 1998). This research illustrates the persistent influence of particulate losses from agricultural land, despite the presence of point source inputs. Furthermore, Oslo/Paris Commission (OSPARCOM) objectives require mitigation against total P losses (both particulate and dissolved) to the marine environment.
Model description
At field-scale, runoff and sediment responses are very dynamic and fundamental in controlling the kinetics of P desorption (Quinton et al., 2001; Kronvang, 1992). Phosphorus loss has a particulate and dissolved phase, the latter being controlled by P desorption kinetics. Hence, the approach adopted here uses 30-minute resolution rainfall time-series to quantify runoff volume (surface runoff plus bypass flow), soil loss and fluxes of TDP and TPP from individual storms. Therefore, modelling assesses within-storm dynamics in addition to total annual losses. The intention has been to link specialist models in series in a modularised approach rather than making use of existing integrated model environments (e.g. EPIC (Williams et al., 1990), WEPP (Nearing et al., 1989)) with associated feedback and hence, uncertainty in parameterisation is compounded. Modularisation allows individual model components to be tested with observed data. There are numerous models available for prediction of P loss to watercourses (Knisel, 1980; Beasley et al., 1982; Nearing
et al., 1989; Williams et al., 1990); over time, agreement
has been reached in (a) identifying sediment mobilisation as a key process in controlling P loss and (b) representing this process. Hence, rather than develop a wholly new approach, results presented have involved application of two well-founded models to a situation for which, in terms of spatial and temporal resolution, there is a dearth of suitable models (i.e. with achievable information requirements). Whilst the focus has been on the linkage between runoff and sediment fluxes and P mobilisation, other modules (e.g. storm simulator, crop growth model, soil hydrology model, predictor of physical and chemical retention) may be invoked as required.
The two models adopted were: (a) the runoff and sediment loss model, EUROSEM (Morgan et al., 1998a), (b) a phosphorus dynamics transfer function developed for prediction of a bulked concentration in hillslope runoff at the plot scale (Sharpley et al., 1995). It is assumed that overland flow is the original mechanism for phosphorus mobilisation and loss, although a review by Simard et al. (2000) summarises widely acknowledged opinion that preferential pathways (e.g. cracks and macropores) are important in P transport. Conceptually the model can allow for such sub-surface pathways of transfer. While it is assumed that P mobilisation via subsurface matrix flow in the soil and its contribution to stream P fluxes is negligible, the modularised nature of the approach would allow this pathway to be incorporated in the future if it were deemed necessary.
RUNOFF AND SEDIMENT LOSS
EUROSEM has been used without modification to the original version. The model was chosen for its consideration of crop management and its ability to capture within-storm dynamics. Processes of splash detachment of soil particles from rainfall and particulate mobilisation and redeposition through surface runoff are represented. Rainfall impact is determined from the kinetic energy of incident rainfall which is modified quantitatively using crop cover information. Further details are given in Morgan et al. (1998a). Application for this project used the equations of Everaert (1991) to simulate sediment transport as recommended by Quinton (pers. comm.).
Farm-scale catchments (i.e. catchments ideally comprising no more than three or four farms) can be represented by a configuration of planar elements (typically corresponding to field boundaries), making use of soil physical and hydrological properties, slope gradient and crop type/growth information for parameterisation. Planar elements may have direct linkage to the stream, representing good landscape connectivity (e.g. field drains) or form part of a cascade,
thereby allowing retention to take place at breaks in slope as well as within an individual element. Despite considerable parameterisation requirements for individual planes (over 35), use of EUROSEM is practicable given the extensive level of documentation provided by the authors (Morgan et
al., 1998b) and available on the Internet. Specifically, the
information is particularly useful in that it guides parameter estimation using data readily available at regional scale in the likely absence of a full suite of direct measurements. Aside from a need for sub-hourly rainfall time-series, these information requirements fall into four categories.
z Soil properties. These include (i) hydrological
characteristics such as saturated hydraulic conductivity, porosity, moisture content at saturation, and (ii) physical characteristics such as median particle size, soil erodibility and cohesion. In the absence of measurements as is the case here, all these parameters may be estimated from the particle size distribution of the topsoil. These data have been taken from soil maps and a database of soil associations (Proctor et al., 1998). Consequently, it is acknowledged that model predictions are subject to some uncertainty.
z Initial soil moisture content: a state variable. This has been estimated using the IRRIGUIDE evapotranspiration and soil moisture model (Bailey and Spackman, 1996)
z Seasonally variable parameters describing the roughness of the soil surface (including Manning’s “n”) and crop physiography (e.g. plant height, fractional ground cover). These parameters are determined from rainfall data and farm management records, together with benchmark published information on the dynamics of crop growth (e.g. HGCA, 1998). Earth observation can be helpful in determining crop type and fractional ground cover (Hutchins et al., 2000), although such information has not been used for this project. Surface roughness is greatest following ploughing and this maximum value is dependent on cultivation method. Successive rainfall events compact the soil surface, reducing roughness. Whilst surface roughness has physical meaning and is measurable directly, the seasonal dynamics of this parameter can be estimated using knowledge of hourly rainfall intensity and crop development. Method of cultivation, sowing date (e.g. contrast between winter and spring cereals) together with crop-type-dependent physiology of plant growth are important factors defining parameter estimation. Therefore, this allows for sensitivity in model output to land management decisions.
z Geometry of planar elements. Slope length and slope
angle are important factors determining erosion (e.g. USLE (Foster, 1989)). The model may also use information on tramline characteristics and density. This includes tramline orientation with respect to maximum slope angle. Slope characteristics were defined from field surveying and OS Profile DTM data (10 m spatial resolution).
PHOSPHORUS DYNAMICS
Two algorithms are defined by Sharpley et al. (1995) to estimate the phosphorus content in mobilised sediment and the proportion desorbed into solution.
Dissolved (mg l–1): TDP = K P
av D B ta Wb / V
Particulate (mg l–1): TPP = soil total P x E x PER
Pav = available soil P content (mg m–3)
D = effective depth of interaction (mm) B = bulk density (mg m–3)
t = time-step (min)
W = runoff water/soil ratio (l g–1)
V = total runoff (mm)
K, a, b = kinetic parameters related to soil % clay and % organic C
E = sediment concentration (g l–1)
PER = phosphorus enrichment ratio
Available and total soil P content were estimated from topsoil Olsen P and total P measurements respectively from individual fields. Bulk density, fraction of clay sized material and organic carbon content (the K, a and b parameters) were estimated using the soil maps and the soil association database (Proctor et al., 1998). The database gives topsoil values for bulk density and organic carbon under both permanent grassland and arable land and use has been made here of this distinction. The values K, a and b represent the kinetic dynamics of phosphorus release into solution. Sharpley (1983) related % organic C content and % clay content to soil properties known to control adsorption and desorption processes such as the Fe, Al and Ca content of soils. The effective depth of interaction and the phosphorus enrichment ratio have been estimated from sediment loss (kg ha–1) using the methods of Sharpley (1985) and Sharpley
et al.(1995). The relationship between available soil
phosphorus content and the concentration in solution is assumed to be linear.
The model has been adapted to characterise the active surface layer where P is exchanged between mobile and immobile water and sediment. This has been done by considering not only mobilised sediment and runoff in the
calculation of W, but also the soil and soil water in the active surface layer. Further adaptation allows for phosphorus loss predictions from each planar element on a time-series basis, applying water and sediment fluxes produced by EUROSEM as input data. Here the input information has typically been applied to the algorithms at 1 minute resolution when considering storms of between 30- and 180-minute duration.
Study sites, methodologies and
conceptual representation
Time-series of total dissolved P (TDP) and total particulate P (TPP), together with suspended sediment data, have been modelled for the period August 1998 – July 1999 at two first order catchments in the UK:
(i) Jubilee station, Rosemaund, Herefordshire (30.6 ha catchment) (Fig. 1),
(ii) Cliftonthorpe (98.6 ha subcatchment of the Gilwiskaw Beck) within the River Trent basin, Leicestershire (Fig. 2). This area has also been disaggregated into subcatchments.
The Rosemaund experimental catchment (Williams et al., 1996) situated near Hereford drains into the River Lugg
and is characterised by soils from the Bromyard series of silty clay loam texture which are subject to cracking. Mean annual precipitation is approximately 660 mm. The research farm, which covers most of the catchment above Jubilee station, is underdrained extensively and is predominantly under arable cultivation but with some permanent grassland and small woodland areas. The Cliftonthorpe catchment (Dils and Heathwaite, 1997) situated near Ashby-de-la-Zouch in Leicestershire is similar in that it receives approximately 660 mm rainfall per year and is extensively underdrained. The catchment is made up of three farms, a mixed farm (predominantly arable), an arable farm and a livestock farm. A complex distribution of soil types characterises the catchment, with clay loam (mainly Salop) predominating but also with significant areas of lighter textured sandy silt loams (mainly Eardiston).
Time series of rainfall, stream flow and suspended sediment data at half-hourly resolution have been collected at the two sites for many years making use of electronic data capture systems (Campbell Scientific CR10). Discharge was measured using a V-notch weir at Rosemaund and a rectangular throated flume at Cliftonthorpe. Suspended sediment was recorded using turbidity sensors calibrated frequently against spot measurements. Flow proportional sampling of storm events and regular baseflow sampling (Epic, model 1011) and analysis of stream water for total
#
# #
0 200 400 Meters ADAS Rosemaund fieldstexture: silty clay loam
Jubilee catchment Monitoring points # # N Jubilee station Others
Field Crop Olsen P
(mg/kg) Total P(mg/kg) Stoney (S) Brushes (B) Foxbridge (F) Longlands (L) Slade Hopyard (SH) W Barley W Barley W W heat W W heat W Oats 21 21 21 16 88 375 375 342 337 785 B F L S SH Stone Farm
Fig. 2. Map of the New Cliftonthorpe catchment showing location of
fields and monitoring points
phosphorus (TP), total dissolved (< 0.45 µm) phosphorus (TDP) and molybdate-reactive phosphorus (MRP) have supplemented these data. Total particulate phosphorus is expressed as the difference between TP and TDP. MRP was determined colorimetrically (Murphy and Riley, 1962). TDP and TP were determined either by Inductively Coupled Plasma Atomic Emission Spectroscopy (ICP-AES) following acid digestion or by colorimetry following alkaline persulphate microwave digestion.
Additional information was required to parameterise the model. Field-specific management information relating to crop type, sowing date, date and quantity of managed fertiliser/manure additions and stock movements were obtained from farm records or farmer interviews. Topsoil P content was determined on a field-specific basis. Olsen P and total P determinations were made (MAFF, 1986). Soil association was taken from LandIS maps (Proctor et al., 1998), allowing assignment of dominant textural class on a field or sub-field basis.
Figures 1, 2, 3 and 4 illustrate the data used to run the model, along with the conceptualisation adopted at Rosemaund and Cliftonthorpe respectively. Parameter values are given in Table 1. Certain elements at Cliftonthorpe were parameterised in a more specific way than has been customary, making use of additional observations. Changes in slope within some individual fields have been represented. The third Long Meadow element and the second Karey Hill/ Ossies element were assigned higher initial soil moisture status and lower fractional ground cover than elsewhere to represent the occurrence of poaching. The soil surface in Ritz and Middle fields is prone to sealing and soil physical
Stoney (10%) Stone Farm: Grass (3% slope) Brushes/Stoney (10%) Longlands (10%) Foxbridge (3%) Woodland (3%) Slade Hopyard (3%) Grassland Arable
Fig. 3. Model conceptualisation of the Jubilee catchment, Rosemaund
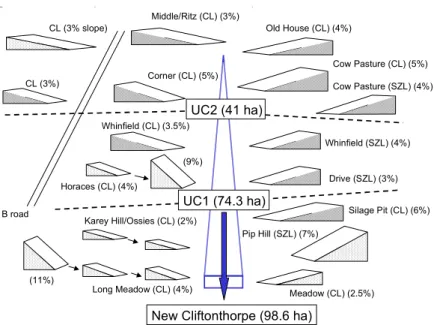
0 400 800 Meters N 1 3 4 8 2 7 5 6 10 15 14 9 13 11 12 1 5 5 6 6 15 Field Crop (1998-99) Olsen P (mg/kg) Total P (mg/kg) Middle/Ritz (1) Old House (2) Corner (3) Cow Pasture (4) unknown (5) unknown (6) Whinfield 1 (7) Whinfield 2 (8) Drive (9) Horaces (10) Pip Hill (11) Meadow (12) Silage Pit (13) Long Meadow (14) Karey Hill/Ossies (15) S Barley W Barley S Barley W Wheat Grass W Cereal Fallow Fallow Grass Grass Grass Grass Kale Grass Grass 23 25 43 33 25 31 5 11 41 14 27 9 22 15 19 686 535 548 558 622 526 445 425 700 511 681 539 685 475 602
Cow Pasture (SZL) (4%)
UC1 (74.3 ha) UC2 (41 ha)
New Cliftonthorpe (98.6 ha)
Middle/Ritz (CL) (3%) Old House (CL) (4%) Cow Pasture (CL) (5%) CL (3%) Whinfield (SZL) (4%) Drive (SZL) (3%) Whinfield (CL) (3.5%) Horaces (CL) (4%) Silage Pit (CL) (6%) Pip Hill (SZL) (7%) Meadow (CL) (2.5%) Long Meadow (CL) (4%) Karey Hill/Ossies (CL) (2%) B road Corner (CL) (5%) CL (3% slope) g p p (9%) (11%)
Fig. 4. Model conceptualisation of the New Cliftonthorpe catchment
Table 1. Main parameter values (includes ranges for parameters which change seasonally). The list is incomplete, other
parameters being defined from information in Figs 1-4. The parameter sets represent the main soil-crop combinations observed in the two catchments and do not cover all possible combinations.
Parameter Rosemaund Cliftonthorpe Cliftonthorpe Silty clay loam (Bromyard) Clay loam (Salop) Sandy silt loam (Eardiston) winter wheat mature grass winter wheat mature grass winter wheat mature grass
Clay-sized fraction (%) 23 23 24 24 15 15
Organic C (%) 1.9 2.3 2.7 3.6 1.2 2.6
Bulk density (gcm-3) 1.29 1.15 1.22 1.12 1.45 1.19
Degree aggregation 15 15 15 15 20 20
Median particle diameter (µm) 25 25 50 50 62 62
Soil raindrop detachability (g J-1) 1.6 1.6 1.7 1.7 2 2
Soil cohesion (kPa) 19 19 10 10 3 3
Sediment specific gravity (mg m-3) 2.65 2.65 2.65 2.65 2.65 2.65
Manning n (rills) 0.03 0.3 0.03 0.3 0.03 0.3
Saturated hyd. Cond. (mm/h) 1.5 1.5 2 2 13 13
Net capillary drive (mm) 720 720 533 533 375 375
Soil porosity (%) 47 47 46 46 47 47
Max moisture content (%) 43 43 39 39 44 44
Width of rills (m) 0.15 0.15 0.15 0.15 0.15 0.15
Depth of rills (m) 0.03 0.03 0.03 0.03 0.03 0.03
Rill side slope angle (mm-1) 1 1 1 1 1 1
Downslope roughness 4 to 19 4 4 to 27 4 4 to 21 4
Canopy cover (%) 0 to 90 85 0 to 90 85 0 to 90 85
Leaf shape factor 0 or 1 1 0 or 1 1 0 or 1 1
Angle of stems to soil surface (o) 0 or 85 55 0 or 85 55 0 or 85 55
Proportion basal area as vegetation 0 to 0.3 0.75 0 to 0.3 0.75 0 to 0.3 0.75
Plant height (cm) 0 to 63 5 0 to 63 5 0 to 63 5
Manning n (interrill) 0 to 0.125 0.3 0 to 0.125 0.3 0 to 0.125 0.3
Infiltration recession factor 4 to 300 4 4 to 1800 4 4 to 360 4
Maximum interception (mm) 0 to 3 1.2 0 to 3 1.2 0 to 3 1.2
parameters relating to aggregate stability have been modified for the element representing these fields. The model assumes 100% delivery from edge of field to stream gauging station. Unmarked fields are assumed to have negligible contributions to stream sediment and phosphorus fluxes.
Results and discussion
GENERAL
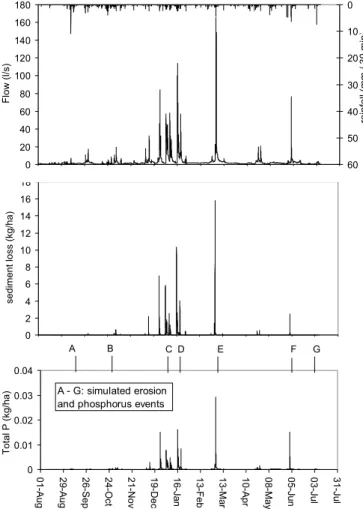
Figures 5 and 6 illustrate observed rainfall, flow, sediment and total P loss at Jubilee and New Cliftonthorpe, respectively, together with timings of simulated erosion and P loss events. The figures illustrate a wetter than average year, particularly at New Cliftonthorpe. At Jubilee, rainfall was slightly above average (674 mm), generating 286 mm of observed flow whereas at New Cliftonthorpe, 1169 mm of rainfall generated 817 mm of flow. These differences were reflected in sediment and total P responses (813 and 2.2 kg ha–1 sediment and P loss respectively at Jubilee; 1224
and 4.1 kg ha–1 sediment and P loss respectively at New
Cliftonthorpe). The dissolved fraction contributed 41% and 31% to observed TP loss at Jubilee and New Cliftonthorpe respectively.
The timing of modelled sediment and modelled total P losses are strongly related at both sites. In accordance with the considerably wetter conditions at New Cliftonthorpe, the model generated acute sediment loss events on 22 days whereas such events were predicted on only 7 days at Jubilee. On an annual basis, the model overestimated sediment loss (2411 kg ha–1) and total P loss (8.8 kg ha–1) at
New Cliftonthorpe. At Jubilee there was a slight underestimation, with a simulated sediment total of 664 kg ha–1 and total P loss of 1.4 kg ha–1. The model generates
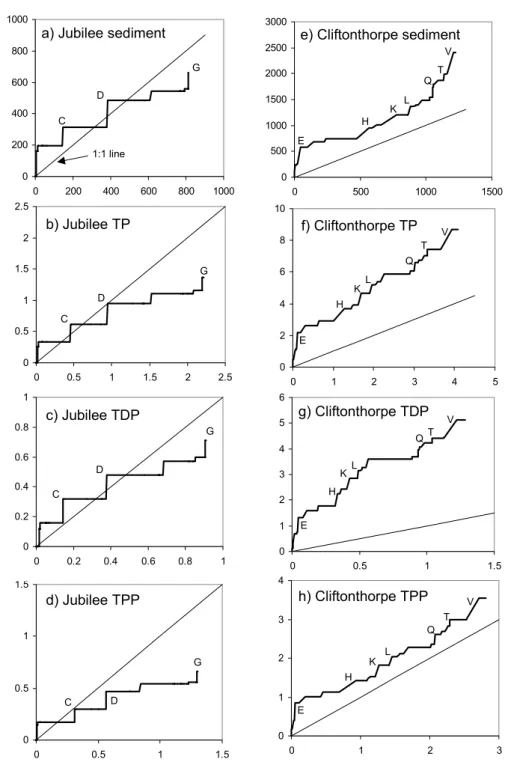
responses to the major rainfall events occurring at both sites. Figure 7 breaks down model performance, showing cumulative losses through the year at Jubilee and New Cliftonthorpe respectively. Consistently, these plots show that overestimation of sediment — and therefore P loss — is most acute in the summer when conditions are drier. However, it is suspected that fluxes were not fully captured at New Cliftonthorpe gauging station during the very intense event of 5th July, 1999. In the winter, significant fluxes of sediment and P occur at lower flows, suggesting that losses through sub-surface pathways may be occurring when soils are at or close to saturation. Alternatively, or additionally, these patterns of observed response at low flows might represent the effects of retardation of particulate material, mobilised during recent storms. In its current form, the model does not represent loss due to mobilisation in the sub-surface explicitly and does not simulate these small but
chronic losses. Neither does the model simulate the effects of retardation or retention.
On an annual basis, the proportion of total P lost as dissolved P is less than 50% at both sites. The model predicts a larger proportion of dissolved P than that observed in both cases (58% at New Cliftonthorpe, 52% at Jubilee). The overestimation of this proportion is greatest at New Cliftonthorpe. In this case, the inaccuracy may reflect (i) difficulties in assigning a representative set of values for clay content and organic carbon content for the soils present (ii) temporal variability of ‘effective’ soil P content (see later). Such overestimations may also be caused by interactions in the stream environment such as adsorption to suspended sediment and co-precipitation with calcite (House et al., 1995) resulting in an effective conversion from dissolved to particulate material. This process has been hypothesised to be active at Titley Court in Herefordshire (Silgram et al., 2001) where although TPP usually dominates stream water P composition, dissolved forms predominate in samples collected from plot scale runoff traps.
0 2 4 6 8 10 12 14 16 18
sediment loss (kg/ha)
0 20 40 60 80 100 120 140 160 180 Flow (l/s) 0 10 20 30 40 50 60 rainfall (mm / 30 min ) 0 0.01 0.02 0.03 0.04
01-Aug 29-Aug 26-Sep 24-Oct 21-Nov 19-Dec 16-Jan 13-Feb 13-Mar 10-Apr 08-May 05-Jun 03-Jul 31-Jul
Total P (kg/ha)
A B C D E F G
A - G: simulated erosion and phosphorus events
Fig. 5. 1998–9 observations at Rosemaund (Jubilee);
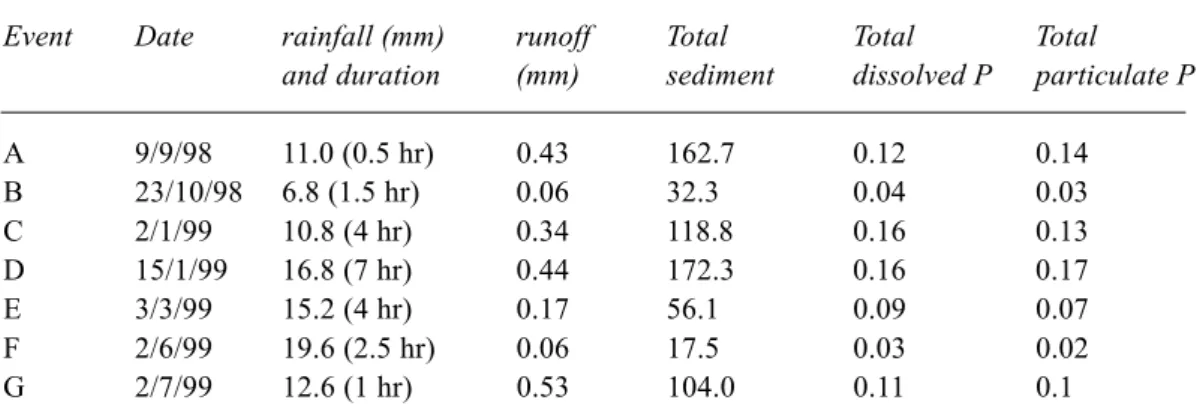
Table 2. Rosemaund Jubilee simulated event specific losses 1998-99 (kg ha–1)
Event Date rainfall (mm) runoff Total Total Total
and duration (mm) sediment dissolved P particulate P
A 9/9/98 11.0 (0.5 hr) 0.43 162.7 0.12 0.14 B 23/10/98 6.8 (1.5 hr) 0.06 32.3 0.04 0.03 C 2/1/99 10.8 (4 hr) 0.34 118.8 0.16 0.13 D 15/1/99 16.8 (7 hr) 0.44 172.3 0.16 0.17 E 3/3/99 15.2 (4 hr) 0.17 56.1 0.09 0.07 F 2/6/99 19.6 (2.5 hr) 0.06 17.5 0.03 0.02 G 2/7/99 12.6 (1 hr) 0.53 104.0 0.11 0.1 0 100 200 300 400 500 600 700 800 flow (l/s) 0 10 20 30 40 50 60 70 80 rainfall (mm / 30 mins ) 0 0.01 0.02 0.03 0.04 0.05 0.06
01-Aug 29-Aug 26-Sep 24-Oct 21-Nov 19-Dec 16-Jan 13-Feb 13-Mar 10-Apr 08-May 05-Jun 03-Jul 31-Jul
Total P (kg/ha) simulated events 0 2 4 6 8 10 12 14 16
sediment loss (kg/ha
)
Fig. 6. 1998–9 obsrvations at New Cliftonthorpe
SPECIFIC EVENTS
The predicted contribution to total sediment and phosphorus loss on individual days (i.e. individual events) is given in Tables 2 (Jubilee) and 3 (New Cliftonthorpe). The tables also show simulated runoff for these days. Currently, the only available runoff data held from these sites are from a plot facility at Rosemaund where data have been collected
since the mid-1990s. These data suggest that surface runoff accounts for 1–2% of total rainfall on an annual basis. Model results for Rosemaund in 1998–99 suggest a contribution of less than 1% although the predicted contribution of surface runoff at New Cliftonthorpe was much higher (3.9%). Typically, predicted P lost in solution as a percentage of total P loss decreases as simulated sediment and runoff fluxes increase, varying by roughly 20% between low and high flow. This trend is in accordance with observations at the two sites, where particulate P loss dominates at peak flow with a delay in the increase in contribution of dissolved phases until the storm recedes. Dils and Heathwaite (1997) identified seasonal differences in the relative contribution of particulate phases to P loss at New Cliftonthorpe, explaining these differences in terms of antecedent catchment wetness. Sediment fingerprinting work at this catchment (Russell et al., 2001) suggested a higher proportion of overland flow contribution to sediment loss at peak flows.
The largest simulated event at Jubilee (16th Jan) corresponds to the second largest instantaneous flow, sediment and P loss measurement. The model responds during all large events, with the exception of 25th December when rainfall, although persistent, lacked the intensity to generate a response from the EUROSEM model. Two events were simulated during the summer (9th Sept, 7th July) when no observed response occurred.
At New Cliftonthorpe, the model predicted the largest response on 5th July when 40 mm rain fell in two hours. The highest observed total P losses for an individual event response were at this time, being broadly comparable in magnitude to the 25th December response (Walling et al., 2002). The model gave big responses to the large loss events occurring on the 27th Oct, 25th Dec and 16th Jan. However, the second largest simulated event (23rd Oct) corresponded with smaller observed fluxes than seen in latter events (e.g. 27th Oct) and the model responded in August, September,
0 200 400 600 800 1000 0 200 400 600 800 1000 (y ) 0 500 1000 1500 2000 2500 3000 0 500 1000 1500 0 2 4 6 8 10 0 1 2 3 4 5 0 1 2 3 4 5 6 0 0.5 1 1.5 0 1 2 3 4 0 1 2 3 e) Cliftonthorpe sediment f) Cliftonthorpe TP g) Cliftonthorpe TDP h) Cliftonthorpe TPP E H K L Q T V E H KL Q T V E H KL QT V E H K L Q T V a) Jubilee sediment 0 0.5 1 1.5 2 2.5 0 0.5 1 1.5 2 2.5 b) Jubilee TP 0 0.5 1 1.5 0 0.5 1 1.5 0 0.2 0.4 0.6 0.8 1 0 0.2 0.4 0.6 0.8 1 d) Jubilee TPP c) Jubilee TDP C C D G D G G G C D C D 1:1 line
Fig. 7. Plots of cumulative flux (kg ha–1): observed (x-axis) v. simulated (y-axis)
May, June and July on a number of occasions when there was minimal response in the stream.
CATCHMENT SOURCE AREAS
The New Cliftonthorpe catchment has been monitored continuously at three locations, allowing isolation of fluxes originating from (i) a mixed/grassland arable area, (ii) an arable farm and (iii) a livestock farm. Russell et al. (2001) and Walling et al. (in press) suggest that losses of sediment
per unit area were higher from grassland than from arable land. This somewhat surprising result was explained in terms of: (i) the regular reseeding of fields, (ii) the prevalence of pastureland in naturally wetter areas near the stream, which are not only more prone to saturation and particulate mobilisation but also more highly connected to the stream channel and less susceptible to landscape retention.
Predicted and observed losses from the two monitoring points established upstream of New Cliftonthorpe are given
Table 3. New Cliftonthorpe simulated event specific losses 1998-99 (kgha-1)
Event Date rainfall (mm) runoff Total Total Total
and duration (mm) sediment dissolved P particulate P
A 23/8/98 19.0 (5.5 hr) 0.80 54.1 0.12 0.08 B 5/9/98 26.8 (5.5 hr) 1.75 47.2 0.2 0.09 C 30/9/98 24.0 (5.5 hr) 3.00 134.4 0.36 0.21 D 16/10/98 14.8 (5.5 hr) 0.10 19.8 0.07 0.03 E 23/10/98 21.8 (3 hr) 4.82 327.9 0.57 0.43 F 27/10/98 19.4 (4.5 hr) 1.82 96.3 0.28 0.16 G 8/11/98 9.0 (2 hr) 1.32 65.5 0.19 0.11 H 25/12/98 22.8 (5.5 hr) 3.15 210.9 0.47 0.31 I 3/1/99 17.2 (5 hr) 0.53 29.7 0.1 0.05 J 4/1/99 4.6 (1 hr) 0.31 23.6 0.07 0.04 K 16/1/99 19.2 (5 hr) 3.08 189.2 0.43 0.29 L 21/2/99 16.0 (4 hr) 1.83 162.7 0.3 0.23 M 2/3/99 6.6 (3 hr) 0.26 17.6 0.06 0.03 N 3/3/99 5.4 (1.5 hr) 0.24 19.6 0.07 0.04 O 10/3/99 15.0 (3.5 hr) 2.37 93.5 0.32 0.17 P 7/5/99 15.4 (3.5 hr) 0.73 50.9 0.11 0.08 Q 27/5/99 16.2 (1.5 hr) 2.83 199.1 0.26 0.25 R 29/5/99 14.4 (2 hr) 0.94 51.1 0.11 0.08 S 2/6/99 40.8 (8 hr) 1.38 75.9 0.16 0.13 T 12/6/99 12.4 (1 hr) 1.77 120.4 0.19 0.16 U 3/7/99 9.8 (1.5 hr) 0.30 20.6 0.03 0.03 V 5/7/99 39.0 (2.5 hr) 11.86 401.4 0.69 0.53
in Table 4. The results show that the mismatch of total observed and predicted losses at the catchment outlet can be attributed to overestimation of losses (or delivery of losses) from the arable fields in the upper part of the catchment. In the lower part of the catchment (predominantly grassland), losses were underestimated by 37%.
Figure 8 illustrates how prediction of cumulative sediment losses built up during the 1998–99 year following successive events. Predicted P losses follow a similar pattern. The figure suggests that losses from fields contributing to UC2 were proportionally greatest during the winter months. For example, Middle and Ritz fields, lying at the northern
extremity of the catchment, are on slopes of a very gentle gradient but contribute significantly to predicted sediment loss during winter when there is minimal ground cover and sealing of the soil surface.
The cumulative percentage modelled contributions from arable fields to sediment, TPP and TDP losses are shown in Fig. 9. Given that grassland contributes approximately 46% to the New Cliftonthorpe catchment area, these results show that arable fields were expected to contribute nearly twice as much loss per unit area as grassland fields. This contribution is higher than that estimated by Russell et al. (2001). The majority of the modelled grassland loss was from a field ploughed early in the autumn of 1998 and planted in kale for 1999 for forage. The relative importance of predicted losses from this field increased during the year as protection from erosion by crop cover increased on the arable fields. Therefore, this explains the decline in modelled percentage contribution to sediment and P loss from arable land during the late spring of 1999, prior to full establishment of kale.
Table 4. Annual losses (1998-99) at Cliftonthorpe (kg ha–1)
Station Simulated Observed
sediment TDP TPP TP TP
UC2 2944 8.18 4.47 12.65 1.91
UC1 2289 5.53 3.27 8.80 1.05
cumulative sediment loss (kg/ha) 0 500 1000 1500 2000 2500 3000 3500
1-Aug 29-Aug 26-Sep 24-Oct 21-Nov 19-Dec 16-Jan 13-Feb 13-Mar 10-Apr 8-May 5-Jun 3-Jul 31-Jul
Upper Cliftonthorpe 2 Upper Cliftonthorpe 1 New Cliftonthorpe
Fig. 8. Annual build-up (1998–9) of simulated sediment flux along the system at New Cliftonthorpe
cumulative % contribution from arable sources
50 60 70 80 90 100 1-A ug 29 -A u g 26 -S e p 24 -Oct 21-N o v 19 -D e c 16
-Jan 13-Feb 13-Mar
10 -A p r 8-Ma y 5-Ju n 3-Ju l 31 -Jul sediment TPP TDP
Fig. 9. Changes in simulated relative contribution of arable sources at Cliftonthorpe (1998–9)
SUMMARY ASSESSMENT OF MODEL PERFORMANCE
Research suggests that sub-surface losses through tile drain systems may be important contributors to P losses at both study catchments and that particulate forms are significant (Chapman et al., 2001; Dils and Heathwaite, 1997). Sediment fingerprinting work (Russell et al., 2001) suggests drain flow may contribute as much as 50% of annual sediment loss at Jubilee, although the contribution at New Cliftonthorpe is estimated to be closer to 30%. Crack and macropore flow pathways are probably instrumental in delivering sediment and P, mobilised at or near the surface, rapidly to the stream during events.
Over the course of a whole year the model predicts the timings of responses adequately (Walling et al., 2002). The magnitudes of predicted responses are also realistic although the absence of retardation in the landscape/stream results in spikey responses. The mechanisms of response represented warrant further discussion. Whilst the model considers only
losses of P derived from mobilised material, the model structure does not preclude these losses being routed through subsurface pathways. However, it does assume that all flow carrying measurable P concentration contributing to the stream must have originated as overland flow, even if it entered a sub-surface pathway a matter of metres downslope. It also assumes that the efficiency of removal of dissolved P from percolating water (e.g. through adsorption) is 100%. In terms of sources of loss, Walling et al. (2002) suggested that the contribution to sediment loss from fields located in the valleys close to the stream at Cliftonthorpe would be relatively high, partly due to greater incidence of saturated conditions. In terms of soil moisture status the model is unable to reproduce fully this greater likelihood for wetter conditions. This is because although surface runoff along a cascade of elements is depicted, lateral subsurface flow is not calculated and is, therefore, not a hydrological input to elements further downslope. As stressed earlier, it is clear from comparison with observed stream data that the model does not capture adequately the patterns of chronic loss occurring during wetter conditions in the winter.
Walling et al. (2002) have generated estimates of sediment delivery ratios for the two study catchments. Estimates for 1997–99 suggest that at New Cliftonthorpe only 14.2% of mobilised material was exported, whereas at Jubilee the figure is somewhat higher (26.7%). However, much of this mobilised material will have been retained within the field itself. Therefore, for comparability with the predictions from EUROSEM, Walling et al. suggest that of material estimated to be leaving individual fields, 22.5% was exported at New Cliftonthorpe whereas 49.2% was exported at Jubilee. The annual sediment loss predictions generated from EUROSEM may be reassessed in the light of these figures which give an estimate of a field-to-channel storage (landscape retention) coefficient for each site.
Consequently, given the adjustment factor, the model estimates 327 kg ha–1 sediment loss at Jubilee compared with
observed loss of 813 kg ha–1. At New Cliftonthorpe,
amended model output suggests a sediment loss of 542 kg ha–1 compared with an observed loss of
1224 kg ha–1. These adjusted figures can provide only a
rough guide to the extent of landscape retention of particulates during 1998–99. Data from the 1997–98 season, a dry year, particularly at New Cliftonthorpe, were used with 1998-99 data to define the sediment delivery ratios and may result in the derivation of lower delivery ratios than for more typical years.
It is not expected that the retention of sediment between field and channel would have had as big a control on catchment output P fluxes as it did for sediment fluxes. Phosphorus in solution will be largely unaffected. Particulate
P is bound predominantly to particles in the finer, more mobile fractions that are less likely to be retained.
FURTHER RECOMMENDATIONS
A number of issues arise from the modelling study. It is important that research findings from the two catchments are integrated fully, specifically in terms of improving representation of processes and predictive ability in the model. In this respect, it is important that model descriptions of the mechanisms and dynamics of sediment losses are improved and predictions verified more rigorously. Also, the P dynamics algorithm for the particulate phase invokes an enrichment ratio. Such predictions of P loss may be improved using a recently developed revised version of EUROSEM which models the sediment movement specifically within particle size classes. Hence, knowledge of the P content in these fractions of both mobilised and residual material will allow a greater understanding of the behaviour of soil P and more authoritative model predictions of TDP loss from agricultural fields.
Use of default parameter values driven by soil texture for the EUROSEM model in terms of soil cohesion and erodibility results in some uncertainty. Ongoing research is needed to address these difficulties, which are common in such process-oriented models (Brazier et al., 2001). As field management practice may have a major bearing on soil structural stability, it is important that improved techniques for estimation of these parameters are explored, for example by defining regression relationships between direct measurements and environmental, soil physical and management parameters across a range of soils. This would permit more authoritative and precise prediction routinely without recourse to extensive field measurement.
The desorption algorithms adopted for prediction of dissolved P involve a linear relationship with soil available P content. However, research has revealed marked increases in TDP loss above threshold soil P levels (e.g. Heckrath et
al., 1995). The position of this threshold and degree of this
non-linearity is dependent on soil textural (particle size) and chemical properties (phosphorus sorption capacity) (e.g. Hooda et al., 2000). A best-fit linear relationship may overestimate losses from soils of low P index and underestimate losses from soils of higher P content. It is important that the relationship between soil available P and P loss reflects accepted theories (e.g. based on adsorption isotherms).
Extensive information about manure and fertiliser additions is available. Currently, the model does not take account of the effect of these additions. When storm events follow soon after managed additions, P losses may be greater
in magnitude and more acute than at other times due to incomplete incorporation. It is likely that the relationship between soil P and TDP loss will be violated at these times, resulting in underestimation. The model requires further development to allow for short-term temporal variations in ‘effective’ soil available P to create an effective management tool and guard against underestimation of loss.
The formulation of the P transfer function in the model precludes P losses in the absence of soil losses. This is achieved by specifying an effective depth of interaction of runoff solely in terms of soil loss. However, there is some evidence (Sharpley, 1985) that more scientifically rigorous estimations can be made with some confidence from information on slope angle and rainfall intensity which would allow for desorption of P from soil in situ.
Conclusion
The model has been applied to two Midlands farm catchments which differ in their land use, soils and P status. These differences are reflected in overall sediment-flow ratios in stream water which are higher at Jubilee where land use is arable and hence bare soil is prevalent. Total P-sediment ratios in stream water are higher at Cliftonthorpe, reflecting the higher P status. In the scaling-up of results from field to ‘whole-farm’ estimates, the model is successful in reflecting the between-site differences in Total P-sediment ratios. Greater predicted sediment losses at Cliftonthorpe than Jubilee were a result of higher rainfall and the prevalence of sealed and damaged soils in some areas. In terms of further upscaling, model parameters used by the model are available either directly (e.g. soil texture) or in statistical form (e.g. P status from the Representative Soil Sampling Scheme (Skinner and Todd, 1998) and representative slope form) over large areas. The only component missing at this stage is explicit representation of landscape position and connectivity with respect to delivery of mobilised material to the stream channel. This gap in knowledge is a focus of recent and ongoing collaborative UK research (Heathwaite et al., 2001).
Acknowledgement
Funding of this work by the UK Department of Environment, Food and Rural Affairs (DEFRA) (project NT1027) is gratefully acknowledged.
References
Bailey, R.J. and Spackman, E., 1996. A model for estimating soil moisture changes as an aid to irrigation scheduling and crop water use studies: I. Operational details and description. Soil
Use Manage.,12, 122–129.
Beasley, D.B., Huggins, L.F. and Monke, E.J., 1982. Modelling sediment yields from agricultural watersheds. J. Soil Water
Conserv., 37, 113–117.
Beaulac, M.N. and Reckhow, K.M., 1982. An examination of land use-nutrient export relationships. Water Resour. Bull. 18, 1013– 1024.
Brazier, R.E., Rowan, J.S., Anthony, S.G. and Quinn, P.F., 2001. “MIRSED” towards an MIR approach to modelling hillslope soil erosion at the national scale. Catena, 42, 59–79.
Chambers, B.J., Garwood, T.W.D. and Unwin, R.J., 2000. Controlling soil water erosion and phosphorus losses from arable land in England and Wales. J. Environ. Qual., 29, 145–150. Chapman, A.S., Foster, I.D.L., Lees, J.A., Hodgkinson, R.A. and
Jackson, R.H., 2001. Particulate phosphorus transport by sub-surface drainage from agricultural land in the UK. Environmental significance at the catchment and national scale.
Sci. Total Environ., 266, 95–102.
Dils, R.M. and Heathwaite, A.L., 1997. Hydrological controls on phosphorus loss from agricultural systems. Proc. BHS Sixth
National Hydrology Symposium, Salford. British Hydrologicl
Society.
Everaert, W., 1991. Empirical relations for the sediment transport capacity of interrill flow. Earth Surf. Proc. Landf., 16, 513– 532.
Foster, G.R., 1989. Modelling soil erosion and sediment yield. In: Soil erosion research methods, R. Lal, (Ed.). Soil and Water Conservation Society, Ankeny, Iowa, USA, 97–117.
Foy, R.H. and Withers, P.J.A., 1995. The contribution of agricultural phosphorus to eutrophication. Fertiliser Society
Proceedings 365, 1–32.
Heathwaite, A.L., Burt, T.P. and Trudgill, S.T., 1989. Runoff, sediment and solute delivery in agricultural drainage basins: a scale dependent approach. IAHS Publication no. 182, 175–190. Heathwaite, A.L., Fraser, A.I., Lord, E.I., Withers, P.J.A., Hutchins, M.G., Johnes, P.J. and Butterfield, D., 2001. Towards a national consensus on indicators of phosphorus loss to water from agriculture. In: Connecting phosphorus transfer from
agriculture to impacts in surface waters, P. Haygarth, L.
Condron, P. Butler and J. Chisholm, (Eds.)., Proc. 2001 Inter.
Phosphorus Transfer Workshop, 28 Aug – 1 Sep 2001.
Heckrath, G., Brookes, P.C., Poulton, P.R. and Goulding, K.W.T., 1995. Phosphorus leaching from soils containing different phosphorus concentrations in the Broadbalk Experiment. J.
Environ. Qual., 24, 904–910.
HGCA, 1998. The Wheat Growth Guide to Improve Husbandry
Decisions. Home Grown Cereals Authority, London.
Hooda, P.S., Rendell, A.R., Edwards, A.C., Withers, P.J.A., Aitken, M.N. and Truesdale, V.W., 2000. Relating soil phosphorus indices to potential phosphorus release to water. J. Environ.
Qual., 29, 1166–1171.
House, W.A., Denison, F.H. and Armitage, P.D., 1995. Comparison of the uptake of inorganic phosphorus to a suspended and stream bed-sediment. Water Res., 29, 767–779.
Hutchins, M.G., Silgram, M., Davenport, I., Settle, J., Robinson, S., Simmonds, L. and Veck, N., 2000. The role of earth observation techniques in improving field-scale predictions of runoff, erosion and pollutant fluxes. In: Remote Sensing in
Agriculture. Proceedings of a Cirencester Symposium, June
2000. Aspects of Applied Biology, 60, 219–224.
Jarvie, H.P., Whitton, B.A. and Neal, C., 1998. Nitrogen and phosphorus in east coast British rivers: speciation, sources and biological significance. Sci. Total Environ., 210, 79–109. Johnes, P.J., Moss, B. and Phillips, G., 1996. The determination
of total nitrogen and phosphorus concentrations in freshwaters from land use, stock headage and population data: testing of a model for use in conservation and water quality management.
Freshwater Biol., 36, 451–473.
Johnson, A.H., Bouldin, D.R., Goyette, E.A. and Hedges, A.M., 1976. Phosphorus loss by stream transport from a rural watershed: quantities, processes and sources. J. Environ. Qual.,
5, 148–157.
Knisel, W.G., 1980. A Field Scale Model for Chemicals, Runoff
and Erosion from Agricultural Management Systems, Vol. 3,
USDA Conservation Research Report 26, US Government Printing Office, Washington DC.
Kronvang, B., 1992. The export of particulate matter, particulate phosphorus and dissolved phosphorus from two agricultural river basins: implications on estimating the non-point phosphorus load. Water Res., 26, 1347–1358.
McGuckin, S.O., Jordan, C. and Smith, R.V., 1999. Deriving phosphorus export coefficients for CORINE land cover types.
Water Sci. Technol., 39, 47–53.
MAFF, 1986. The Analysis of Agricultural Materials. Ministry of Agriculture, Fisheries and Food. Reference Book 427. HMSO London.
Morgan, R.P.C., Quinton, J.N., Smith, R.E., Govers, G., Poesen, J.W.A., Auerswald, K., Chisci, G., Torri, D. and Styczen, M.E., 1998a. The European Soil Erosion Model (EUROSEM): A dynamic approach for predicting sediment transport from fields and small catchments. Earth Surf. Proc. Landf. 23, 527–544. Morgan, R.P.C., Quinton, J.N., Smith, R.E., Govers, G., Poesen,
J.W.A., Auerswald, K., Chisci, G., Torri, D., Styczen, M.E. and Folly, A.J.V., 1998b. The European Soil Erosion Model (EUROSEM): documentation and user guide. Silsoe College, Cranfield University, UK.
Murphy, J. and Riley, J.P., 1962. A modified single solution method for the determination of phosphate in natural water. Analy. Chim.
Acta, 27, 31–36.
Muscutt, A.D. and Withers, P.J.A., 1996. The phosphorus content of rivers in England and Wales. Water Res., 30, 1258–1268. Nearing, M.A., Foster, G.R., Lane, L.J. and Finkner, S.C., 1989.
A process-based soil erosion model for USDA – Water Erosion Prediction Project Technology. Trans. ASAE, 32, 1587–1593. Proctor, M.E., Siddons, P.A., Jones, R.J.A., Bellamy, P.H. and
Keay, C.A., 1998. LANDIS – A Land Information System for the UK. In: Developments for planning the sustainable use of
land resources: Land Information Systems. European Soil Bureau Research Report, 4, 219–233.
Quinton, J.N., Catt, J.A. and Hess, T.M., 2001. The selective removal of phosphorus from soil: is event size important? J.
Environ. Qual., 30, 538–545.
Russell, M.A., Walling, D.E. and Hodgkinson, R.A., 2001. Suspended sediment sources in two small lowland agricultural catchments in the UK. J. Hydrol., 252, 1–24.
Ryden, J.C., Syers, J.K. and Harris, R.F., 1973. Phosphorus in runoff and streams. Adv. Agron., 25, 1–45.
Sharpley, A.N., 1983. Effect of soil properties on the kinetics of phosphorus desorption. Soil Sci. Soc. Amer. J., 47, 462–467. Sharpley, A.N., 1985. Depth of surface soil-runoff interaction as
affected by rainfall, soil slope and management. Soil Sci. Soc.
Amer. J., 49, 1010–1015.
Sharpley, A.N., Robinson, J.S. and Smith, S.J., 1995. Assessing environmental sustainability of agricultural systems by simulation of nitrogen and phosphorus loss in runoff. European
Sibbesen, E. and Sharpley, A.N., 1997. Setting and justifying upper critical limits for phosphorus in soils. In: Phosphorus Loss from
Soil to Water, H. Tunney, O.T. Carton, P.C. Brookes and A.E.
Johnston (Eds.), CAB International, Wallingford, UK. Silgram, M., Hutchins, M.G., Hodgkinson, R.A, and Lord, E.I.,
2001. Processes and pathways influencing phosphorus retention within a farm catchment. In: Connecting phosphorus transfer
from agriculture to impacts in surface waters, P. Haygarth, L.
Condron, P. Butler and J. Chisholm (Eds.). Proc. 2001 International Phosphorus Transfer Workshop, 28 Aug – 1 Sep 2001.
Simard, R.R., Beauchemin, S. and Haygarth, P.M., 2000. Potential for preferential pathways of phosphorus transport. J. Environ.
Qual., 29, 97–105.
Skinner, R.J. and Todd, A.D., 1998. Twenty five years of monitoring pH and nutrient status of soils in England and Wales.
Soil Use Manage., 14, 162–169.
Williams, J.R., Jones, C.A. and Dyke, P.T., 1990. The EPIC model. In: EPIC – Erosion/Productivity Impact Calculator. 1. Model
Documentation, A.N. Sharpley and J.R. Williams (Eds), USDA Tech Bull. 1768, 3–92.
Williams, R.J., Brooke, D.N., Clare, R.W., Matthiessen, P. and Mitchell, R.D.J., 1996. Rosemaund pesticide transport study 1987-1993. IH Report No. 129, Institute of Hydrology Wallingford UK, 68pp.
Walling, D.E., Russell, M.A., Hodgkinson, R.A. and Zhang, Y., 2002. Fine-grained sediment budgets for two small lowland agricultural catchments in the UK. Catena, 47, 323-353.