ORIGINAL ARTICLE
Investigating interocclusal perception in tactile teeth
sensibility using symmetric and asymmetric analysis
Norbert Enkling&Claudia Nicolay&Stefan Bayer&
Regina Mericske-Stern&Karl-Heinz Utz
Received: 18 February 2009 / Accepted: 24 September 2009 / Published online: 9 October 2009 # Springer-Verlag 2009
Abstract The purpose of this clinical trial was to determine the active tactile sensibility of natural teeth and to obtain a statistical analysis method fitting a psychometric function through the observed data points. On 68 complete dentu-lous test persons (34 males, 34 females, mean age 45.9± 16.1 years), one pair of healthy natural teeth each was tested: n=24 anterior teeth and n=44 posterior teeth. The computer-assisted, randomized measurement was done by having the subjects bite on thin copper foils of different thickness (5–200 µm) inserted between the teeth. The threshold of active tactile sensibility was defined by the 50% value of correct answers. Additionally, the gradient of the sensibility curve and the support area (90–10% value) as a description of the shape of the sensibility curve were calculated. For modeling the sensibility curve, symmetric and asymmetric functions were used. The mean sensibility threshold was 14.2±12.1 µm. The older the subject, the higher the tactile threshold (r=0.42, p=0.0006). The support area was 41.8±43.3 µm. The higher the 50% threshold, the smaller the gradient of the curve and the larger the support area. The curves showing the active tactile sensibility of
natural teeth demonstrate a tendency towards asymmetry, so that the active tactile sensibility of natural teeth can mathematically best be described by using the asymmetric Weibull function.
Keywords Active tactile sensibility . Interdental perception . Psychometric function . Support area . Gradient of the sensibility curve . Occlusal interferences
Introduction
High tactile sensibility of natural teeth has been known and described scientifically since the nineteenth century [24,25]. According to previous studies, natural teeth have an interocclusal perception sensibility, i.e., an active tactile sensibility, of 15–30 µm [22,33,34]. Active tactile sensibility means that blinded patients had to bite on small foreign bodies and decide whether or not they could detect them between their teeth. In the studies published so far, the tactile threshold has been defined in different ways (see Table1): 1. The thinnest foreign body that could be recognized at
least once [10,32]
2. The 50% threshold of correct answers [14,20,21,33,35] 3. The 80% threshold of correct answers [16]
The testing method mostly used in the past defines the tactile threshold as the level with 50% of correct, i.e., positive answers. This is the best reproducible threshold [33]. Assuming a symmetric S-shaped curve, this point, the 50% threshold, is the turning point of the tactile sensibility curve, i.e., the point of the curve with the maximum slope at which most of the change occurs. In previous studies, foils of different thickness were used and tested in ascending or descending sequences. Only the foils passing the 50%
N. Enkling (*)
:
R. Mericske-SternDepartment of Prosthodontics, University of Bern, Freiburgstrasse 7,
CH-3010 Bern, Switzerland
e-mail: [email protected] C. Nicolay
Institute for Medical Biometry, Informatics and Epidemiology, University of Bonn,
Bonn, Germany
S. Bayer
:
K.-H. UtzDepartment of Prosthodontics,
Preclinical Education and Dental Material Science, University of Bonn,
value were included in the evaluation, whereas the other values were not considered. Moreover, the scientific focus has so far been on the absolute thresholds, measured in micrometer, but in 1962 already, Tryde et al. stated in their basic publication:“It should be stressed that the S50 value
does not by any means contain all the information available from the measurement of a given person. A considerable amount of additional information is embodied in the sensibility curve, e.g., the slope of the curve tells something of how rapidly the subject’s sensibility decreases with decreasing thickness of the foils”. Hence, a type of analysis using all trials per test person and yielding estimates for both the 50% threshold and the slope would be more appropriate, more exact, and more informative.
Psychophysical measurements not only deal with sym-metric but also with asymsym-metric psychosym-metrical functions. An alternative method for describing tactile sensibility is the combination of the 50% threshold and the slope of the curve which is defined by the so-called support area, i.e., the width of the area between the 10% threshold and the 90% threshold, as it is suggested by psychophysics [3].
The purpose of the present study was to measure the active tactile sensibility of natural teeth using an
experi-mental set-up according to the psychophysical method of constant stimuli and a statistical analysis method fitting a psychometric function through the observed data points. A sophisticated testing method and mathematical model should contribute to obtaining better data sets with more details on the slope of the curve.
Materials and methods
Patients The sample included 68 volunteers (n=34 males and n=34 females, mean age 45.9±16.1 years, minimum 19 and maximum 86 years). Their teeth had to be healthy, CO2sensitive, and with periodontal probing depths of not
more than 3 mm. Altogether, 24 anterior, i.e., incisors, and 44 posterior (n=25 premolars, n=19 molars) pairs of healthy natural teeth were tested. The kind of tooth (incisor, premolar, or molar) that was to be tested was chosen by a random plan. Inclusion criteria for the tested pair of teeth were being healthy, without any restorative dental treatment, and showing the ability to occlude and hold repeatedly interocclusal a copper foil of 1 µm thickness without any artificial tooth build-up. During the
measure-Table 1 Active tactile sensibility thresholds: Results in the literature
Authors (year) Foil material
(temperature of the foil)
Tooth position N Mean±SD Median
50% thresholds
Tryde et al. (1962) [33] Silver Premolars/molars 10 20.0±11.3 µm (n=8) 15.5 µm
2 test persons with 50% value <10 µm
Utz (1986) [34] Copper Front teeth 72 35±34 µm 29 µm
Canines 66 108±101 µm 63 µm
Premolars 71 21±14 µm 17 µm
Molars 72 22±17 µm 17 µm
Jacobs and van Steenberghe (1991) [13] Steel Front teeth 12 17 µm
Jacobs, Schotte, and
van Steenberghe (1992) [12]
Alu (20°C) Front teeth 15 11.9±7.5 µm
Alu (35°C) Front teeth 15 15.5±8.3 µm
Steel (20°C) Front teeth 15 17.7±5.0 µm
Steel (35°C) Front teeth 15 23.3±7.4 µm
Tin (20°C) Front teeth 15 19.5±7.9 µm
Tin (35°C) Front teeth 15 25.4±7.9 µm
Jang and Kim (2001) [15] ? Front tooth 1 10 11.7±6.3 µm
Front tooth 2 10 14.3±7.6 µm Canine 10 15.9±6.8 µm Premolar 1 10 15.1±5.2 µm Premolar 2 10 16.1±4.6 µm Molar 1 10 18.7±5.3 µm Molar 2 10 22.8±8.9 µm 80% thresholds
ments, the subjects were seated in the chair in an upright and comfortable position with eyes closed. Through ear-phones, connected to an intermediate mixing console, “white” noise mixed with “pink” noise was transmitted from a cassette tape recorder to the subjects’ ears at a fairly high sound volume. The instructions for the test movements were given through a microphone [6,34,35].
Active tactile threshold
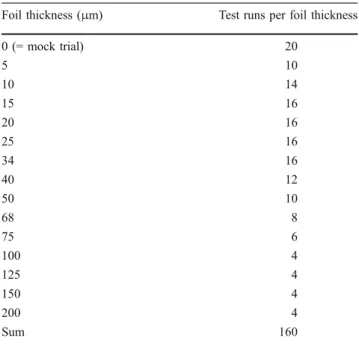
The tactile tests were made in the incisor region in incisal-edge-to-incisal-edge position (edge-to-edge bite). In the posterior region, premolars and molars were tested in maximum intercuspation of the mandible. The foreign bodies placed between the teeth consisted of copper foils that were about 3 mm wide and differed in thickness (5–200 μm). The foil thickness, which was expected to be close to the threshold of interocclusal tactile perception according to the relevant literature, was tested by more frequent repetition. The foil thickness and the number of times the respective foil was offered to the test person is shown in Table2.
The sequence of the foil thickness was randomized for the 160 test runs of each subject with 20 mock trials being integrated in the course of testing. After every test, the subject indicated whether or not he/she had felt the foil by pressing the key of a computer mouse. The left mouse key was pressed for“yes”, the right one for “no”. This input was stored directly, classified by foil thickness, in the computer using the Medstats® computer software (University of Bonn). The mock trials were a check for the examiner to see if the test persons were performing the tests with proper concentration: Criteria for exclusion of subjects from the
study were when more than 50% false-positive values were determined for the mock trials and when it was determined during the examination that the subject was unmotivated or not concentrating and simply providing “yes” and “no” answers, but regarding these criteria, no test subject had to be excluded.
Statistical analyses
All test results recorded excepting the mock trials were included in the evaluation and analyzed by logistic regression based on the assumption that the course of the curve would follow a symmetric model. However, to find the best fitting mathematical model for the active sensibility curve, symmetric as well as asymmetric mathematical func-tions were used: logistic regression, i.e., logit, the half logistic model, the m1-model of Prentice, the a1h-model of
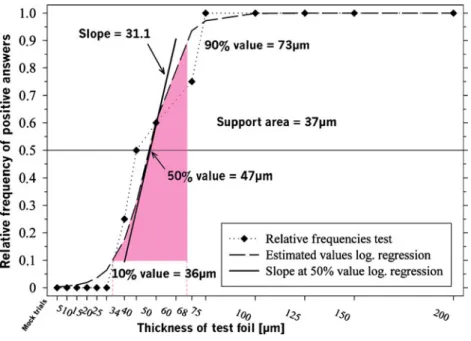
Stukel, Box–Cox transformations, i.e., logit-link, the Weibull function, i.e., the c-log-log transformation. The presented thresholds are estimated by modeling the sensitivity curves with mathematical functions: this means that due to the mathematical estimation, sometimes the estimated and the measured thresholds are not exactly matching. For example, in Fig.1, test subject A is shown: The dotted curve means the measured values, and the dashed curve demonstrates the estimated values by the logistic regression. In this example, the 10% thresholds were matching, but the estimated 50% threshold was higher, and the estimated 90% threshold was lower than the measured.
Absolute values in micrometer for the tactile sensibility threshold as well as values for the slope of the curve at the tactile sensibility threshold and the support areas were determined.
Fig. 1 Test subject A with the modeled curve (log.regression) with the slope of the curve at the 50% threshold, the 10%, 50%, and 90% thresholds, and the support area
In addition, the influence of the following variables on tactile sensibility was evaluated in a descriptive manner: age and gender of the subjects, tooth position, and type of the dynamic eccentric occlusion.
First, all test results recorded for each subject were analyzed separately, then the results were combined. The SAS statistics software was used for the calculations which yielded not only a value for the 50% point, i.e., the definition of the threshold, but also for the slope related to it. Besides the slope that was calculated at the 50% threshold also the support
area (90–10% threshold) was estimated to describe the course of the curve (see Fig.1) [17, 18]. The descriptive statistical analyses were tested withα=0.05.
Results
The absolute thresholds of tactile sensibility by logistic regression were found to be between 2 and 77 µm. The mean threshold was 17.5±12.0 µm, and the median was 14.3 µm.
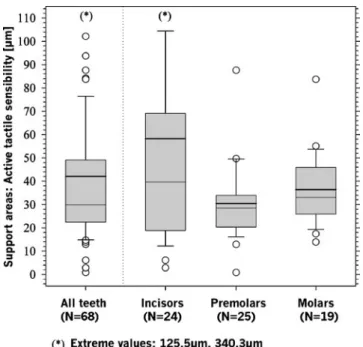
Among all variables studied, only the subject’s age had a significant influence on tactile sensibility. The older the subject, the higher the tactile threshold: 11 µm for the 20-year-old and 21 µm for the 70-20-year-old subjects (parameter “age” normally distributed (QQ-plot), r=0.42, p=0.0006). On an average, the 50% thresholds increased by about 2.2 µm for every 10 years of age. No gender-dependence and no difference between front teeth and posterior teeth were found in the test. The results with box plots of the 160 tests made with each subject for all 68 pairs of teeth are shown in Fig.2.
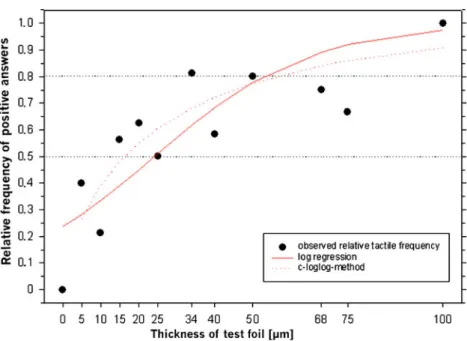
The evaluation of all test subjects in connection with simulation studies demonstrated that modeling with the asymmetric Weibull function, i.e., the c-log-log transfor-mation, best described the values obtained (see Fig.3). The c-log-log analysis at the 50% threshold led to an average tactile sensibility of 14.2±12.1 µm, with a median of 11.1 µm, which is slightly less than the calculation with the logistic regression (see Table3).
The gradients of the sensibility curves at the 50% threshold were derived from the psychometric functions.
Table 2 Foil thickness and number of times the respective foil was offered to the test-person
Foil thickness (μm) Test runs per foil thickness
0 (= mock trial) 20 5 10 10 14 15 16 20 16 25 16 34 16 40 12 50 10 68 8 75 6 100 4 125 4 150 4 200 4 Sum 160
Fig. 2 Boxplots of the relative frequencies of correct answers
(all 160 test runs of allN=68
Estimated with the logistic regression, the gradients were 0.046±0.060 and decreased with increasing 50% thresh-olds, so that a negative dependence may be assumed.
The gradient of the curves, determined by the c-log-log function, demonstrates a positive correlation with the foil thickness because of logarithmizing the values. The support area estimated with the c-log-log transformation was 41.8± 43.3 µm with a median of 31.3 µm (see Table4and Figs.4
and 5). A positive correlation between the level of the threshold and the size of the support area was observed.
Discussion
Foreign bodies between the teeth cannot only be perceived but also heard by bone conduction when the teeth occlude. Therefore, subjects were exposed to special noises through earphones [34, 35]. This measure could have limited the subjects’ interocclusal perception. In the final interviews, the subjects confirmed that they did not hear their biting on the foils. Chewing pressure and dynamics of tactile move-ments, however, could not be standardized.
The test strips were manufactured from high-precision copper foils that adapt to the occlusal relief due to their high ductility. This ensured that the intended interocclusal clearance could be achieved during testing with high precision. However, possible thermal sensations cannot be
excluded due to the thermal conductivity of the copper material. This could have distorted the absolute values measured [12]. The measurements were conducted in a room with a constant temperature of approximately 25°C; therefore, it is assumed that thermal reactions were only minor.
The duration of the test measurements was about 2 h, and a learning effect, but also a decline in concentration of the subjects due to fatigue, was observed. As there was a tiring effect in the study, the number of test runs per test person was limited to 160. To achieve as much as possible information within the 160 test runs, the test foils, which according to the relevant literature were expected to be the closest to the 50% threshold, were tested more frequently than the thicker foils, which were expected to be detected by the test persons by 100%. The results of the present study confirmed our expectations: almost all foils thicker than 75 µm were detected by the test persons by 100%. The experimental set-up with decreasing foil thickness, often used in the past, leads to a learning curve and thus to better results for thinner foils [19]. In the present study, these effects on the 50% thresholds were compensated by randomizing the foil thickness. The study design complies with the requirements for psychometric trials with the method of constant stimuli [7,14].
Tactile sensibility of natural teeth, defined by the 50% threshold based on logistic regression and on the c-log-log
Fig. 3 Test subject B with the modeled curves by Weibull function (c-log-log) and by logistic regression through the observed data points
Mean SD 95% CI Median
C-Log-Log (Weibull function) 14.2 12.1 (11.3; 17.0) 11.1
Log.Regression 17.5 12.0 (14.4; 20.9) 14.3
Log.Reg-C-Log-Log 3.3 2.3 (2.4; 3.5) 3.2
Table 3 Results of the 50% thresholds micrometer calculated by logistic regression and by the Weibull function
function, lies at a median of 14.3 and 11.1 µm, respectively. In the present study, tactile perception is similar for all teeth and seems only to be influenced by the person’s age: At the age of 70, tactile sensibility is 21 µm which, compared to the sensibility of 11 µm at the age of 20, is about half the value. These results are in accordance with the findings of other authors, who found a negative correlation of age and active tactile sensibility [8,28], but there are also statements in the literature according to which there is no dependence [1,4,26,34] or even a positive correlation [23]. As we were dealing with psycho-physical-assessment-methods, it is not surprising that the sensibility decreases with aging because people growing older show a reduced ability to respond [9,11,29,31], but the estimated 50% threshold for the 70-year-old with 21 µm is still very low. The difference of 11 to 21 µm is of statistical but not of clinical relevance.
Similar results for female and male test subjects as found in the present study were also reported by other authors [4,5,26,34]. There is only a minor gender influence [27], and better results for men than for women were only reported in a paper with a suboptimal study set-up [2].
The results of Utz [34] showing an influence of the type of eccentric occlusion on the level of active tactile sensibility could not be confirmed in the present study. The results for anterior and posterior teeth were similar, although a few studies reported some differences [22].
The curves relating to tactile sensibility did not follow a symmetric model, as originally assumed [33], but take an asymmetric course. The best fitting mathematical model is the c-log-log function, i.e., the Weibull function. The differ-ences between the 50% threshold determined by logistic regression and determined by the c-log-log function are of no clinical relevance, because there was only a mean deviation of 3.3 µm, whereby the c-log-log model yielded the lower value. The present results with a mean threshold of 14.2±12.1 µm (Weibull function) indicate an interocclusal perception of high tactile sensibility. The 50% thresholds estimated by the symmetric logistic regression and by the asymmetric c-log-log function are comparable, but there are clear differences with regard to the information obtained on the slope of the tactile sensibility curves. With logistic regression, there exists a negative dependence between tactile sensibility and the
Mean SD 95% CI Minimum Median Maximum
50% threshold 14.2 12.1 (11.3; 17.0) 0.5 11.1 68.2
10% threshold 4.0 5.8 (2.7; 5.3) 0.004 2.3 30.4
90% threshold 45.8 43.9 (35.4; 56.8) 5.0 33.6 340.5
Support area 41.8 43.3 (31.5; 52.3) 0.8 31.3 340.3
Table 4 Results of the active tactile sensibility micrometer calculated by the Weibull
function (n=68)
Fig. 4 Boxplots of the 50% thresholds calculated with the Weibull function
Fig. 5 Boxplots of the support areas calculated with the Weibull function
slope of the curve. A positive correlation between foil thickness and gradient can be demonstrated if the slope is calculated by the c-log-log function. This difference com-pared to the graph of the logistic regression is due to logarithmizing the foil thickness when using the c-log-log function. So, the slope of the psychometric function at a given point describes how fast or slowly perception changes with increasing or decreasing test foil thickness. Slope values are not always comparable due to different models [30].
For the evaluation of the slope, therefore, logistic regression may be recommendable, as the 50% thresholds and the related slope can also be identified in every individual linear tactile sensibility curve. Thus, the calculated results are apparently more informative. An alternative method for describing tactile sensibility by the combination of the 50% threshold and the slope of the curve could be to describe it by the combination of the 50% threshold and the support area. This would help solve the problem caused by the limited comparability of the values of the slope of the curve and therefore with this analyzing method the Weibull function should be preferred.
Dependence of the tactile sensibility threshold on the slope of the tactile sensibility curve
In a test subject with a flat slope, i.e., low value of the slope and a large support area, the 50% threshold represents a point along a slowly rising curve, whereas in a test subject with a steep slope, i.e., high value of the slope and a small support area, the 50% threshold is more of a true threshold. Thus, the slope of the curve is a yardstick for the reliability of the subject’s decision: “yes, I’ve felt something”, or “no, I didn’t feel anything”. If the 50% thresholds were very small, the slopes had to be very steep because the range of values measured only started at zero, but then, flatter slopes at the higher 50% thresholds, as determined in our study, would mean that the subjects’ uncertainty about their tactile perception increased with increasing 50% thresholds. On the other hand, it would also be conceivable that the subjects with higher tactile sensibility thresholds hesitated to give an affirmative answer until they were quite sure to feel a foreign body between their teeth. In that case, also a steep slope, i.e., a pronounced threshold at higher tactile sensibility results, could be explained. This situation was also found in a few subjects in our study. When including the slope of the curve in the evaluation, conclusions may possibly be drawn as to the subject’s character, i.e., whether the subject is willing to take a risk or rather wants to be on the safe side, and the result [in micrometer] can be qualified accordingly.
According to the mathematical evaluations of the results of the study, the best way of describing the active sensibility of natural teeth is the combination of the threshold calculated by
the 50% threshold of the asymmetric c-log-log function and the support area, 90% threshold minus 10% threshold, estimated by the same function. A small support area means a steep slope and, vice versa, a bigger support area a flatter slope.
Clinical relevance of the results of the study
This study with the approach to analyzing the data of active sensibility trials by estimating the sensibility curves demon-strates that the average active sensibility of natural teeth is highly appointed, i.e., the mean 50% threshold is very low and even better than some other authors previously stated. The additional calculation of the support area gives a hint as to the course of the slope and whether the 50% value is more like a real threshold or not. The individual support areas for the same 50% values vary inter-individually and should be calculated as an important additional patient characteristic in further clinical studies about the topic of active sensibility of natural teeth or implants.
It is indisputable, however, that the interocclusal tactile perception allows to make a statement on the degree to which teeth and dental restorations may be equilibrated occlusally until premature contacts are no longer felt by the patient. According to the present clinical trial, this equilibra-tion requires a precision of clearly below 100 µm.
References
1. Aaserud O, Juntunen J, Matikainen E (1990) Vibration sensitivity thresholds: methodological considerations. Acta Neurol Scand
82:277–283
2. Adler P (1947) Sensibility of teeth to loads applied in different directions. J Dent Res 26:279
3. Alcala-Quintana R, Garcia-Perez MA (2004) The role of parametric assumptions in adaptive Bayesian estimation. Psychol
Methods 9:250–271
4. Bou Serhal C, Jacobs R, van Steenberghe D (1998) Stereognostic ability of teeth and implants: a comparison between various prosthetic superstructures. In: Jacobs R (ed) Osseoperception. Catholic University Leuven, Department of Periodontology,
Leuven, pp 199–220
5. Brill N, Tryde G, Morgan G, Rees DA (1974) Age changes in the two-point discrimination threshold in skin innervated by the trigeminal nerve. J Oral Rehabil 1:149
6. Enkling N, Nicolay C, Utz KH, Johren P, Wahl G, Mericske-Stern R (2007) Tactile sensibility of single-tooth implants and natural
teeth. Clin Oral Implants Res 18:231–236
7. Falmagne JC (2002) Elements of psychopysical theory. Oxford Clarendson Press, Oxford
8. Gerr F, Letz R (1993) Vibrotactile threshold testing in occupa-tional health: a review of current issues and limitations. Environ
Res 60:145–159
9. Gescheider GA, Bolanowski SJ, Hall KL, Hoffman KE, Verrillo RT (1994) The effects of aging on information-processing channels in the sense of touch: I. Absolute sensitivity. Somatosens
10. Hollstein W (1933) Untersuchung über das
“Dickenunterschei-dungsvermögen” bei natürlichen Zähnen und insbesondere bei
festsitzendem und herausnehmbarem abgestützen Ersatz. Dtsch
Mschr Zahnheilk 51:385–403
11. Humes LE, Busey TA, Craig JC, Kewley-Port D (2009) The effects of age on sensory thresholds and temporal gap detection in hearing, vision, and touch. Atten Percept Psychophys 71:860–871 12. Jacobs R, Schotte A, van Steenberghe D (1992) Influence of temperature and foil hardness on interocclusal tactile threshold. J
Periodontal Res 27:581–587
13. Jacobs R, van Steenberghe D (1991) Comparative evaluation of the oral tactile function by means of teeth or implant-supported
prostheses. Clin Oral Implants Res 2:75–80
14. Jacobs R, van Steenberghe D (1994) Role of periodontal ligament receptors in the tactile function of teeth: a review. J Periodontal
Res 29:153–167
15. Jang KS, Kim YS (2001) Comparison of oral sensory function in complete denture and implant-supported prosthesis wearers. J Oral
Rehabil 28:220–225
16. Karlsson S, Molin M (1995) Effects of gold and boded ceramics inlays on the ability to perceive occlusal thickness. J Oral Rehabil 22:9–13
17. Klein SA (2001) Measuring, estimating, and understanding the psychometric function: a commentary. Percept Psychophys 63:1421–1455
18. Kuss O, Borgermann J (2005) Prognoses from the logistic EuroSCORE are statistical estimates that require confidence
intervals. Eur J Cardiothorac Surg 27:1129–1132
19. Mericske-Stern R (1998) Oral tactile function in relation to other functions after rehabilitation with implant supported prostheses. In: Jacobs R (ed) Osseoperception. Catholic University Leuven,
Department of Periodontology, Leuven, pp 169–185
20. Mericske-Stern R, Assal P, Mericske E, Bürgin W (1995) Occlusal force and oral tactile sensibility measured in partially edentulous
patients with ITI implants. Int J Oral Maxillofac Implants 10:345–354
21. Mericske-Stern R, Hofmann J, Wedig A, Geering AH (1993) In Vivo Measurements of maximal occlusal force and minimal pressure threshold on overdentures supported by iplants or natural roots: a comparative study, part 1. Int J Oral Maxillofac Implants 8:641–649
22. Meyer E, Eichner K (1987) Untersuchung zur Tastempfindlichkeit menschicher Front- und Seitenzähne unter Berücksichtigung
verschiedener Arten von Zahnersatz. Dtsch Zahnärztl Z 42:358–
361
23. Öwall B (1974) Oral tactility during chewing. Odontol Revy 25:135
24. Peaslee ER (1857) Human histology in its relations to descriptive anatomy, physiology and pathology. Blanchard and Lea, Philadelphia
25. Sigmund (1867) Die Empfindung der Zähne. Dtsch Vierteljahresschr f ZHK
26. Siirilä HS, Laine P (1972) Sensory thresholds in discriminating differences in thickness between the teeth, by different degrees of mouth opening. Proc Finn Dent Soc 68:134
27. Siirliä H, Laine P (1967) The relation of periodontal sensory appreciation to oral stereognosis and oral motor ability. Suomi
Hammaslaak Toim 63:207–211
28. Skramlik Ev (1950) Die sinnlichen Erlebnisse nach Entfernung bzw. nach Ersatz von Zähnen. Dtsch Zahn- Mund- Kieferheilkd 13:37
29. Stevens JC, Cruz LA, Marks LE, Lakatos S (1998) A multimodal assessment of sensory thresholds in aging. J Geront, Ser B Psychol Sci Soc Sci 53:263–272
30. Strasburger H (2001) Converting between measures of slope of the psychometric function. Percept Psychophys 63:1348–1355 31. Stuart M, Turman AB, Shaw J, Walsh N, Nguyen V (2003)
Effects of aging on vibration detection thresholds at various body regions. BMC Geriatr 3:1
32. Theil E (1931) Bis zu welchem Grad kann die Tastfähigkeit der menschlichen Zahnreihenglieder festgestellt werden? Dtsch Mschr
Zahnheilk 49:270–278
33. Tryde G, Frydenberg O, Brill N (1962) An assessment of the tactile sensibility in human teeth, an evaluation of a quantitative
method. Acta Odontol Scand 20:233–256
34. Utz K-H (1982) Die taktile Feinsensibilität natürlicher Zähne Eine klinisch-experimentelle Untersuchung. Dissertation Universität Bonn
35. Utz K-H (1986) Untersuchung über die interokklusale taktile Feinsensibilität natürlicher Zähne mit Hilfe von Kupferfolien. Dtsch Zahnärztl Z 41:1097–1100