HAL Id: hal-02629776
https://hal.archives-ouvertes.fr/hal-02629776v2
Submitted on 2 Feb 2014HAL is a multi-disciplinary open access archive for the deposit and dissemination of sci-entific research documents, whether they are pub-lished or not. The documents may come from teaching and research institutions in France or abroad, or from public or private research centers.
L’archive ouverte pluridisciplinaire HAL, est destinée au dépôt et à la diffusion de documents scientifiques de niveau recherche, publiés ou non, émanant des établissements d’enseignement et de recherche français ou étrangers, des laboratoires publics ou privés.
Statistical exploratory analysis of agent-based
simulations in a social context
Nathalie Villa-Vialaneix, Christophe Sibertin-Blanc, Pascal Roggero
To cite this version:
Nathalie Villa-Vialaneix, Christophe Sibertin-Blanc, Pascal Roggero. Statistical exploratory analysis of agent-based simulations in a social context. Case Studies in Business, Industry and Government Statistics, Société Française de Statistique, 2014, 5 (2), pp.132-149. �hal-02629776v2�
CS-BIGS xx(xx): xx-xx http://www.bentley.edu/csbigs/documents/xxx © 20xx CS-BIGS
Statistical exploratory analysis of agent-based simulations
in a social context
Nathalie Villa-Vialaneix
Université de Perpignan Via Domitia, IUT (Dpt STID), 52 av. Paul Alduy, 66860 Perpignan, France SAMM, EA4543, Université Paris 1, 90 boulevard de Tolbiac, 75634 Paris, France
Christophe Sibertin-Blanc
IRIT, Université de Toulouse, 2 rue du doyen G. Marty, 31042 Toulouse, France Pascal Roggero
LEREPS, Université de Toulouse, 2 rue du doyen G. Marty, 31042 Toulouse, France
This paper presents a case study for motivating the use of data mining in a social agent-based simulation framework. The data used in this article come from the social simulation platform SocLab. They were generated from a model designed to analyze a real situation related to the management of a river in South West of France. Several standard statistics methods are used to analyze the possible outcomes of the discussion between the actors. Finally, a typology of these outcomes is obtained with self-organizing map.
Keywords: Agent-based modeling, self-organizing maps, typology, social simulation, organizational behavior, SocLab.
1. Introduction
Agent-based models and the sociology of organized action
Agent-based modeling (ABM) consists in describing the behavior of the active entities of a system of interest (the “agents”) and how they interact within their shared environment. Thus, the way the model functions is the consequence of the interactions between the agents and of their behaviors. As long as the phenomena observed in the system are well reproduced in the outputs of the simulation model, the model provides a
possible realistic explanation for the occurrence of these phenomena (AXELROD, 1997). This approach is especially fruitful for studying complex systems that can not be tackled by analytical approaches without a distorting over-simplification. It is increasingly used for the simulation of social systems (see, for example, the Journal of Artificial Societies and Social Simulation1).
The present paper describes the analyses of simulations produced by an agent-based social
simulation platform called SocLab2. SocLab has been designed for analyzing social organizations, or more generally systems of organized action, where people regularly interact for a given purpose in a given context. SocLab is based on a well established sociological theory of organizations, the “sociology of organized action” (SOA), introduced by (CROZIER 1964) and (CROZIER and FRIEDBERG 1977). Roughly speaking, SOA analyzes social organizations in order to explain why people behave as they do, especially when they do not behave as they are supposed to, regarding the organization's rules. An organization is defined as a set of actors and a set of resources. Each actor has some goals, which are a mix of his own objectives and his organizational roles, and he needs some resources to reach these goals. On the other hand, each actor controls the access to some resources, and so determines to what extent those needing these resources have the means to achieve their goals. Actors are assumed to be rational, that is to say their behavior is driven by their beliefs on the best way to achieve their goals. So, each actor manages the resources he controls and cooperates with others in order to obtain, from them, access to the resources he himself needs. The actors are reciprocally dependent on each other and we call social actor game the process by which they mutually adjust their behaviors with respect to others.
Most organizations feature the well-known regulation phenomenon: according to it, the adjustment process regularizes an organization so that its actors are found to exhibit quite steady behaviors. The agent-based modeling and simulation of an organization are expected to shed light about its possible regulations.
The SocLab analysis of organizations
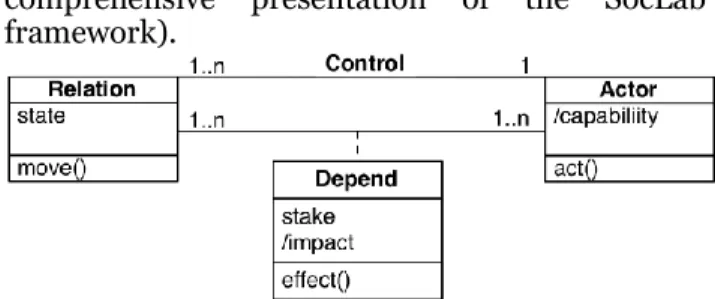
This section describes more precisely the structure of a SocLab model of given organization (see (SIBERTIN-BLANC et al. 2013a) for a comprehensive presentation of the SocLab framework).
Figure 1. Model of organizations according to
the SocLab platform
2http://soclabproject.wordpress.com/using-soclab
The first step is made by the sociologist: using surveys and fieldwork, the sociologist analyses the organization and observes the behavior of the actors and how much each one cooperates. Then, through an intuitive user interface, the SocLab platform allows him to edit his model, which describes the structure of the organization. This step is highly dependant of expert knowledge and is very important to obtain a model that represents well the reality. For designing a model in SocLab, the following elements have to be defined (see also Figure 1):
the list of the actors;
the list of the resources: each resource is controlled (or managed) by an actor. This actor behaves in a more or less cooperative way and the state of a resource measures (on a scale of -10 to 10) how much he tends (or does not tend) to cooperate with others by favoring (or hindering) the access to the resource;
the stake of every actor on every resource: this quantity measures the importance of a given resource for a given actor. The more a resource is needed to achieve an actor's important goal, the higher the corresponding stake (on a scale of zero to ten; the sum of the stakes for every actor sums to ten);
the effect function of every resource on every actor having a not null stake on this resource: this function quantifies how well the actor can use the resource to reach his goals, depending on the state of the resource;
the solidarities of every actor towards each of the others.
A configuration (or state) of the organization is defined as the vector of the resource states. Thus, a configuration is characterized by the level of cooperation of each actor with regard to the others. In any configuration of the organization, every actor gets from others some capacity to mobilize the resources needed to achieve his objectives. This satisfaction of an actor a when the organization is in a configuration s = (sr)r R is
calculated as the sum of the values of the effect functions, weighted by the actor’s stake:
satisfaction(a, s) = r R stake(a, r) * effectr(a, sr) (1)
SocLab provides some tools for the analytical investigation of (the model of) an organization. For instance, it computes many indicators about structural or state-dependent properties of the organization. It also allows the user to
interactively explore the space of the organization’s configurations and to compare the resulting satisfactions for the actors, e.g., the configurations which optimize or minimize the satisfaction of a given actor or the Nash equilibria (CHAPRON 2012).
The SocLab platform includes a simulation engine which implements the regulation process within an organization and so computes which behavior each actor is likely to adopt (EL GEMAYEL et al., 2011). To this end, a multi-agents implementation of the model of an organization provides the actors with a rationality for playing the social actor game. Social actors try, as a meta-goal, to get a high level of satisfaction, i.e., to have the means needed to achieve their concrete goals. However, according to the bounded rationality assumption (SIMON, 1955) they just look for a “satisficing” level of satisfaction, not an illusory optimal one. So, within a trial-error reinforcement learning process (SUTTON and BARTO, 1998), each actor maintains a dynamic level of aspiration, and a simulation terminates when a stationary state is reached because every actor has a satisfaction that is over his level of aspiration. In such a state, the actors' behaviors are such that each one accepts his level of satisfaction and the ones of others: the organization can work in this way, a regulated configuration has been found. The length of a simulation, i.e. the number of steps necessary to reach a stationary state, indicates how much it is difficult for the actors to jointly find how to cooperate. Full explanations about this algorithm are given in (SIBERTIN-BLANC et al. 2013b) and (EL GEMAYEL, 2013).
This simulation algorithm is partly stochastic, so that each simulation constitutes an experiment, whose outputs provide values for the state of each resource and the satisfaction gained by each actor. The designer of the model of an organization expects that a number of the simulation experiments correspond to the observed state of the organization. If this is not the case, the model of the organization is to be revised, except if the sociologist is able to explain this anomaly by peculiar causes. However, the SOA is fully compliant with the fact that the simulation includes experiments that are quite far from the observed state of the real organization: they correspond to “potentialities”, possible ways of operating of the organization, to configurations which have not been observed yet but which might be observed in the future. A tight matching between all simulation experiments and the observed state of the organization will be interpreted by the sociologist as a structural
property of the organization: this results from a strongly regulated organization in which the actors have a limited freedom to depart from a normative behavior. Thus, as long as the model of the organization under study is not strongly regulated, SocLab should provide a large number of experiments which correspond to different possible futures. The identification of different operating scenarios can give a simplified overview of the internal possibilities of the organization and it can also help decipher the balance of power and the intrinsic structure of the organization.
In the present article, such an approach is illustrated on a real-world case study related to water management in a French area. Section 2 describes the case study and the variables provided in the companion dataset. Section 3 describes the statistical analysis of the simulations, focusing on statistical methods that provide a simplified and visual representation of the dataset. In particular, self-organizing maps are used to extract the main regulated configurations of the organization that may be envisioned. The results are commented in regards with the underlying sociological context. A discussion and a conclusion are finally provided in Section 4.
2. The source of data Context
This dataset contains the outputs of 100 simulations generated by the SocLab model of an organized action system concerning the management of a river called Touch. Touch is a tributary of the Garonne in which it flows downstream of Toulouse, an agglomeration of one million inhabitants in the South West of France. Its catchment area covers 60 municipalities and its course crosses 29 municipalities. Three fourth of these municipalities stand upstream and are mainly agricultural villages or small towns. Unlike upstream area, the one fourth municipalities located downstream form a dense urban area of the Toulouse agglomeration. Downstream municipalities have had to deal with several episodes of flooding during the past decades. They consider that upstream municipalities do not cooperate enough and they have tried to protect themselves by building dikes that, even if expensive, are not sufficient to eliminate the flooding risk. On the contrary, upstream municipalities, strongly influenced by the farmers, consider that they have taken responsibility for preventing flooding by letting some land lying
uncultivated, in order to absorb the excess of water in case of flooding.
Since 1995, the French water policy requires the elaboration of a flood risk prevention plan (FRPP) of each river, and this obligation was reinforced by the European Water Framework Directive (WFD 2000/60/EC), transposed into the French law as the Law on Water and Aquatic Ecosystems (LEMA, Law of 30 December 2006). On the occasion of the establishment of the PRPP of the Touch, B. BALDET (2012) studied the difficulties to reach a agreement that combines the views of all the field stakeholders and of administrative authorities. He analyses the field observations to the light of several sociological theories. The SocLab model, whose simulation results are reported in this paper, describes the system of organized action devoted to the elaboration of the Touch's FRPP and has been designed in order to formally confirm (or infirm) the empirical findings. We just introduce the actors and the resources of the system and outline the issues at hand. The interested reader will find at the site (SIBERTIN-BLANC et al. 2013c) a detailed presentation of the case, including the empirical and theoretical dimensions, the SocLab model itself and the dataset of the simulation results.
Actors
The action system includes 10 actors which are involved in the management of the river and somehow depend on the FRPP:
actor 1: Departmental Territory Direction (DDT) acts as the State representative and will instruct the new FRPP;
actor 2: National Office for Water and Aquatic Ecosystem (ONEMA) is the reference agency for the monitoring of water and aquatic environment;
actor 3: Adour-Garonne Water Agency (AEAG) is the operational authority in charge of strategic plans at the basin level. Accounting for the requirements of the various water uses and of the protection of aquatic ecosystems, it defines, supervises and funds the water policy;
actor 4 is a citizen organization of riparian farmers in the upstream area. They own floodplain land and, as they are riparian, they have the right to use the river and must maintain the banks;
actor 5 is the group of 25 upstream municipalities that have 21,000 inhabitants;
actor 6 is the group of downstream municipalities (75,000 inhabitants) that are incriminated at each occurrence of a natural catastrophe. Due to flooding threats, they must prohibit any building on a portion of their territory;
actor 7 is the inter-communal association for water civil engineering (SIAH)3, in charge of the management of Touch. Especially, it has to maintain the river bed and banks. It includes representatives of the 29 riparian municipalities and its active manager favors the cooperation among municipalities while worrying about the Good Ecological Status of the river;
actors 8 and 9 are political authorities, the regional and departmental councils, respectively. They can bring additional financial support to civil engineering measures;
actor 10 is an engineering consulting firm, specialized in water, energy and environment, in charge of technical studies.
The actors which are the most engaged in the negotiation, are actors 6, 4 and 5 from the population point of view, and actors 7, 3 and 9 from the institutional point of view. All these actors are strongly concerned by both the elaboration and the further implementation of the FRPP. Actors 1, 2, 8 and 10 are less concerned.
Resources
In this model, each actor controls one resource that summarizes its means to influence the discussion.
“Validation” (between -10 and 10) is the more or less harsh regard of actor 1 on the prevention plan proposed by actor 7. This validation is made on the basis of technical and ecological criteria;
“Expertise” (between -8 and 8) is the outcome of a study of which actor 2 is in charge. Actor 2 can give a positive or a negative appraisal on the construction work, based mostly on ecological criteria;
“Funding” (between -8 and 8) is a funding coming from actor 3 which can pay for up to
3 Literally “Syndicat Intercommunal d’Aménagement
Hydraulique” of Touch, committed by the State to maintain the river for the sake of the riparian people. Riparian people owns the river until the middle of its bed. This association is funded by the Water Agency (actor 3). See http://www.siah-du-touch.org.
75% of the total cost of a construction work if the project is considered as ecological;
“Lobbying” (between -10 and 10) is an action controlled by actor 4 which owns the floodplain lands. As this actor is not much concerned by ecological issues, it is frequently arguing against actors 2 and 3;
“Control of flow” (between -8 and 8) is the capability of upstream villages (actor 5) to keep in their territory a part of the water that provokes flooding episodes downstream;
“Self funding” (between -8 and 8) is the capacity of downstream villages (actor 6) to fund the civil engineering works;
“River management” (between -8 and 8) is the activity of actor 7 in river management: a low level means that the association is minimizing its involvement in river maintenance and a high level means that the association is involved in trying to prevent threats coming from the river;
“Additional funding” (between -7 and 7) is the financial involvement of actor 8 in the project;
“Additional funding 2” (between -6 and 6) is the financial involvement of actor 9 in the project: actor 9 has its own bureaucratic rules to give a project financial assistance. A high level for this resource means harder (mainly ecological) constraints to grant the project;
“Studies” (between -8 and 8) is a study made by actor 10: a positive value means that the study suggests a hydromorphological solution (i.e., an ecological approach that uses the shape of the river for trying to prevent flooding) and a negative value means that the study suggests a hydraulic solution (dike construction, which is less ecological).
The analysis of the debates, notably within the SIAH, shows three main options for the Touch management, each one supported by some of the actors:
1. (O1) protecting the downstream towns
against floods, and defending the interests of these municipalities (supported by actor 6);
2. (O2) protecting the daily life of upstream
villages, and especially protecting agricultural activities (supported by actors 4 and 5);
3. (O3) ensuring a good ecological state of the
aquatic environment (supported by actors 2 and 3).
Upstream and downstream municipalities are interdependent, though their respective interests are different or even conflicting. So the
elaboration of the FRPP includes a fourth option which is probably the main issue of the discussions:
4. (O4) finding a solution which is a
compromise acceptable to the population and its representatives (sought by actors 7, 3, 1, 8 and 9 by order of influence, according to their respective status). This issue is essential because, whatever the chosen solution for the Touch management, it will not be effectively implemented if it is not agreed by most actors.
3. Statistical analysis Dataset description
The dataset contains the outputs of 100 simulations with, for each one, the number of steps, the state of the 10 resources and the satisfaction of the actors at the end of the simulation. The satisfaction of each actor depends on the state of the resources, by a function that involves its stakes and the resources' effect functions (see Equation (1)). Each actors put 3 or 4 stake points on the relation it controls so that its satisfaction depends about one third on its own behavior. The possible range of values of actors' satisfactions are quite varying, from 90 (actor 2) to 195 (actor 6). Their lower bounds (the worst configuration for each of them) are on a scale of – 25 (actor 2) to –85 (actor 6) and their upper bounds (the best configuration) on a scale of 60 (actor 8) to 110 (actor 6).
Univariate Statistical Analysis
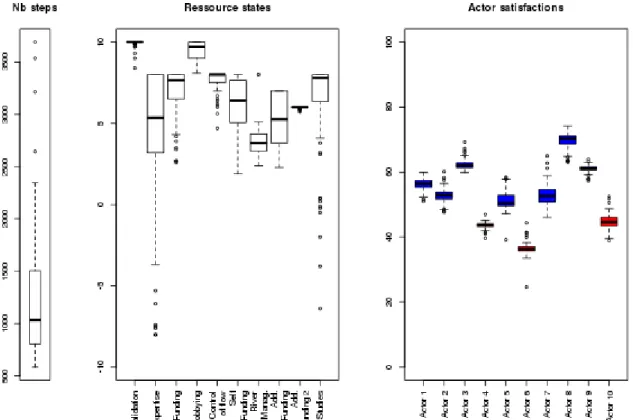
A quick overview of the variable values is provided in Figure 2. The number of steps is strongly skewed with a small number of simulations having a very large number of steps. Most resource states (except for “Self funding”, “River management” and “Additional funding”) also have a skewed distribution, with several outliers having small (and even negative for some of them) values. The scattering of the state variables is very different: some variables have a very small dispersion, like “Validation” (which is frequently equal to 10, the maximum possible value) or “Additional funding 2” which is almost always equal to 6 (also its maximum possible value). For these resources, as well as for “Lobbying”, “Control of flow” and “River management” (but to a lesser extent), the organization's constraints are such that the possible values for these resources seem almost fixed in advance. On the contrary, “Expertise”, or even “Self funding” and “Additional funding” are resources that have a
larger dispersion (for “Expertise” the values go from –8 to 8): the actors which control these resources are less constrained by the organization and a deeper analysis is necessary to decide whether they hesitate between quite similar choices or whether they strategically adapt their behavior to the context.
The satisfactions of most actors are approximately symmetric, but with a small variability regarding their range (most interquartile ranges are less than 3). Red is used to emphasize actors for which the median satisfaction is smaller than 50 (actors which are thus frequently little satisfied: actors 4, 6 and 10) whereas blue is used in the other case. Actors 3, 8 and 9 are the most satisfied in almost all simulations (actor 8 is always the most satisfied). As actor 6 has a low satisfaction, the option (O1) will probably not prevail. The same holds for actors 4 and 5, and thus for the option
(O2), but to a lesser extent. As the satisfaction of
actors 2 and 3 is slightly better, the option (O3)
seems to be the most likely. As the satisfaction of actor 7 is medium, it seems that a compromise that would be acceptable by most actors is possible (O4), and this is compliant with the fact that none of the options (O1), (O2) or (O3) strongly prevails upon the others.
The dispersion of the actors' satisfactions shows that the position of actors 4, 9, 6 and 3 are well settled, while the positions of actors 5 and 7 are more uncertain. Considering their respective range of values, the actor satisfactions are globally more steady (with smaller dispersions) than the resource states: the variation coefficients of actor satisfactions have a range of 0.02 to 0.06, whereas those of resource states have a range of 0.06 to 0.98 (except for “Additional Funding 2”). This fact might be explained by a complex system effect, where the actors compensate the lack of accessibility to an important resource by accessing another one.
Correlation analysis
Figure 3 shows a graphical representation of the correlation coefficients between all pairs of
variables. The number of steps has a slight negative influence on all actors, except for upstream actors 4 and 5. This is a general
Figure 2. Boxplots for the number of steps before the simulations converge (left), the resource states
(middle) and the actor satisfactions (right). For actors, a blue boxplot indicates that the actor has a median satisfaction that is above 50 and a red boxplot indicates that the actor has a median satisfaction that is below 50.
property of the simulation algorithm: long simulations indicate that actors struggle to find a configuration that provides each of them with an acceptable level of satisfaction. This difficulty to cooperate entails lower levels of satisfaction. The correlations between the actors’ satisfactions show two groups of strongly related actors: actors 1, 2, 3 and 7, on the one hand, and, on the other hand, actors 8 and 9. Actors 1, 2 and 3 are organizations that represent the State and carry out public policies. The positive correlation between their satisfactions means that their main interests are consistent and that these three domains of the State policy strengthen one another. Moreover, actor 7, instituted by actor 1 and funded by actor 3, is shown to be in accordance with the State services. Actors 8 and 9 are political institutions and it is not surprising that they have similar interests on topics such as the river management. Moreover, the correlation between the two groups is positive: there is no
conflict between the State and the local authorities.
As for actors 4, 5 and 6, they are highly concerned with the river functioning. They have to be regarded in conjunction with actor 7, which is the place where they can build a compromise together. Actor 5 seems careful; surprisingly, it does not support the farmer association nor is it in conflict with downstream municipalities. The case of actor 4 requires a specific attention: it is in conflict with actors 6 and 7, and also with most of the other actors. However we will see that it is not powerful enough to prevent a decision to be made (this is because the effect functions of the relation it controls have a small amplitude). The satisfaction of actor 7 is positively correlated with those of actors 5 and 6, and also actors 2 and 3: these actors support the options (O1), (O2) or
(O3). This fact confirms the possibility of a
compromise (O4), which has already been pointed out in the analysis of the actor satisfactions.
Some resource states are strongly correlated to actor satisfactions: “Expertise” is strongly correlated with the satisfaction of actor 1, which is explained because actor 1 is strongly concerned with ecological issues. Ecological issues are indeed the main criteria for the level of this resource. “Funding” is strongly correlated to the satisfaction of actors 8 and 9 because a higher financial engagement from actor 3 means a lesser need for their financial effort; moreover, actor 3 bases its degree of implication on ecological issues and so, his concern meets those of actors 8 and 9.
“Control of flow” is the most influential resource on all actors' satisfactions, while its values are small dispersed (see figure 1): it is strongly positively correlated with the satisfaction of actor 4 and it is strongly negatively correlated with the satisfaction of the other actors (except for actor 5): a low level of this resource means a stronger control on river and thus a higher decision power for actors 2, 3, 6 and 7. Finally, “Self funding” is strongly negatively correlated with the satisfaction of actors 5 and 7: a high level for this resource means a higher decision power for actor 6 which
Figure 3. Graphical representation of the correlation coefficients between pairs of
variables: the thinner the ellipse, the larger the absolute value of the correlation coefficient (as described in MURDOCH and CHOW, 1996 and implemented in the R package ellipse). Red ellipses indicate positive correlations whereas blue ones indicate negative correlations, the intensity of the color also matches the absolute value of the correlation coefficient (darker colors are used for larger values).
reduces the decision power of actors 5 and 7. These results show that the behavior of the model is strongly non-linear: contrary to the very structure of the model, the satisfaction of most actors is not strongly correlated to the resource that it controls. The actor might somehow compensate for an unsatisfactory level of its own resource by a better level of the other resources.
The complete explanation of this phenomenon would require further investigations.
There is no remarkable correlation between any pair of relations: the actors' behaviors are independent of one another. There is no coordination or coalition within a subgroup of actors, no actor seems to strongly influence the behavior of another one and, in other words, each actor is autonomous with regard to others.
Hierarchical clustering
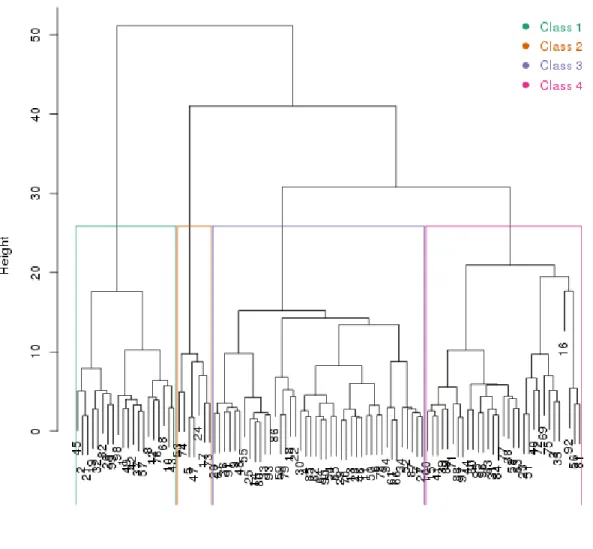
To be able to understand multiple complex correlations between the actor satisfactions and behaviors, pairwise correlations studies are not enough. Multiple correlations can be understood by a number of methods, such as PCA, MDS, clustering... In the present section a hierarchical clustering is performed and analyzed. Figure 4 is the resulting dendrogram, where four clusters of simulations are identified. A first observation is that one simulation is clearly an outlier, the simulation number 16 (at the right hand side of the dendrogram).
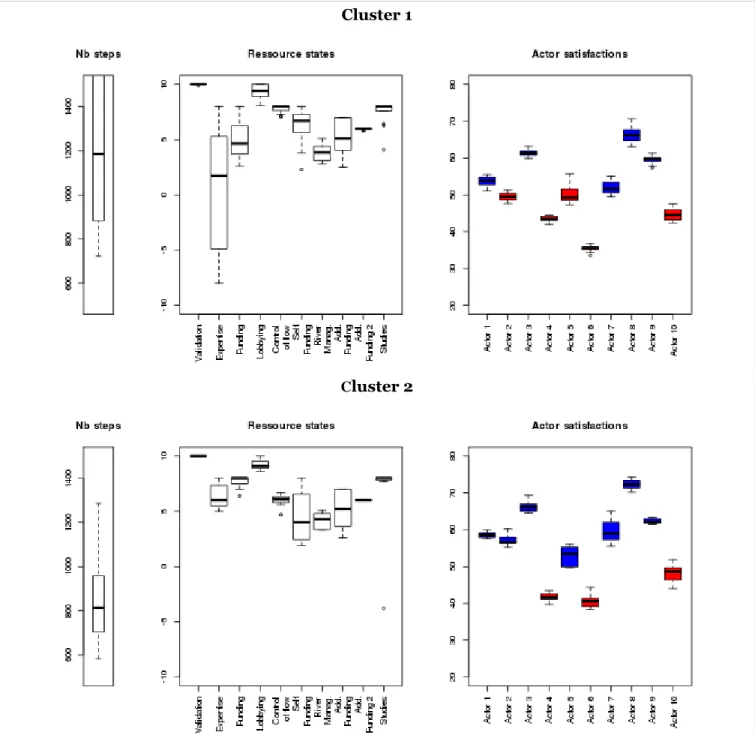
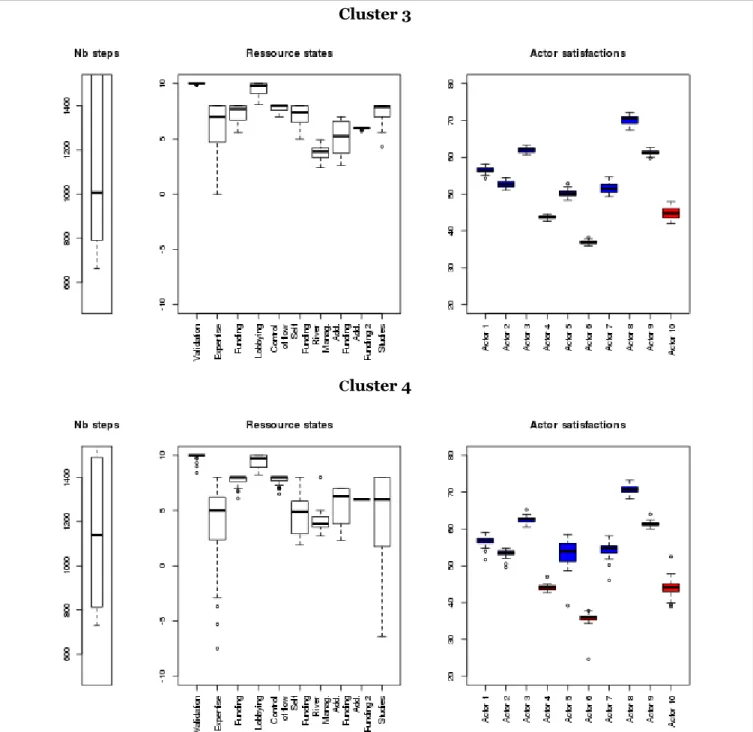
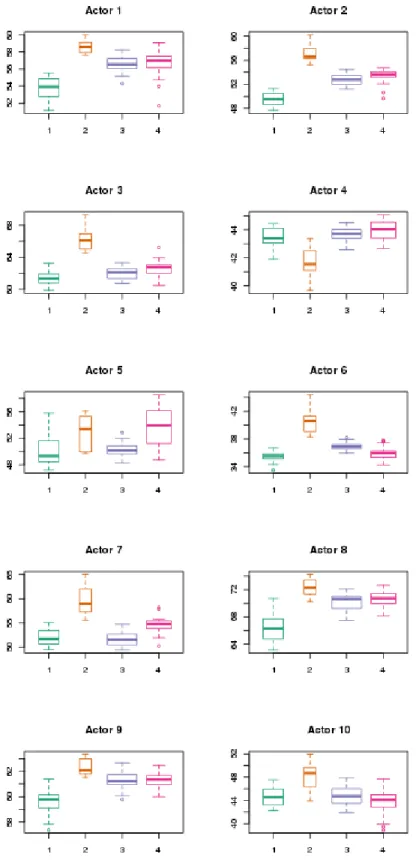
Figures 5 and 6 display an overview of each cluster: the boxplots of the number of steps, of the resource states and of the actor satisfactions for each cluster. They allow us to compare the relative positions of the actors and resources within every cluster. In addition, Figures 7 and 8 display the component point of view: each actor's satisfactions and each resource's states are displayed by cluster, in order to make the comparison between clusters easier to read. The first fact worth noting is that all four clusters are very similar in the way the satisfactions of the different actors are ranked: actors 3, 8 and 9 are always the most satisfied and actors 4, 6 and 10 are always the less satisfied. Besides, comparing the clusters, differences can be emphasized. The most singular cluster is cluster number 2 (containing 7 simulations, in orange): the simulations of cluster 2 are characterized by a higher satisfaction for all actors (especially for actor 6), except for actor 4 (comparatively to the other clusters). This fact is consistent with the small number of steps. Also, notice that the satisfaction of actors 5 and 7 is highly varying, which indicates an unsure position for these actors. On the resource point of view, the cluster is characterized by lower states for the resource “Lobbying” (controlled by actor 4) and also for the “Control of flow”. Another prominent fact of this cluster is that actor 7 is ranked over the others (except for actors 3, 8 and 9 which are at the top in all cases); these facts indicate that these
simulations comply with option (O4). Cluster 2 corresponds to reaching the best compromise in the process of elaborating the new public policy of Touch. Unfortunately it is not the most likely outcome, since the cluster includes only 7% of simulations, but it is a possible outcome.
Cluster 1 (containing 20 simulations, in green) contains simulations that are almost exactly the opposite of cluster 2: in this cluster, all actors have a lower satisfaction than in the other cases, except for actor 4. In these simulations, the state of “Control of flow” is high and the state of “Funding” and “Expertise” is low. These simulations correspond to the success of option
(O2) over the other options: in this option, actors
4 and 5 succeed in making their interest prevails over the other actors' interests. Clusters 3 and 4 (respectively, 42 and 31 simulations, in purple and pink) are clusters with mostly average values, where most actor satisfactions and resource states take an intermediate value between those of clusters 1 and 2. These clusters gather 75% of the simulations and thus correspond to the most likely outcome of the negotiation process. Cluster 3 is characterized by a stable low satisfaction for actors 5 and 7 and by a high state for “Self funding”. These simulations are rather in favor of option (O1). In cluster 4, actors 4 and 5 are more satisfied than in the other clusters and the state of “Self funding” and “Studies” is low. These simulations are rather in favor of option (O2). Finally, simulation 16 (in cluster 4) is very unlike the others: in this simulation the number of steps is low (814 whereas the median number of steps is equal to 1,032 and the average number of steps is equal to 1,259), indicating a fast convergence and thus the likelihood of a good overall satisfaction of the actors. Indeed, almost all actors are very satisfied in this simulation, except for actors 5, 6 and 7 but the main fact worth noting is that all resources have reached their upper bound values in this simulation. We will elaborate on this specific simulation in the next section.
Figure 4: Hierarchical clustering. Experiments are partitioned into 4 clusters (numbered
from 1 (at left) to 4 (at right)) as represented by the colored rectangles. An outlier (simulation number 16) can also be identified (at the right hand side of the figure).
Cluster 1
Cluster 2
Figure 5: Boxplots of the number of steps (left), of the resource states (middle) and of the actor satisfactions
Cluster 3
Cluster 4
Figure 6: Boxplots of the number of steps (left), of the resource states (middle) and of the actor satisfactions
4. Self-organizing map
Finally, the simulations are clustered using a Self-Organizing Map (SOM, KOHONEN, 2000) algorithm. SOM is an unsupervised learning method that maps the data onto a one- or a two-dimensional grid. The grid is made of several neurons in which the simulations are clustered. The grid comes up with a topology and the clustering is performed so that the topological properties of the input space are preserved on the grid: hence, two simulations classified in neurons close on the grid are more alike than two simulations classified in neurons that are distant on the grid. Thus, this method provides clustering combined with visualization where the whole set of simulations can be displayed and the relations between the main features of the simulations can be understood. The size of the grid, as well as its topology, are chosen by the user. A frequent heuristic is to choose a grid having dimensions
/ 10
N and a square or an hexagonal topology. In this application a batch version of the SOM algorithm is used, as implemented in the R package yasomi4.
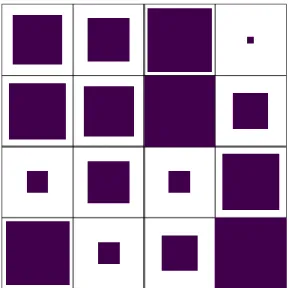
Figure 9 is the “hit map” of the resulting SOM: the size of each cluster corresponds to number of simulations it gathers. The cluster located at the top right corner of the map contains a single
4 Still under development but available at
https://r-forge.r-project.org/projects/yasomi/
observation, simulation 16, described as an outlier in the previous section.
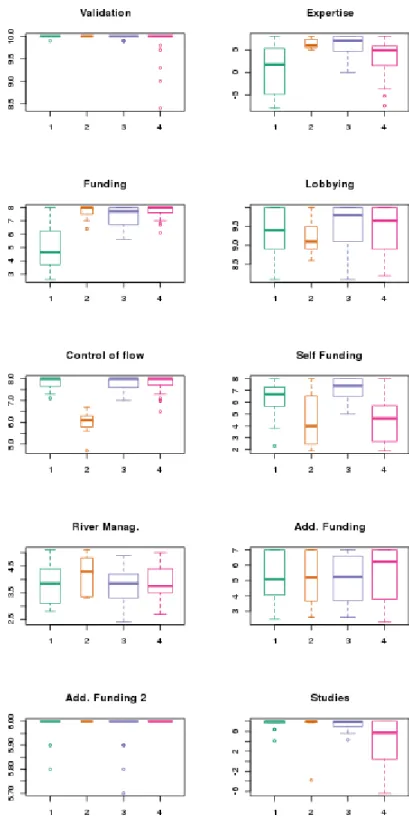
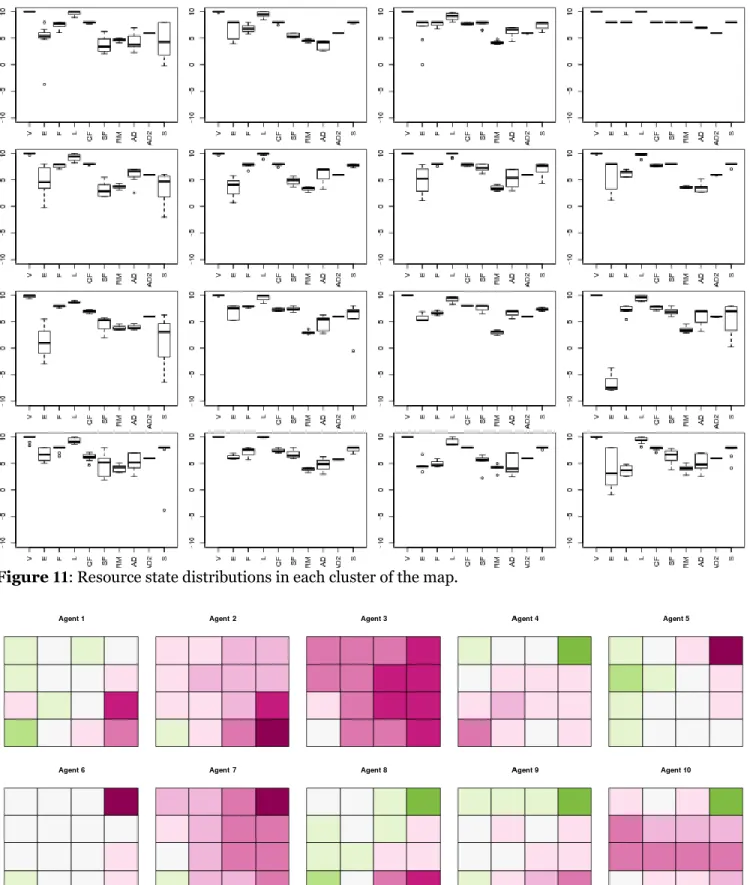
Figures 10 and 11 display the clusters' profiles, regarding the actor satisfactions and the resource states, respectively. On the contrary, Figures 12 and 13 display, with a color scale, the average values of the variables by cluster, compared to the global range of the variables, to make the comparison between clusters easier.
Figure 9. Hitmap: the size of each colored square
is proportional to the number of simulations classified in the corresponding neuron.
Figure 10: Actor satisfaction distributions in each cluster of the map. Blue boxplot are those for which the
median of the corresponding actor's satisfaction is above 50 and red boxplot are those for which the median of the corresponding actor's satisfaction is below 50.
Figure 11: Resource state distributions in each cluster of the map.
Figure 12: Average actor satisfactions by cluster: dark green corresponds to the highest values and dark pink to
Regarding the map, the most typical simulation cases are:
at the top right hand side of the map, that corresponds to simulation 16, most actors are not satisfied, except for actors 4, 8, 9 and 10. There, actor 4 is much more satisfied than in the other clusters. Moreover, the simulation shows a lower satisfaction of upstream villages (low values for “Expertise” and “Funding”) and a high satisfaction for the riparian farmers (higher value for “Lobbying” and “Control of flow”). Although all resources are at their top level, the outcomes of these simulations show some inconsistencies:
(O1) is not likely (for actor 6, this is the
worst case), neither (O2) (despite the fact that actor 4 is very satisfied, actor 5 is not), neither (O3) (this is also the worst case scenario for actor 3). This is confirmed by the failure of (O4) (for actor 7, this is the worst case scenario). So this cluster corresponds to a case having a very low social plausibility because every actor is losing;
the left hand side of the map is characterized by an opposite description: most actors are quite satisfied and the level of self funding, coming from actor 6, is high. These simulations also show a high level of funding coming from actor 3. Most simulations of cluster 2 of the hierarchical clustering are classified on the left hand side of the map, and especially
on the top left corner, which is thus representative of option (O4);
the center of the map (from the bottom left corner to the upper right corner) contains simulations that were classified in the two other clusters of the hierarchical clustering of the previous section. In particular, simulations of cluster 4 are classified in the bottom left corner and those of cluster 3 in the upper right hand side of the map (except for the neuron containing only one simulation). These simulations correspond to intermediate outcomes between the two main options (O2) and (O4). These outcomes are closer to options (O1) and
(O3).
The self-organizing map algorithm thus leads to conclusions similar to the ones found with the hierarchical clustering algorithm. This approach provides the user also with a representation of the set of simulations as a map and thus gives him an intuitive overview on their respective similarities, proximities or differences. It details the possibilities of each resource and each actor. However, from the point of view of the system of collective, this level of details can make it more difficult to identify the social patterns that emerge from the simulations.
4. Conclusion and discussion
In the field of social simulation, most of the considered cases are rough simplification of a
Figure 13: Average resource states by cluster: dark green corresponds to the highest values and dark pink to the
phenomenon which is modeled as a “stylized fact”. The purpose of such simulation models is to propose a mechanism, as simple as possible, that is able to generate the phenomenon as an emergence from the interactions between the system’s components. In this case, the study of the simulation outputs is easy and brings only one information: outputs are expected to be steadily focused since their dispersion means that the proposed mechanism is not a good explanation of the cause of the phenomenon.
On the other hand, the data analysis of simulation outputs is a source of valuable knowledge when, as it is our case, the simulation refers to a concrete system. In this case, the purpose of simulation is not just to get a “good fit” between the expected results and the model outputs; the distribution of simulation outputs is meaningful and it may be compared with field data on the system under study5. On the contrary, the actual configuration which is observed is interpreted as just one of the possible functioning of the system. This functioning has stabilized the actors’ behavior more or less steadily, as the result of past events, contingent opportunities or constraints, random choices made at bifurcation points, or whatever circumstance. A social system exhibits only one of its potentialities and most systems could operate in another way under other circumstances, to the extent of their adaptability. The benefice of the statistical analysis of simulation outputs is to reveal these other possible functioning.
The analysis of the set of simulations leads to the conclusion that two main opposite options are likely to happen: on the one hand, upstream villages are taking the best over the other actors and the daily-life of upstream villages is the main factors influencing the final decision (option
(O2)) or a compromise acceptable for all actors is
found (option (O4)). In between these two main configurations, the simulations tend to favor more or less one or the other of the two options. This typology is well represented on the map produced by the SOM algorithm.
For the sociologist, his questioning about the power relationships within the management of the river Touch led to the statement of four hypotheses (see (SIBERTIN-BLANC et al. 2013c)
5 Here, we assume the scientific legitimacy of a
quantitative approach of social affairs and, in the case of this paper, the feasibility of faithful SocLab models. We do not elaborate on this, see e.g. ROGGERO and SIBERTIN-BLANC, 2008, for further discussion.
for the sociological theories that ground theses hypotheses):
Hypothesis 1: To be the “obligatory passage
point” of the Actor-Network, is that SIAH has enough power to somehow constrain other actors?
Hypothesis 2: Purposing to play an important
role and to introduce a change in the management of flood risk, is that SIAH has the means to do so?
Hypothesis 3: In the enrolment of other actors
on the service of a hydromorphological management of the river, is that SIAH has powerful allies?
Hypothesis 4: Is that the agreement on the
“Territorial Public Interest” is confirmed by the absence of major conflict in the system of action? The SocLab model presented in this paper has been developed to serve as a benchmark for testing these hypotheses, and the provided answers integrate arguments coming from both statistical analysis of simulation output and analytical properties of the very model. All in all, the SocLab analysis of the case confirms the hypotheses 1, 2 and 3, but not the hypothesis 4 that is a necessary condition for option O4.
Acknowledgement
The SocLab model of the management of the Touch, presented in the second Section of this article, relies on the field survey of Bertrand Baldet (see BALDET, 2012).
The authors are also grateful to Soraya Popic, who developed some of the R scripts used in this analysis during her internship in the IRIT laboratory, to the anonymous referee for his comments and suggestions and to Dominique Haughton for her careful proofreading. This work is funded by the “Maison des Sciences de l'Homme et de la Société de Toulouse”6.
Correspondence: [email protected]
REFERENCES
Axelrod, R. 1997. The Complexity of Cooperation. Princeton University Press, Princeton, NJ. Baldet, B. 2012. Gérer la rivière ou la crue ? Le
gouvernement du risque d’inondation entre enjeux localisés et approche instrumentée. Le cas de la vallée du Touch en Haute-Garonne.
PhD Thesis (Sociology), Université de Toulouse, June, 26th.
Chapron, P. 2012. Modélisation et analyse des organisations sociales : propriétés structurelles,
régulation des comportements et évolution. PhD Thesis (Computer Science), Université de Toulouse, May, 29th.
Crozier, M. 1964. The Bureaucratic Phenomenon. The University of Chicago Press, Chicago, USA. Crozier, M. and Friedberg, E. 1980. Actors and
Systems. The Politics of Collective Action. The
University of Chicago Press, Chicago, USA. El Gemayel, J. 2013. Études de modèles de la
rationalité des acteurs sociaux. PhD Thesis, Université Toulouse 1 – Capitole, Juin 2013 El Gemayel, J., Chapron, P. and Sibertin-Blanc, C.
2011. Impact of tenacity upon the behaviors of social actors. In: Advances in Practical
Multi-Agent Systems, Quan Ban and Naoki Fukuta
(eds). Studies in Computational Intelligence 325: 287-306. Springer.
Kohonen, T. 2000 Self-Organizing Maps. Springer series in Information Science. Springer-Verlag Berlin and Heidelberg. 3rd edition.
Murdoch, D.J. and Chow, E.D. 1996. A graphical display of large correlation matrices. The
American Statistician 50: 178-180.
Roggero, P. and Sibertin-Blanc, C. 2008. Quand des sociologues rencontrent des informaticiens : essai de formalisation des systèmes d'action concrets. Nouvelles Perspectives en Sciences
Sociales 3 (2): 41-81 Edition Prises de Parole,
Ontario.
Sibertin-Blanc, C. Roggero, P., Adreit, F., Baldet, B., Chapron, P., El Gemayel, J. Mailliard, M. and Sandri, S. 2013a. SocLab: A Framework for the Modelling, Simulation and Analysis of Power in Social Organizations. Journal of Artificial
Societies and Social Simulation, University of
Surrey, UK, 2013. In Press
Sibertin-Blanc, C. and El Gemayel J. 2013b. Boundedly Rational Agents Playing the Social Actors Game - How to reach cooperation. Proceeding of IEEE Intelligent Agent Technology, Lisa O'Conner (Ed.), 17-20 nov. 2013, Atlanta. Forthcoming.
Sibertin-Blanc, C. Roggero, P. and Baldet, B. 2013c. Interplay between stakeholders of the management of a river. CoMSES,
Computational Model Library,
http://www.openabm.org/model/3760. Simon, H.A. 1955. A behavioral model of rational
choice. Quaterly Journal of Economics, 69: 99-118.
Sutton, R.S. and Barto, A.G. 1998. Reinforcement
Learning: An Introduction. A Bradford Book,
The MIT Press, Cambridge, MA, London, England.
Appendix: material description
The dataset is provided as a csv file separated by tabulations named runs-soclab.csv; it was generated from the SocLab simulation plateform
http://soclabproject.wordpress.com.
The statistical analysis was done using the free statistical software environment R and the packages
ellipse and yasomi were used for that purpose.
Most results and other additional analyses can be made using the scripts available on the web page
http://www.nathalievilla.org/spip.php?articl e86
(this page is unfortunately only in French for the moment). In particular, the analyses described in this paper can be made using the functions CORR(), CAH() and SOM().